. 2024 May 3;20(5):e1012205.
doi: 10.1371/journal.ppat.1012205. eCollection 2024 May.

Mycobacterium tuberculosis resides in lysosome-poor monocyte-derived lung cells during chronic infection

Affiliations

Mycobacterium tuberculosis resides in lysosome-poor monocyte-derived lung cells during chronic infection

Weihao Zheng et al. PLoS Pathog. .

Abstract

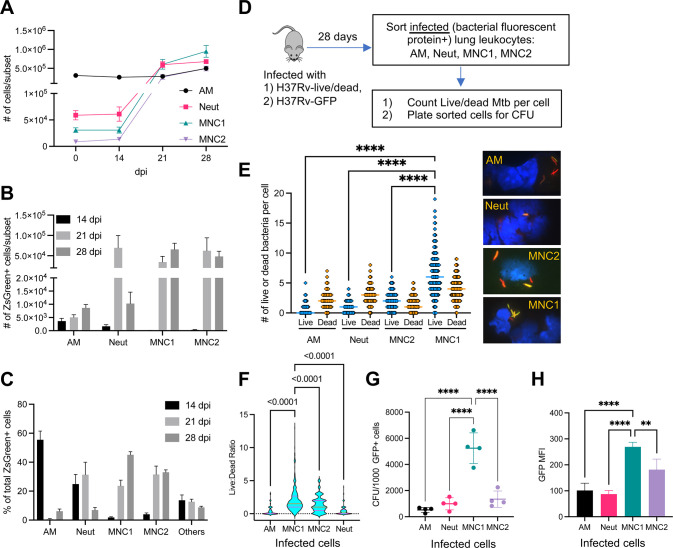
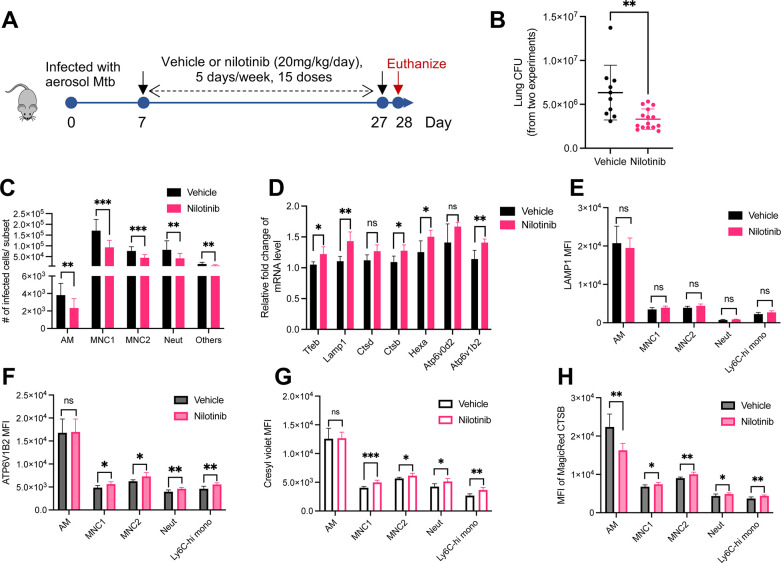
Mycobacterium tuberculosis (Mtb) infects lung myeloid cells, but the specific Mtb-permissive cells and host mechanisms supporting Mtb persistence during chronic infection are incompletely characterized. We report that after the development of T cell responses, CD11clo monocyte-derived cells harbor more live Mtb than alveolar macrophages (AM), neutrophils, and CD11chi monocyte-derived cells. Transcriptomic and functional studies revealed that the lysosome pathway is underexpressed in this highly permissive subset, characterized by less lysosome content, acidification, and proteolytic activity than AM, along with less nuclear TFEB, a regulator of lysosome biogenesis. Mtb infection does not drive lysosome deficiency in CD11clo monocyte-derived cells but promotes recruitment of monocytes that develop into permissive lung cells, mediated by the Mtb ESX-1 secretion system. The c-Abl tyrosine kinase inhibitor nilotinib activates TFEB and enhances lysosome functions of macrophages in vitro and in vivo, improving control of Mtb infection. Our results suggest that Mtb exploits lysosome-poor lung cells for persistence and targeting lysosome biogenesis is a potential host-directed therapy for tuberculosis.


Conflict of interest statement

The authors have declared that no competing interests exist.

Figures

Fig 1
Fig 1. MNC1 are highly permissive for Mtb intracellular survival.
C57BL/6 mice were infected with the designated strain of Mtb by low-dose aerosol. Lung cells were isolated at the indicated time points post infection. (A) Lung phagocyte population dynamics after Mtb (H37Rv-ZsGreen) infection. Neutrophils (Neut), MNC1, and MNC2 increase in response to Mtb infection, while the number of alveolar macrophages (AM) changed minimally (n = 4–5). (B) Number of Mtb H37Rv-ZsGreen+ cells in distinct lung phagocyte subsets by flow cytometry (n = 4–5). (C) Cell type composition of total Mtb H37Rv-ZsGreen+ lung leukocytes by flow cytometry. After early predominant distribution of Mtb in AM and neutrophils, MNC1 and MNC2 dominate by 28 dpi (n = 4–5). (D) Schematic diagram of procedures to quantitate intracellular live Mtb in sorted lung phagocyte subsets. C57BL/6 mice (n = 10) were infected with Mtb H37Rv-live/dead or H37Rv-GFP and cells containing fluorescent protein-expressing bacteria were analyzed at 28 dpi. (E) MNC1 contain the largest number of live Mtb per cell 28 dpi. Quantitation of live (GFP+mCherry+) or dead (GFP-mCherry+) Mtb per infected cell (n ≥ 300) was performed by fluorescence microscopy on viable cells sorted from mice infected with Mtb H37Rv-live/dead. Representative images on the right show live and dead Mtb. Dead (mCherry+GFP-) Mtb are red; live (mCherry+GFP+) appear yellow. The majority of the Mtb in AM and neutrophils are dead, while the majority of the bacteria in MNC1 and MNC2 are live (MNC1>MNC2). Images were taken using a 63x oil objective. (F) The ratio of live to dead bacteria in individual cells was calculated from the raw data used for Fig 1E. The orange horizontal bar indicates the median and the pink horizontal bars indicate the 25th and 75th percentiles. Statistical comparisons used the Kruskal-Wallis test with Dunn’s multiple comparisons test. (G) MNC1 contain the largest number of live Mtb (H37Rv-GFP) at 28 dpi. Cells in each subset were sorted according to surface phenotypes and for bacterial status (GFP+). CFU of sorted GFP+ cells in each subset were counted after 3 wk of incubation. The results are expressed as CFU per 1000 GFP+ cells in each subset. (H) GFP MFI correlates with live Mtb burdens in the 4 infected lung myeloid cell subsets from mice infected with H37Rv-GFP (28 dpi). Results are presented as mean ± SD. Representative data from two independent experiments are shown for (A-C, G-H). **p<0.01 ****p<0.0001 by one-way ANOVA for (E, G, H).
Fig 2
Fig 2. RNA-seq analysis of live-sorted phagocyte subsets from lungs of Mtb-infected mice reveals evidence of deficient lysosome biogenesis in MNC1.
C57BL/6 mice (n = 20) were infected with Mtb H37Rv-mCherry by low dose aerosol. After 28 days, 10,000 live cells from each subset in each of the 4 pools (5 infected mice per pool) were sorted directly into RNAlater and processed for bulk RNA-seq. (A) t-stochastic neighbor embedding (t-sne) plot showing distinct clusters of four myeloid cell types based on RNA sequencing on cells sorted from lungs of Mtb H37Rv-mCherry infected mice. Within a clustered subset there is substantial overlap between Mtb infected and bystander cells after exclusion of one infected MNC1 outlier sample. (B) Heatmap showing separation of four distinct cell types based on Z-scores from variance stabilized read counts for lineage markers. The color coding of the cell types shown at the bottom corresponds to the colors in (A). (C) Dot plot showing 7 of 18 KEGG pathways that differ significantly with an enrichment ratio greater than 0.04 for AM, MNC2, neutrophils, combined analysis (AM, MNC2, neutrophils) and MNC1. The color represents the adjusted p values, the graph is ordered by descending values (lowest p value = 1.5 x 10⁻¹⁶ for the lysosome pathway, combined analysis), while the dot size is proportional to the gene count. (D) Heatmap of the Z-scores from variance stabilized read counts for significantly differentially expressed genes of KEGG lysosome pathway shows separation of MNC1 from AM, MNC2, and neutrophils.
Fig 3
Fig 3. MNC1 cells are deficient in lysosomal cathepsin proteolytic activities.
C57BL/6 mice were infected by aerosol with ~100 Mtb H37Rv-ZsGreen or H37Rv-mCherry. At 28 dpi, mouse lungs were harvested for analysis. (A-B) Representative histograms and MFI of the fluorescent product of CTSB activity for AM and MNC1. Lung cells from mice infected with H37Rv-ZsGreen (28 dpi, n = 4) were incubated with MagicRed CTSB substrate for 30 min, and stained with antibodies for discrimination of cell subsets, followed by flow cytometry analysis. (C) CTSB activities in cells sorted from mice (n = 10) infected with H37Rv-mCherry for 28 days, analyzed by confocal microscopy. Live-sorted cells from each cell subset were treated with the fluorogenic CTSB substrate in the absence or presence of Bafilomycin A1 (BafA, 100 nM) for 1 h. Cells were fixed and analyzed by confocal microscopy. Images were taken using a 100x oil objective. Scale bars, 10 μm. (D) Quantification of fluorogenic CTSB product fluorescence per cell from the left panel in (C). >100 cells per subset were analyzed using ImageJ. (E) Pan-cathepsin activities in cells sorted from lungs of mice (n = 10) infected with H37Rv-mCherry (28 dpi). Sorted cells were treated with a pool of MagicRed fluorogenic cathepsin substrates (CTSB+CTSK+CTSL) in the absence or presence of 100 nM BafA for 1 h. Images were taken using a fluorescence microscope with a 100x oil objective. Scale bars, 10 μm. (F) Quantification of Pan-cathepsin product fluorescence per cell from the left panel of (E). >100 cells per subset were analyzed using ImageJ. ***p<0.001, ****p<0.0001 by one-way ANOVA (B, D, F). Results are presented as mean ± SD. Representative data from two independent experiments are shown for (A-D).
Fig 4
Fig 4. MNC1 cells exhibit defective lysosome acidification.
C57BL/6 mice were infected by aerosol with ~100 Mtb H37Rv-ZsGreen or H37Rv-mCherry. At 28 dpi, mouse lungs were harvested for analysis. (A) Heatmap of the Z-scores from variance stabilized read counts for differentially expressed V-ATPase subunit genes in AM, MNC1 and MNC2. (B) Representative histograms and MFI of ATP6V1B2 protein immunostaining by flow cytometry of fixed and permeabilized cell subsets from mice infected with H37Rv-ZsGreen (28 dpi, n = 5). (C) Immunofluorescence analysis of four V-ATPase subunits in cells sorted from H37Rv-mCherry-infected mice (28 dpi, n = 10). Representative images were taken by a fluorescence microscope with a 40x oil objective. Scale bars, 10 μm. Quantification of V-ATPase subunit fluorescence per cell from >100 cells per subset was done using ImageJ. (D) Cresyl violet assay of lysosome acidification in cells sorted from lungs of mice infected with H37Rv-mCherry (28 dpi, n = 10). Sorted cells were treated with 5 μM cresyl violet in the absence or presence of BafA (100 nM) and NH4Cl (10 mM) for 30 min. Images were taken using a confocal microscope with a 100x oil objective. Scale bars, 10 μm. (E) Quantification of cresyl violet fluorescence per cell for the left panel in (D) using ImageJ (>100 cells of each type). (F) Representative histograms and MFI of the cresyl violet (CSV) signal for AM and MNC1 (28 dpi, n = 4). Lung single cells were incubated with 2 μM cresyl violet in the absence or presence of BafA (200 nM) for 30 min in the cell incubator. (G) Immunofluorescence analysis of CTSB protein in cells sorted from H37Rv-mCherry-infected mice (28 dpi, n = 10). Representative images were taken using a confocal microscope with a 100x oil objective. Scale bars, 10 μm. (H) Quantification of CTSB protein immunostaining MFI per cell for (G) by ImageJ (>100 cells per subset). (I) Immunofluorescence analysis of LAMP1 in cells sorted from H37Rv-mCherry-infected mice (28 dpi, n = 10). Representative images were taken by a confocal microscope with a 100x oil objective. Scale bars, 10 μm. (J) Quantification of LAMP1 MFI per cell for (I) by ImageJ (>100 cells per subset). (K) Representative histograms and MFI of intracellular LAMP1 analyzed by flow cytometry for AM and MNC1 from mice infected with Mtb H37Rv-ZsGreen (28 dpi, n = 5). *p<0.05, **p<0.01, ****p<0.0001 by one-way ANOVA (B-C, E) or unpaired Student’s t test (F). Data are presented as mean ± SD. Representative data from 2–3 independent experiments are shown for (B, D- E).
Fig 5
Fig 5. MNC1 are deficient in lysosomal cathepsin B and LAMP1.
C57BL/6 mice were infected by aerosol with ~100 Mtb H37Rv-ZsGreen or H37Rv-mCherry. At 28 dpi, mouse lungs were harvested for analysis. (A) Immunofluorescence analysis of CTSB protein in cells sorted from H37Rv-mCherry-infected mice (28 dpi, n = 10). Representative images were taken using a confocal microscope with a 100x oil objective. Scale bars, 10 μm. (B) Quantification of CTSB protein immunostaining fluorescence per cell for (G) by ImageJ (>100 cells per subset). (C) Immunofluorescence analysis of LAMP1 in cells sorted from H37Rv-mCherry-infected mice (28 dpi, n = 10). Representative images were taken by a confocal microscope with a 100x oil objective. Scale bars, 10 μm. (D) Quantification of LAMP1 fluorescence per cell for (I) by ImageJ (>100 cells per subset). (E) Representative histograms and fluorescence of intracellular LAMP1 analyzed by flow cytometry for AM and MNC1 from mice infected with Mtb H37Rv-ZsGreen (28 dpi, n = 5). (F) Lung cells were pulsed with 20 μg/mL Dextran-Alexa Fluor 647 for 1h and chased for another 1h. Samples were then processed for flow cytometry analysis. *p<0.05, **p<0.01, ***p<0.001, ****p<0.0001 by one-way ANOVA (B, D, E, F). Data are presented as mean ± SD. Representative data from 2–3 independent experiments are shown for (A-E).
Fig 6
Fig 6. TFEB in MNC1 is predominantly cytosolic.
C57BL/6 mice were infected with by aerosol with ~100 Mtb H37Rv-mCherry. At 28 dpi, lung cells were harvested for analysis. (A) RNA-seq data show that MNC1 express lower levels of Tfeb mRNA than do AM (28 dpi). The adjusted p-value shown is from the analyses of the dataset using DESeq2 as described in the methods section. DESeq2 employs the Wald test (n = 8 for AM and MNC2, n = 7 for MNC1). (B) AM have more nuclear TFEB than MNC1. Cells were isolated and sorted from lungs of mice infected with H37Rv-mCherry (28 dpi, n = 10). Anti-TFEB antibody was used for detecting TFEB in sorted cells of each subset. Representative images were taken by a confocal microscope with a 100x oil objective. Scale bars, 10 μm. (C-D) Quantification of total TFEB fluorescence and nuclear TFEB fluorescence per cell in (B) from >100 cells of each subset using ImageJ. (E) A model showing that Mtb restriction or survival depending on the functional lysosome abundance in distinct lung mononuclear cell subsets during chronic infection. ****p<0.0001 by one-way ANOVA (C, D). Data: mean ± SD. Representative data from two independent experiments are shown for (B-D).
Fig 7
Fig 7. c-Abl inhibitors activate TFEB, enhance lysosome biogenesis, and improve control of intracellular Mtb in cultured primary macrophages.
(A) Torin1 (mTOR inhibitor) and two c-Abl kinase inhibitors (imatinib and nilotinib) increase nuclear translocation of TFEB. BMDM were treated with DMSO or the indicated small molecules for 4 h. Then, cells were fixed and stained with an anti-TFEB antibody. Scale bar, 20 μm. (B) Quantification of nuclear TFEB MFI per cell from >57 cells for each condition in (A) using ImageJ. (C) Imatinib and nilotinib increase lysosome gene expression. qPCR results of lysosome genes for BMDM treated with DMSO or the indicated small molecules for 24 h (n = 3). (D) BMDM were transfected with the designated siRNA (20 nM) for 48 h, then treated with nilotinib (5 μM) for 18 h. The mRNA levels of lysosome genes were detected by qPCR. siNT: non-targeting siRNA control; n = 3. (E) Histograms and MFI of LAMP1 and ATP6V1B2 for uninfected BMDM treated with small molecules for 24 h. (F) Histograms and MFI of cresyl violet for uninfected BMDM treated with small molecules for 24 h or 72 h (n = 3). (G) Imatinib and nilotinib induce cathepsin B enzymatic activity. Histograms and MFI of fluorogenic cathepsin B product for H37Rv-infected BMDM treated with inhibitors for 72 h (n = 3). (H) MFI of fluorogenic cathepsin B product in siRNA transfected BMDM (n = 3). (I) Imatinib and nilotinib enhance lysosome acidification. BMDM were infected with H37Rv-ZsGreen (MOI = 2), then treated with DMSO, imatinib (10 μM), or nilotinib (5 μM). BMDM were stained with DAPI and lysotracker at 24 hpi. Scale bar, 10 μm. (J) Imatinib and nilotinib enhance Mtb phagolysosome maturation in cultured primary macrophages. Quantification of Mtb co-localizing with lysotracker for (I) from >20 images per condition using JACoP in ImageJ. (K) Imatinib and nilotinib enhance control of Mtb in primary macrophages. BMDM were infected with H37Rv at MOI = 1 (n = 4), then treated with DMSO or indicated small molecules for 4 days. Cells were then lysed and plated for CFU assay. (L) siRNA-transfected BMDM were infected with Mtb H37Rv (MOI = 1) and then treated with nilotinib (2 μM) for 4d. Viable intracellular bacteria were quantitated by CFU assay. Shown are pooled data from two independent experiments (n = 8 for each condition). Results are presented as mean ± SD. Representative data from 2–3 independent experiments are shown for (A, B, F, G, K). *p<0.05, **p<0.01, ***p<0.001, ****p<0.0001 by unpaired Student’s t test (B-D, E-H, J-L). ns: not significant.
Fig 8
Fig 8. Nilotinib treatment of Mtb-infected mice activates lysosome functions of lung myeloid subsets and reduces lung bacterial burdens.
(A) Experimental protocol for treatment of Mtb-infected C57BL/6 mice. Mice infected with Mtb H37Rv-ZsGreen were treated with vehicle or nilotinib (20 mg/kg/day) intraperitoneally, 5 days/week, for a total of 15 doses beginning at 7 dpi and ending at 27 dpi. At 28 dpi, mice were euthanized, and lungs were harvested for analysis. (B-C) Nilotinib treatment of mice (B) decreases overall Mtb lung bacterial burdens and (C) reduces infected lung myeloid cells in treated mice (28 dpi). Shown are pooled data from two independent experiments (Vehicle: n = 10; nilotinib, n = 15). (D) Nilotinib treatment of Mtb-infected mice increases expression of lysosome genes in lungs (qPCR analysis). Gapdh was used as a control (Vehicle: n = 4; nilotinib, n = 6). (E) Nilotinib treatment of Mtb-infected mice increases LAMP1 expression in recruited lung phagocyte subsets. Flow cytometry quantitation of intracellular LAMP1 MFI in lung subsets from mice infected with H37Rv-ZsGreen treated with vehicle or nilotinib (28 dpi, vehicle: n = 5; nilotinib, n = 8). (F) Nilotinib treatment of Mtb-infected mice increases lysosomal V-ATPase subunit ATP6V1B2 expression in recruited lung phagocyte subsets. Flow cytometry quantitation of intracellular ATP6V1B2 MFI in lung subsets from mice infected with H37Rv-ZsGreen treated with vehicle or nilotinib (28 dpi, vehicle: n = 5; nilotinib, n = 8). (G) Nilotinib treatment of Mtb-infected mice increases lysosomal acidification. Cresyl violet MFI quantitated by flow cytometry for lung subsets from H37Rv-ZsGreen-infected mice treated with vehicle or nilotinib (28 dpi, vehicle: n = 5; nilotinib, n = 8). (H) Nilotinib treatment of Mtb-infected mice increases lysosomal cathepsin B activity in recruited phagocytes, but not resident (alveolar) macrophages. MFI of fluorogenic MagicRed CTSB product in lung subsets from mice treated with vehicle or nilotinib (28 dpi) quantitated by flow cytometry (vehicle: n = 5; nilotinib, n = 8). Results are presented as mean ± SD. Representative data from two independent experiments are shown for (E, F, G). *p<0.05, **p<0.01, ***p<0.001, by unpaired Student’s t test (B-H). ns: not significant.

Update of

References

    1. Ernst JD. Mechanisms of M. tuberculosis Immune Evasion as Challenges to TB Vaccine Design. Cell Host Microbe. 2018;24(1):34–42. Epub 2018/07/13. doi: 10.E1016/j.chom.2018.06.004 ; PubMed Central PMCID: PMC6482466. - DOI - PMC - PubMed
    1. Upadhyay S, Mittal E, Philips JA. Tuberculosis and the art of macrophage manipulation. Pathogens and disease. 2018;76(4). Epub 2018/05/16. doi: 10.1093/femspd/fty037 ; PubMed Central PMCID: PMC6251593. - DOI - PMC - PubMed
    1. Churchyard G, Kim P, Shah NS, Rustomjee R, Gandhi N, Mathema B, et al.. What We Know About Tuberculosis Transmission: An Overview. J Infect Dis. 2017;216(suppl_6):S629–s35. Epub 2017/11/08. doi: 10.1093/infdis/jix362 ; PubMed Central PMCID: PMC5791742. - DOI - PMC - PubMed
    1. Cambier CJ O’Leary SM, O’Sullivan MP, Keane J, Ramakrishnan L. Phenolic Glycolipid Facilitates Mycobacterial Escape from Microbicidal Tissue-Resident Macrophages. Immunity. 2017;47(3):552–65.e4. Epub 2017/08/29. doi: 10.1016/j.immuni.2017.08.003 ; PubMed Central PMCID: PMC5610147. - DOI - PMC - PubMed
    1. Cohen SB, Gern BH, Delahaye JL, Adams KN, Plumlee CR, Winkler JK, et al.. Alveolar Macrophages Provide an Early Mycobacterium tuberculosis Niche and Initiate Dissemination. Cell Host Microbe. 2018;24(3):439–46.e4. Epub 2018/08/28. doi: 10.1016/j.chom.2018.08.001 ; PubMed Central PMCID: PMC6152889. - DOI - PMC - PubMed

MeSH terms