. 2024 May 7;121(19):e2315348121.
doi: 10.1073/pnas.2315348121. Epub 2024 May 3.

OTUB2 silencing promotes ovarian cancer via mitochondrial metabolic reprogramming and can be synthetically targeted by CA9 inhibition

Affiliations

OTUB2 silencing promotes ovarian cancer via mitochondrial metabolic reprogramming and can be synthetically targeted by CA9 inhibition

Yabing Nan et al. Proc Natl Acad Sci U S A. .

Abstract

Ovarian cancer is an aggressive gynecological tumor characterized by a high relapse rate and chemoresistance. Ovarian cancer exhibits the cancer hallmark of elevated glycolysis, yet effective strategies targeting cancer cell metabolic reprogramming to overcome therapeutic resistance in ovarian cancer remain elusive. Here, we revealed that epigenetic silencing of Otubain 2 (OTUB2) is a driving force for mitochondrial metabolic reprogramming in ovarian cancer, which promotes tumorigenesis and chemoresistance. Mechanistically, OTUB2 silencing destabilizes sorting nexin 29 pseudogene 2 (SNX29P2), which subsequently prevents hypoxia-inducible factor-1 alpha (HIF-1α) from von Hippel-Lindau tumor suppressor-mediated degradation. Elevated HIF-1α activates the transcription of carbonic anhydrase 9 (CA9) and drives ovarian cancer progression and chemoresistance by promoting glycolysis. Importantly, pharmacological inhibition of CA9 substantially suppressed tumor growth and synergized with carboplatin in the treatment of OTUB2-silenced ovarian cancer. Thus, our study highlights the pivotal role of OTUB2/SNX29P2 in suppressing ovarian cancer development and proposes that targeting CA9-mediated glycolysis is an encouraging strategy for the treatment of ovarian cancer.

Keywords: chemoresistance; metabolic reprogramming; ovarian cancer; tumorigenesis; ubiquitination.


Conflict of interest statement

Competing interests statement:The authors declare no competing interest.

Figures
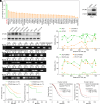
Fig. 1.
Fig. 1.
Silencing of OTUB2 by DNA hypermethylation is correlated with poor prognosis in ovarian cancer patients. (A) Relative gene expression levels of 45 DUBs in cells treated with 5-aza (10 μM) compared to those in cells treated with DMSO. (B) Western blot analysis of OTUB2 protein expression in cells treated with 5-aza (10 μM) compared to that in cells treated with DMSO. (C) Western blot analysis of OTUB2 expression levels in a panel of ovarian cancer cell lines. (D) Methylation-specific PCR was performed to evaluate OTUB2 promoter methylation levels in ovarian cancer cell lines and patient samples. (E and F) BGS was used to evaluate the methylation levels of the OTUB2 promoter region in various ovarian cancer cell lines (E) and in ovarian cancer cell lines treated with 5-aza or DMSO (F). Methylation percentages were calculated from the number of methylated clones among the 10 clones picked for sequencing. (G and H) Prognostic analyses of ovarian cancer patients with low or high OTUB2 expression (stratified by the mean OTUB2 expression level in all samples). Kaplan–Meier survival plots are shown. (I and J) Prognoses of ovarian cancer patients with low or high OTUB2 expression from the TCGA database.
Fig. 2.
Fig. 2.
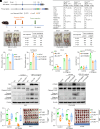
OTUB2 silencing promotes ovarian cancer progression. (A and B) Schematics showing the Otub2-knockout strategy for the mouse model (A) and the DMBA induction experimental timeline (B). (C) Tumor incidence in various organs from 32-wk-old Otub2wt/wt, Otub2wt/fl, and Otub2fl/fl mice. (D and E) Representative images and tumor incidence in limiting dilution assays with control and OTUB2-overexpressing ES-2 cells (D) and with control and OTUB2-knockdown OVCA429 cells (E). (F and G) Statistical analyses of the percentage of EdU-positive cells in the indicated cells. The percentage of EdU-positive cells was calculated from the number of positive cells among the 20 total cells examined. Triplicate data were collected from three random fields of view of each group. The data are presented as the mean ± SD values; unpaired Student’s t test, *P < 0.05, **P < 0.01; n = 3. (H and I) Apoptosis rates of the indicated cells treated with CBP at the indicated concentrations for 24 h. The data are presented as the mean ± SD values; unpaired Student’s t test, *P < 0.05, **P < 0.01; n = 3. (J and K) Western blot analysis of apoptosis markers in the indicated cells. Cells were treated with CBP at the indicated concentrations for 24 h before analysis. (L and M) Representative images and weights of xenografts generated with the indicated cell lines. Box plot representation: from Top to Bottom—maximum, 75th percentile, median, 25th percentile, and minimum values; unpaired Student’s t test, **P < 0.01, ***P < 0.001; n = 7.
Fig. 3.
Fig. 3.
OTUB2 deubiquitinates and stabilizes SNX29P2. (A) Number of significantly differentially expressed proteins identified by proteomic analyses of the indicated groups. (BD) Western blot analysis of the indicated proteins in the CHX pulse–chase assay. (E) IF assay showing the predominant subcellular localization of Myc-OTUB2 and Myc-SNX29P2 in the nucleus. (FH) Western blot analysis of the indicated proteins in vivo (F and H) and in vitro (G) co-IP assays. (I) Representative images of the merged PLA signals and quantitative analysis of PLA puncta in the indicated cells. The scale bar represents 30 μm. The data are presented as the mean ± SEM. values; unpaired Student’s t test, ***P < 0.001; n = 3. (J) Western blot analysis of the indicated proteins in the in vitro deubiquitination assay.
Fig. 4.
Fig. 4.
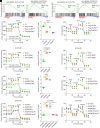
OTUB2/SNX29P2 suppresses glycolysis and increases OXPHOS in ovarian cancer. (A and B) Enriched pathways identified by GSEA based on RNA-seq data from ES-2 cells expressing EV, OTUB2, or SNX29P2. (C) Measurement of glycolytic capacity using a Seahorse assay in EV-, OTUB2-, or SNX29P2-expressing ES-2 cells. The data are presented as the mean ± SD values; n = 3. (D) Measurement of lactate production in EV-, OTUB2-, or SNX29P2-expressing ES-2 cells. Box plot representation: from Top to Bottom—maximum, 75th percentile, median, 25th percentile, and minimum values; unpaired Student’s t test, ***P < 0.001; n = 5. (E) Measurement of the OCR using a Seahorse assay in EV-, OTUB2-, or SNX29P2-expressing ES-2 cells. The data are presented as the mean ± SD values; n = 3. (F) Measurement of glycolytic capacity using a Seahorse assay in control and OTUB2-silenced OVCA429 cells. The data are presented as the mean ± SD values; n = 3. (G) Measurement of lactate production in control and OTUB2-silenced OVCA429 cells. Box plot representation: from Top to Bottom—maximum, 75th percentile, median, 25th percentile, and minimum values; unpaired Student’s t test, ***P < 0.001; n = 5. (H) Measurement of the OCR using a Seahorse assay in control and OTUB2-silenced OVCA429 cells. The data are presented as the mean ± SD values; n = 3. (I) Measurement of the glycolytic capacity using a Seahorse assay in control and SNX29P2-silenced ES-2 cells. The data are presented as the mean ± SD values; n = 3. (J) Measurement of lactate production in control and SNX29P2-silenced ES-2 cells. Box plot representation: from Top to Bottom—maximum, 75th percentile, median, 25th percentile, and minimum values; unpaired Student’s t test, ***P < 0.001; n = 5. (K) Measurement of the OCR using a Seahorse assay in control and SNX29P2-silenced ES-2 cells. The data are presented as the mean ± SD values; n = 3. (L) Measurement of the glycolytic capacity using a Seahorse assay in the indicated cells. The data are presented as the mean ± SD values; n = 3. (M) Measurement of lactate production in the indicated cells. Box plot representation: from Top to Bottom—maximum, 75th percentile, median, 25th percentile, and minimum values; unpaired Student’s t test, ***P < 0.001; n = 5. (N) Measurement of the OCR using a Seahorse assay in the indicated cells. The data are presented as the mean ± SD values; n = 3.
Fig. 5.
Fig. 5.
SNX29P2 promotes VHL-mediated HIF-1α degradation to inhibit CA9 transcription. (A) Volcano plots showing up-regulated and down-regulated mRNAs in OTUB2- and SNX29P2-overexpressing ES-2 cells compared to control cells. (B) Enriched pathways identified by GSEA based on RNA-seq data from ES-2 cells expressing EV, OTUB2, or SNX29P2. (C and D) Western blot analysis of HIF-1α and CA9 expression in the indicated cells under normoxic and hypoxic conditions. (E and F) Western blot (E) and quantitative analyses (F) of HIF-1α protein expression in the CHX pulse–chase assay. (G) Western blot analysis to assess HIF-1α ubiquitination in the indicated cells. (H) Western blot analysis of the indicated proteins in the co-IP assays to detect the interaction between HIF-1α and VHL. (I–L) Western blot analysis for the indicated proteins in the in vitro co-IP assays.
Fig. 6.
Fig. 6.
CA9 is a promising target in OTUB2-silenced ovarian cancer. (A and B) Growth curves and representative images (A) and weights (B) of xenograft tumors generated from the indicated cells. SLC-0111 was administered at a concentration of 40 mg/kg every 2 d. The data are presented as the mean ± SEM values in A. Box plot representation: from Top to Bottom—maximum, 75th percentile, median, 25th percentile, and minimum values in (B); unpaired Student’s t test, ***P < 0.001; n = 7. (C–F) Growth curves and representative images (C and E) and weights (D and F) of the xenograft tumors from ES-2 and A2780 cells. The data are presented as the mean ± SEM values in (C and E). Box plot representation: from Top to Bottom—maximum, 75th percentile, median, 25th percentile, and minimum values in (D and F); unpaired Student’s t test, ***P < 0.001; n = 7. (G and H) Representative images and quantitative analysis of metastatic nodules in the abdomens of mice injected with OTUB2-silenced cells (ES-2 and A2780) and OTUB2-expressing cells (OVCA429). Box plot representation: from Top to Bottom—maximum, 75th percentile, median, 25th percentile, and minimum values; unpaired Student’s t test, *P < 0.05, ***P < 0.001, ns: no significance; n = 7. (I and J) Prognostic analyses of ovarian cancer patients with low or high CA9 expression (stratified by the mean CA9 expression level in all samples). Kaplan–Meier survival plots are shown.

References

    1. Sung H., et al. , Global cancer statistics 2020: GLOBOCAN estimates of incidence and mortality worldwide for 36 cancers in 185 countries. CA Cancer J. Clin. 71, 209–249 (2021). - PubMed
    1. Menon U., et al. , Ovarian cancer population screening and mortality after long-term follow-up in the UK Collaborative Trial of Ovarian Cancer Screening (UKCTOCS): A randomised controlled trial. Lancet 397, 2182–2193 (2021). - PMC - PubMed
    1. Bowtell D. D., et al. , Rethinking ovarian cancer II: Reducing mortality from high-grade serous ovarian cancer. Nat. Rev. Cancer 15, 668–679 (2015). - PMC - PubMed
    1. Zhang S., et al. , Genetically defined, syngeneic organoid platform for developing combination therapies for ovarian cancer. Cancer Discov. 11, 362–383 (2021). - PMC - PubMed
    1. Hanahan D., Hallmarks of cancer: New dimensions. Cancer Discov. 12, 31–46 (2022). - PubMed

Publication types

MeSH terms

LinkOut - more resources