. 2024 May 3;10(18):eadn6537.
doi: 10.1126/sciadv.adn6537. Epub 2024 May 3.

Altered X-chromosome inactivation predisposes to autoimmunity

Affiliations

Altered X-chromosome inactivation predisposes to autoimmunity

Christophe Huret et al. Sci Adv. .

Abstract

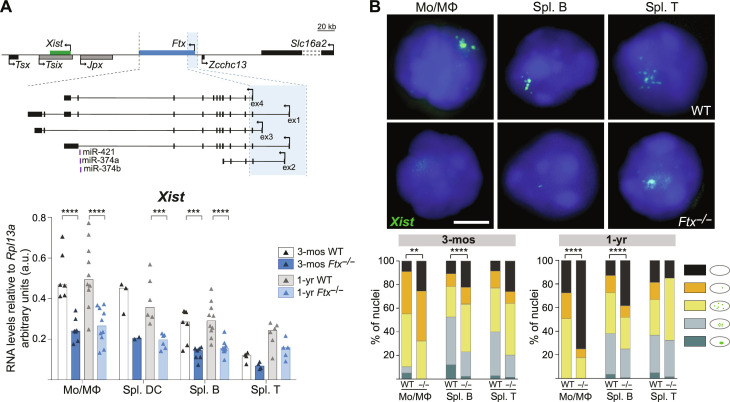
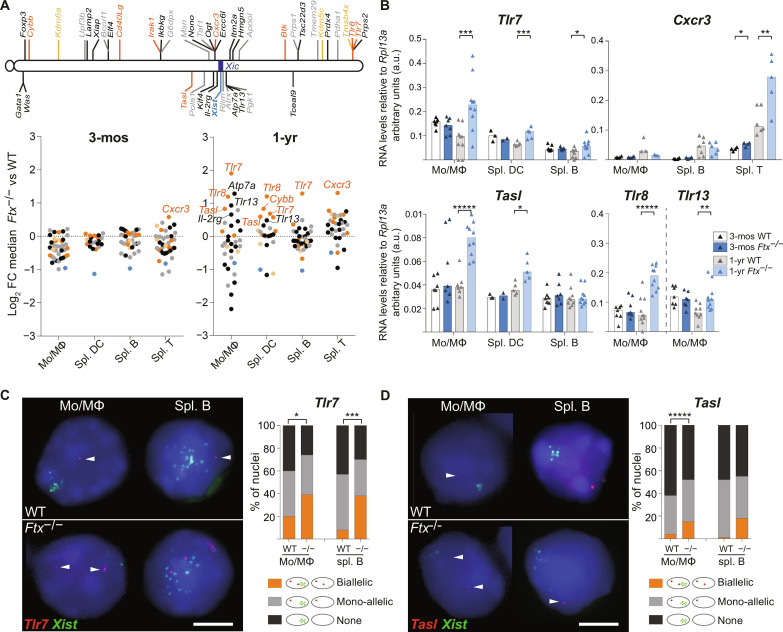
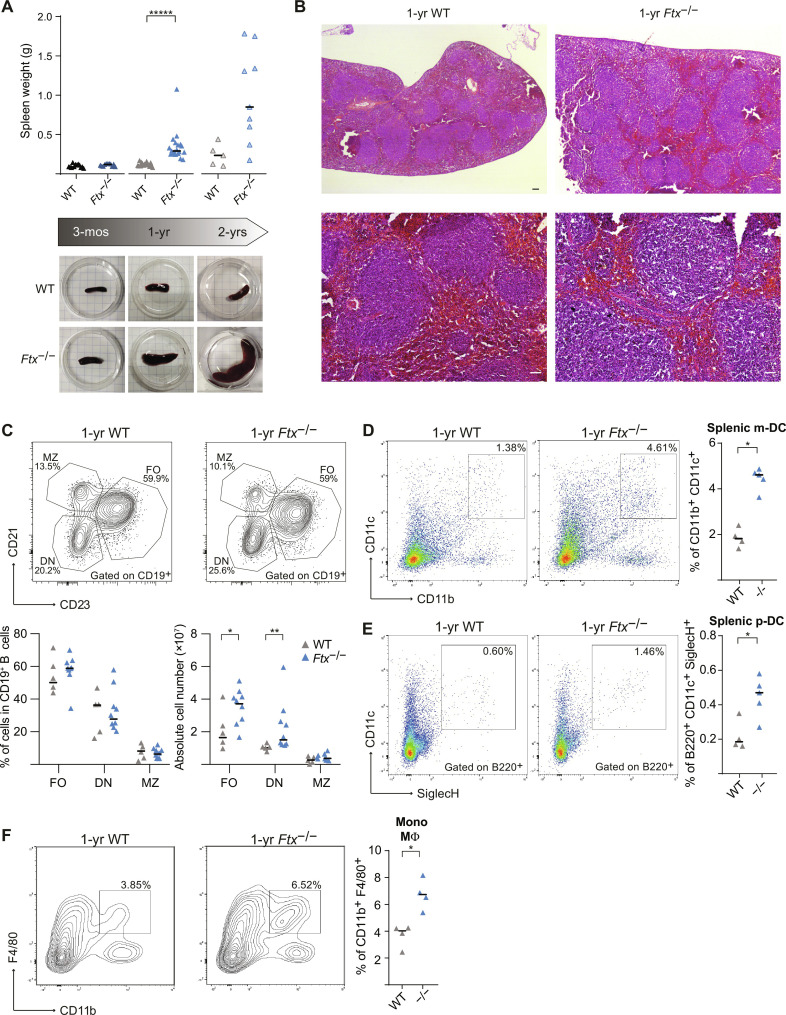
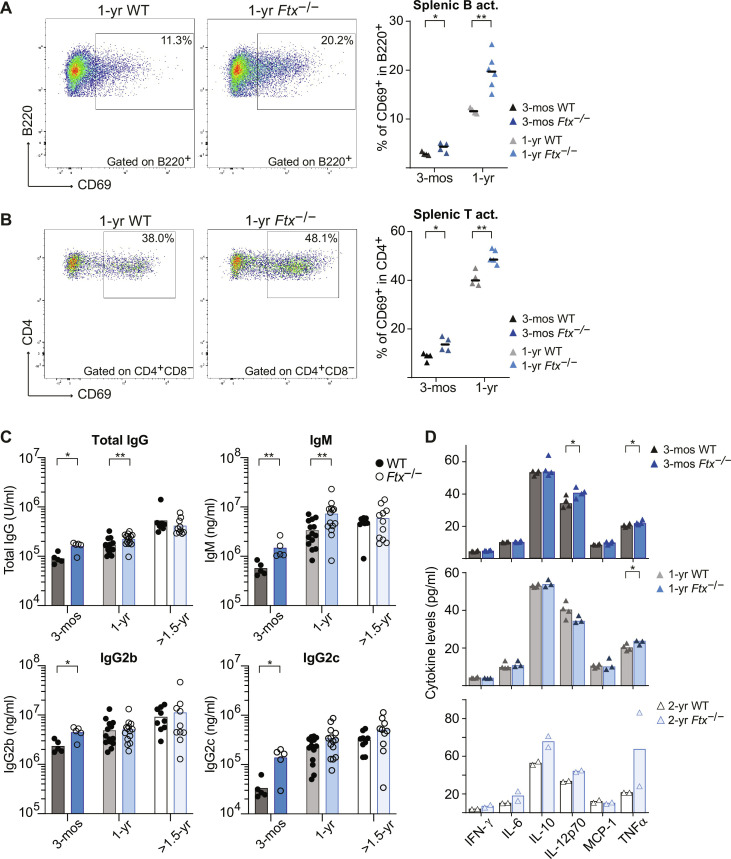
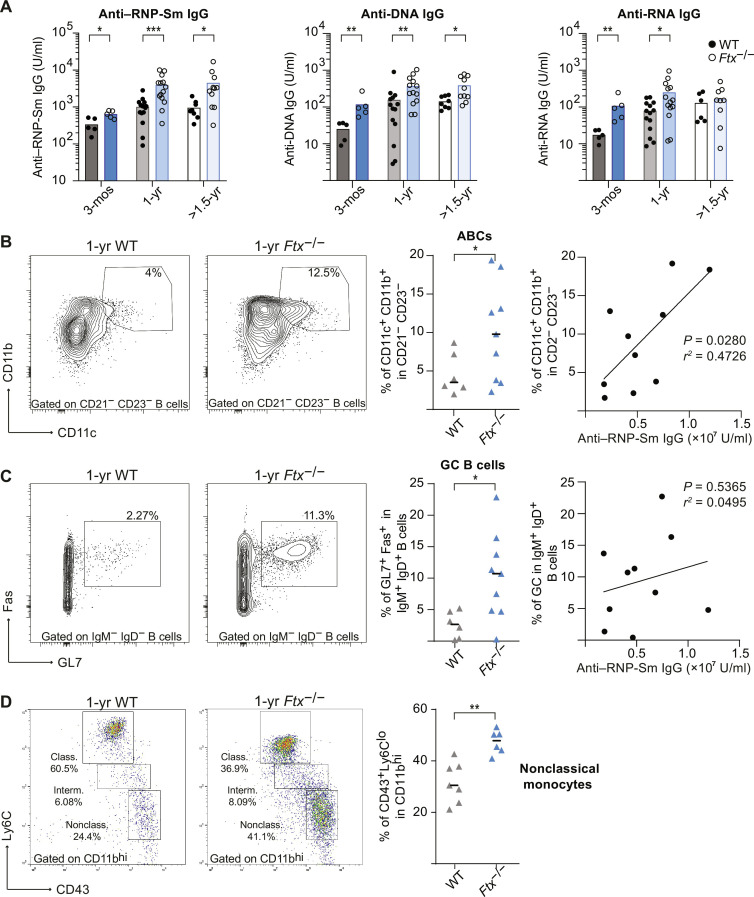
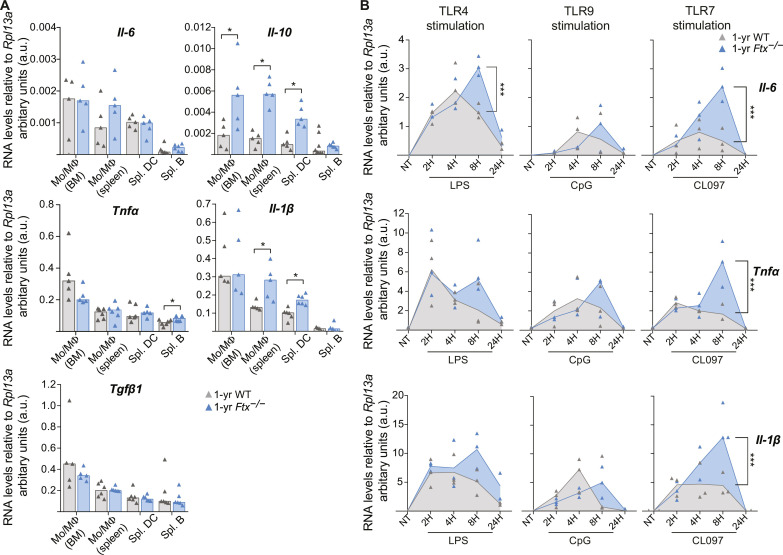
In mammals, males and females show marked differences in immune responses. Males are globally more sensitive to infectious diseases, while females are more susceptible to systemic autoimmunity. X-chromosome inactivation (XCI), the epigenetic mechanism ensuring the silencing of one X in females, may participate in these sex biases. We perturbed the expression of the trigger of XCI, the noncoding RNA Xist, in female mice. This resulted in reactivation of genes on the inactive X, including members of the Toll-like receptor 7 (TLR7) signaling pathway, in monocyte/macrophages and dendritic and B cells. Consequently, female mice spontaneously developed inflammatory signs typical of lupus, including anti-nucleic acid autoantibodies, increased frequencies of age-associated and germinal center B cells, and expansion of monocyte/macrophages and dendritic cells. Mechanistically, TLR7 signaling is dysregulated in macrophages, leading to sustained expression of target genes upon stimulation. These findings provide a direct link between maintenance of XCI and female-biased autoimmune manifestations and highlight altered XCI as a cause of autoimmunity.


Figures

Fig. 1.
Fig. 1.. Perturbation of X-inactivation in immune cells of Ftx−/− females.
(A) Map of the X inactivation center showing the location of Xist (green) and Ftx and the Ftx promoter region that has been deleted (blue shading). Other noncoding regulators of Xist are shown in gray. Underneath, Xist RNA levels measured by reverse transcription quantitative polymerase chain reaction (RT-qPCR) in wild-type (WT) and Ftx−/− females at 3 months (3-mos) and 1-year (1-yr) of age. Monocytes/macrophages (Mo/MΦ) were collected from the bone marrow (BM). Other cell types were collected from the spleen. Each triangle represents RNA levels in a mouse. Bar plots show median values (t test, ***P < 0.005 and ****P < 0.001). (B) Representative images of RNA fluorescence in situ hybridization (RNA-FISH) for Xist (green) on WT and Ftx−/− female cells of the indicated cell type. Note that Xist lncRNAs tend to be delocalized from the Xi even in WT mice as previously described (21). The percentages of cells with different patterns of Xist RNA distribution in the cell populations are shown on the histograms (chi-square test, **P < 0.01 and ****P < 0.001; N > 2 mice; n > 100 nuclei per mice). Scale bar, 5 μm.
Fig. 2.
Fig. 2.. Aberrant X-inactivation results in overexpression of several X-linked genes associated with autoimmune conditions.
(A) Map of the X chromosome showing genes known to constitutively escape from XCI (yellow), genes with immune function and a tendency to escape from XCI (orange), other genes with immune function (black), and housekeeping genes (gray). Underneath, log2 fold change (FC) between median RNA levels as measured by RT-qPCR in KO versus WT mice for each gene, in the indicated cell type, either in 3-month-old (left) or in 1-year-old mice (right). Each dot represents an X-linked gene. The names of genes showing significantly different RNA levels between KO versus WT are indicated on the graphs (t test, P < 0.05; n ≥ 3 mice per genotype). (B) RNA levels of Tlr7, Cxcr3, Tasl, Tlr8, and Tlr13 as measured by RT-qPCR in cell types showing detectable expression. Each triangle represents RNA levels in a mouse. Bar plots show median values (t test, *P < 0.05, **P < 0.01, ***P < 0.005, and *****P < 0.001). (C) Representative images of RNA-FISH for Tlr7 (red) and Xist (green) on WT and Ftx−/− cells from 1-year-old female mice. The percentages of cells with biallelic, mono-allelic, or no signals are shown on the histogram (chi-square test, *P < 0.05 and ***P < 0.005; N > 2 mice; n > 100 nuclei per mice). Scale bar, 5 μm. (D) Same as (C) for Tasl transcription (chi-square test, *****P < 0.001; N > 2 mice; n > 100 nuclei per mice).
Fig. 3.
Fig. 3.. Ftx−/− females develop a splenomegaly associated with a deregulation of B and myeloid cell populations.
(A) Spleen weight of WT and Ftx−/− females at 3 months, 1 year, and 2 years of age. Median values are shown (t test, *****P < 0.001). Underneath, representative images of WT and Ftx−/− spleens from 3-month-, 1-year-, and 2-year-old females. (B) Representative images of hematoxylin-eosin staining on sections of spleens from 1-year-old WT and Ftx−/− females. Scale bars, 100 μm. (C) Representative flow cytometry analysis of follicular (FO; CD21+CD23+), double-negative (DN; CD21CD23), and marginal zone (MZ; CD21+CD23) B cells among CD19+ B cells in spleen from 1- to 1.5-year-old WT and Ftx−/− females. Percentages and absolute number are shown on the graphs. Median values are shown (Mann-Whitney test, *P < 0.05 and **P < 0.01). (D) Representative flow cytometry analysis of splenic myeloid DCs (m-DC) in WT and Ftx−/− 1-year-old females. On the right, percentages of CD11b+CD11c+ splenic m-DC in leucocytes. Each triangle represents a mouse. Median values are shown (Mann-Whitney test, *P < 0.05). (E) Same as (D) for CD11c+B220+SiglecH+ splenic plasmacytoid DCs (p-DC) (Mann-Whitney test, *P < 0.05). (F) Same as (D) for CD11b+F4/80+ monocyte/macrophages (Mann-Whitney test, *P < 0.05).
Fig. 4.
Fig. 4.. Ftx deficiency in female mice promotes signs of inflammation.
(A) Representative flow cytometry analysis of spontaneously activated B220+CD69+ B cells in spleen from 1-year-old WT and Ftx−/− females. Percentages in leucocytes are shown on the graphs beneath. Each triangle represents a mouse. Median values are shown (Mann-Whitney test, *P < 0.05 and **P < 0.01). (B) Same as (A) for spontaneously activated CD4+CD69+ T cells (Mann-Whitney test, *P < 0.05 and **P < 0.01). (C) Total IgG, IgM, IgG2b, and IgG2c natural antibody levels in sera of 3-month-, 1-year, and >1.5-year-old WT or Ftx−/− females measured by ELISA. Each circle represents a mouse. Mean values are shown (Mann-Whitney test, *P < 0.05 and **P < 0.01). (D) Cytokines levels in the blood analyzed with cytometric bead array assays on sera from 3-month-, 1-year-, or 2-year-old WT and Ftx−/− females. Each triangle represents a mouse. Median values are shown (t test, *P < 0.05).
Fig. 5.
Fig. 5.. Ftx deficiency in female mice induces anti-NA and anti-RNP-Sm autoantibody production and the development of ABC-like cells.
(A) Anti–RNP-Sm IgG, anti-DNA IgG, and anti-RNA IgG autoantibody levels in sera of 3-month-, 1-year-, and >1.5-year-old WT or Ftx−/− females measured by ELISA. Each circle represents a mouse. Mean values are shown (Mann-Whitney test, *P < 0.05, **P < 0.01, and ***P < 0.005). (B) Representative flow cytometry analysis of ABC-like cells (CD11c+CD11b+) among DN (CD21CD23) in spleen from 1-year-old to 1.5-year-old WT and Ftx−/− females. Percentages are shown on the graphs. Each triangle represents a mouse. Median values are indicated. (Welch’s t test, *P < 0.05). The right panel shows the correlation between the frequency of ABCs (CD11c+CD11b+) relative to anti–RNP-Sm IgG levels in each Ftx−/− female (Pearson correlation). (C) Representative flow cytometry analysis of GC cells (Fas+GL7+) among switch memory B cells (IgMIgD) in spleen from 1-year-old to 1.5-year-old WT and Ftx−/− females. Percentages are shown on the graphs. Each triangle represents a mouse. Median values are indicated (Welch’s t test, *P < 0.05). The right panel shows the correlation between the frequency of GC cells (Fas+GL7+) and anti–RNP-Sm IgG Ab levels in each Ftx−/− females (Pearson correlation). (D) Representative flow cytometry analysis of monocyte populations including nonclassical (CD11bhiCD43+Ly6Clo) scavenger monocytes in the blood of 1-year-old WT and Ftx−/− females. Percentages in leucocytes are shown on the graphs beneath. Each triangle represents a mouse. Median values are shown (Mann-Whitney test, **P < 0.01).
Fig. 6.
Fig. 6.. Hyperactive TLR7 pathway in Ftx−/− female macrophages.
(A) Analysis of cytokine RNA levels by RT-qPCR in the indicated cell population collected from WT or Ftx−/− 1-year-old females. Each triangle represents a mouse. Bar plots show median values (t test, *P < 0.05). (B) RT-qPCR analysis of cytokine RNA levels in BM-derived macrophages (granulocyte-macrophage colony-stimulating factor differentiation of total BM cells) activated with either lipopolysaccharide (LPS; TLR4 pathway), CpG (TLR9 pathway), or the TLR7 agonist CL097. Cells were either not treated (NT) or treated for 2, 4, 8, or 24 hours (2H, 4H, 8H, and 24H, respectively). Each triangle represents a mouse. Median values are shown [analysis of variance (ANOVA), ***P < 0.001].

References

    1. Schurz H., Salie M., Tromp G., Hoal E. G., Kinnear C. J., Möller M., The X chromosome and sex-specific effects in infectious disease susceptibility. Hum. Genomics 13, 2 (2019). - PMC - PubMed
    1. Sauteraud R., Stahl J. M., James J., Englebright M., Chen F., Zhan X., Carrel L., Liu D. J., Inferring genes that escape X-Chromosome inactivation reveals important contribution of variable escape genes to sex-biased diseases. Genome Res. 31, 1629–1637 (2021). - PMC - PubMed
    1. Sierra I., Anguera M. C., Enjoy the silence: X-chromosome inactivation diversity in somatic cells. Curr. Opin. Genet. Dev. 55, 26–31 (2019). - PMC - PubMed
    1. Credendino S. C., Neumayer C., Cantone I., Genetics and epigenetics of sex bias: Insights from human cancer and autoimmunity. Trends Genet. 36, 650–663 (2020). - PubMed
    1. Yuen G. J., Autoimmunity in women: An eXamination of eXisting models. Clin. Immunol. 210, 108270 (2020). - PMC - PubMed

Publication types

MeSH terms