. 2024 Jul 2;12(7):854-875.
doi: 10.1158/2326-6066.CIR-23-1105.

Metabolic Reprogramming of Tumor-Associated Macrophages Using Glutamine Antagonist JHU083 Drives Tumor Immunity in Myeloid-Rich Prostate and Bladder Cancers

Affiliations

Metabolic Reprogramming of Tumor-Associated Macrophages Using Glutamine Antagonist JHU083 Drives Tumor Immunity in Myeloid-Rich Prostate and Bladder Cancers

Monali Praharaj et al. Cancer Immunol Res. .

Abstract

Glutamine metabolism in tumor microenvironments critically regulates antitumor immunity. Using the glutamine-antagonist prodrug JHU083, we report potent tumor growth inhibition in urologic tumors by JHU083-reprogrammed tumor-associated macrophages (TAMs) and tumor-infiltrating monocytes. We show JHU083-mediated glutamine antagonism in tumor microenvironments induced by TNF, proinflammatory, and mTORC1 signaling in intratumoral TAM clusters. JHU083-reprogrammed TAMs also exhibited increased tumor cell phagocytosis and diminished proangiogenic capacities. In vivo inhibition of TAM glutamine consumption resulted in increased glycolysis, a broken tricarboxylic acid (TCA) cycle, and purine metabolism disruption. Although the antitumor effect of glutamine antagonism on tumor-infiltrating T cells was moderate, JHU083 promoted a stem cell-like phenotype in CD8+ T cells and decreased the abundance of regulatory T cells. Finally, JHU083 caused a global shutdown in glutamine-utilizing metabolic pathways in tumor cells, leading to reduced HIF-1α, c-MYC phosphorylation, and induction of tumor cell apoptosis, all key antitumor features. Altogether, our findings demonstrate that targeting glutamine with JHU083 led to suppressed tumor growth as well as reprogramming of immunosuppressive TAMs within prostate and bladder tumors that promoted antitumor immune responses. JHU083 can offer an effective therapeutic benefit for tumor types that are enriched in immunosuppressive TAMs.


Conflict of interest statement

S. Yegnasubramanian reports grants from the NIH during the conduct of the study, as well as grants and personal fees from Cepheid, other support from Digital Harmonic and Brahm Astra Therapeutics, and grants from Bristol Meyers Squibb and Janssen outside the submitted work. R.D. Leone reports grants from the NIH during the conduct of the study; personal fees from Mitobridge and Abilita outside the submitted work; and a patent for methods for cancer and immunotherapy using prodrugs of glutamine analogs. Patent # 10842763 was issued, licensed, and with royalties paid from Dracen Pharmaceuticals, Inc. R. Rais reports patents for US10954257B2 and US20230009398A1 issued and licensed to Dracen Pharmaceuticals, Inc. R. Rais is an inventor on multiple Johns Hopkins University (JHU) patents covering novel glutamine antagonist prodrugs. These patents have been licensed to Dracen Pharmaceuticals, Inc. R. Rais is also a cofounder of and holds equity in Dracen Pharmaceuticals, Inc., and served as a scientific consultant to Dracen Pharmaceuticals, Inc. This arrangement has been reviewed and approved by the JHU in accordance with its conflict-of-interest policies. R. Rais declares no other conflict. B.S. Slusher reports grants and personal fees from Dracen Pharmaceuticals, Inc. outside the submitted work and patents for US 16/754053, US 16/262476, and US 16/454880 issued and licensed to Dracen Pharmaceuticals, Inc. B.S. Slusher is an inventor on multiple JHU patents covering novel glutamine antagonist prodrugs and their utility. These patents have been licensed to Dracen Pharmaceuticals, Inc. B.S. Slusher is also a cofounder of and holds equity in Dracen Pharmaceuticals, Inc. and also served as a scientific consultant to Dracen Pharmaceuticals, Inc. This arrangement has been reviewed and approved by the JHU in accordance with its conflict-of-interest policies. D.M. Pardoll reports other support from Dracen Pharmaceuticals, Inc. during the conduct of the study and a patent licensed to Dracen Pharmaceuticals, Inc. J.D. Powell reports other support from Dracen Pharmaceuticals, Inc. during the conduct of the study; other support from Calico outside the submitted work; and a patent for DRP104 issued and licensed. J.C. Zarif reports grants from the NIH/NCI, the Prostate Cancer Foundation Young Investigator Award, the Maryland Cigarette Restitution Fund, and the Bloomberg∼Kimmel Institute for Cancer Immunotherapy during the conduct of the study. No disclosures were reported by the other authors.

Figures

Figure 1.
Figure 1.
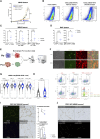
The antitumor activity of the glutamine antagonist JHU083 against urologic tumors is myeloid dependent. A, Dot plots showing expression levels and fractional abundance of myeloid cells expressing glutamine metabolism enzymes, GLUL, and GLS across samples (tumor, involved, distal, and benign). B, Violin plots showing the expression levels and fractional abundance of different cell types expressing GLUL and GLS. Data for A and B were generated using the previously published and publicly available scRNA-seq integrated dataset from nine metastatic prostate cancer and seven benign BM control patient samples by Kfoury and colleagues (41). C, Schematic diagrams showing the heterotopic syngeneic urologic tumor (B6CaP and MB49) models and therapeutic JHU083 treatment strategy. D and E, Tumor volume and tumor weight measurements (post-necropsy) in the B6CaP (n = 8/group) and MB49 (n = 9 or 10/group) tumors. F and G, Effects of CD8+ T cell depletion on tumor volume and animal survival for (F) MB49 (n = 4–5/group) and (G) B6CaP (n = 4–6/group) tumors, respectively. H and I, Effect of CD4+ T cell depletion on tumor volume of (H) MB49 (n = 4–5/group) and (I) B6CaP (n = 3–5/group) tumors and animal survival. Antitumor activity of JHU083-reprogrammed and adoptively transferred (J) TAMs (CD45+ Ly6G CD3 CD11b+ F4.80+; n = 5 or 10/group) and (K) TIMs (CD45+ Ly6G CD3 Ly6C (hi); n = 4 or 7/group) on MB49 tumor volume (L). Briefly, live, FACS-sorted TAMs or TIMs were mixed in a 1:1 ratio with cultured MB49 cells and were subsequently implanted on flanks to generate tumors in recipient mice. Data are represented as mean values ± SEM. All experiments were independently validated, at least in two separate biological replicates. Statistical analyses were performed using either t test or a two-way ANOVA using Bonferroni’s multiple comparisons (*, P < 0.05; **, P < 0.01; ***, P < 0.001; ****, P < 0.0001). Log-rank (Mantel–Cox) tests were performed for survival analysis (F, JHU083 relative to control, P = 0.0412; α-CD8b relative to α-CD8b + JHU083, P = 0.0342; α-CD8b + JHU083 vs. JHU083, P = ns. I, JHU083 vs. control, P = 0.01; α-CD4 vs. α-CD4 + JHU083, P = 0.0801; α-CD4 + JHU083 vs. JHU083, P = ns).
Figure 2.
Figure 2.
JHU083-mediated glutamine antagonism reprograms TME, differentially induces TAMs, TIMs, inflammatory TNF signaling and proliferation in TAMs/TIMs. A, UMAP and stacked bar plots showing the diversity and differential abundance of TAMs and monocyte (TIM) clusters in B6CaP tumors at an early point (day 7 posttreatment) using scRNA-seq (n = 6) across samples. UMAP, uniform manifold approximation and projection for dimension reduction. B, Density plots of different TAM and TIM clusters in control and JHU083-treated B6CaP tumors (identified in A). C, DEG scores were calculated for each TAM cluster based on the GSEA of significant DEGs from bulk RNA-seq of JHU083-treated vs. control TAMs (day 14 posttreatment, late time point; n = 6/group). D, UMAP plot based on the DEG scores identified using bulk RNA-seq of B6CaP-TAMs from C. UMAP, uniform manifold approximation and projection for dimension reduction. E, GSEA between JHU083-treated vs. control cells from the proliferative TAMs and TAM2. F, GSEA between bulk RNA-sequenced JHU083-treated TAMs and control TAMs sorted from B6CaP tumors (day 18 posttreatment; n = 6/group). G, Volcano plot of top DEGs from the TAM2 cluster between JHU083-treated vs. control. H, Volcano plot of top DEGs between JHU083-treated vs. control samples from bulk RNA-seq data. I, Intracellular quantification of the percentage (%) TNF+ population in TAMs and TIMs in B6CaP tumors. J, Intracellular expression of percentage (%) Ki-67+ TAMs in JHU083-treated TAMs vs. control B6CaP tumors, and (K) clusters identified from A overlaid using RNA velocity analysis. The root cells are the undifferentiated cells, and the developmental endpoints are the differentiated cells connected via arrows pointing to the likely developmental paths. Briefly, DEGs were calculated with DESeq2 in the bulk RNA-seq data, and with the Wilcoxon rank-sum test for the scRNA-seq data. The data are presented as mean values ± SEM. Statistical analyses were performed using either t test or a two-way ANOVA using Bonferroni’s multiple comparisons (*, P < 0.05; **, P < 0.01; ***, P < 0.001; ****, P < 0.0001).
Figure 3.
Figure 3.
JHU083-induced glutamine antagonism promotes phagocytosis of tumor cells by TAMs and decreases angiogenesis in the TME. A, Tumor volume measurement of MB49 tumors in different treatment conditions. JHU083 treatment decreases tumor growth in MB49-RFP+ tumors relative to nontreated (n = 5 or 6/group) tumors. B, Representative flow cytometry plots of RFP+ MB49 tumor cells in TAMs in JHU083-treated vs. vehicle-treated tumors. C, Percentage of RFP+ cells within overall TAMs, CD206+ TAMs (M2-TAMs), and CD86+ MHCII+ TAMs (M1-TAMs) in MB49 tumors in control vs. JHU083-treated tumors. D, Percentage of RM1-RFP+ cells and corresponding mean fluorescence intensity (gMFI) of TAMs (n = 4/group) in control vs. JHU083-treated tumors. E, Schematic diagram showing the determination of the phagocytic activity of TAMs. Briefly, DON-treated, PBMC-derived macrophages were cocultured with CFSE-labeled PC3 cells, and phagocytic activity was determined using flow cytometry. F, Representative photomicrographs showing increased phagocytosis in DON-treated and PKH26-labeled macrophages (PKH26 MAC) cocultured with CFSE-labeled PC3 (CFSE PC3) by immunofluorescence microscopy and quantification using flow cytometry. G, Violin plots of phagocytosis UCell scores on TAM_1, TAM_2, Inflam_TAM, and Prolif_TAM (Wilcoxon rank-sum test) identified in scRNA-seq analysis of CD45+ cells from B6CaP tumors. H, Violin plot for Myo1e expression in all TAMs in B6CaP-derived TAMs identified in scRNA-seq analysis of CD45+ cells from B6CaP tumors. I, IHC-based quantification of CD31+ area intensity in B6CaP tumors (n = 3/group), and (J) IHC quantification of CD31 intensity in MB49 tumors. Statistical analyses were performed using t test or two-way ANOVA using Bonferroni’s multiple comparisons. Violin plots from scRNA-seq studies are analyzed using the Wilcoxon rank-sum test. (*, P < 0.05; **, P < 0.01; ***, P < 0.001; ****, P < 0.0001).
Figure 4.
Figure 4.
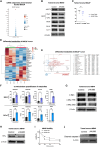
JHU083-induced glutamine antagonism caused a divergent metabolic response affecting glycolysis, purine metabolism, and succinate in TAMs. A and B, Surface and intracellular expression of GLUT1 and HKII (percentage positive population and mean fluorescence intensity) on B6CaP-derived TAMs. C, GSEA showing the enrichment of the Hallmark glycolysis gene set among DEGs in bulk RNA-sequenced FACS-sorted B6CaP-derived TAMs following JHU083 treatment relative to control. D, Heat map showing the differential metabolites in TAMs sorted from JHU083-treated and control B6CaP tumors (n = 3/group). E, Volcano plot showing log2 fold change vs. –log10 (FDR-corrected P value), representing fold changes in metabolite abundance in one-carbon metabolism, purine nucleotide metabolism, and hexosamine pathway in JHU083-treated vs. control TAMs. F, Normalized relative labeled metabolites from U-13C glucose in the TCA cycle in TAMs derived from B6CaP tumors (n = 9/group in two independent experiments). G, Normalized relative metabolite abundances in the TCA cycle in TAMs derived from B6CaP tumors (n = 9/group from two independent experiments) and (H) log fold-change of TCA cycle enzymes and inflammatory cytokine transcripts in TAMs (from scRNA-seq at an early time point (day 7 posttreatment). DEGs for GSEA in C were calculated with DESeq2, and statistics on genes of interest in H were calculated with the Wilcoxon rank-sum test. All other statistical analyses were performed using the unpaired t test (*, P < 0.05; **, P < 0.01; ***, P < 0.001; ****, P < 0.0001).
Figure 5.
Figure 5.
JHU083-induced glutamine antagonism affects tumor cell metabolism and induces cell death in urologic tumors. A, Log-fold changes of glutamine utilizing enzymes after JHU083 treatment vs. control tumors in CD45 sorted cells from B6CaP tumors, followed by scRNA-seq. B, Western blot showing qualitative changes in the levels of glutamine synthesizing/utilizing enzymes and transporters in the CD45 fraction of MB49 tumors. C, Percentage of GLUT1+ CD45 live cells determined by flow cytometry in B6CaP tumors (n = 7/group). D, Targeted metabolomic analysis of B6CaP tumors by LC-MS/MS (n = 3/group). E, Volcano plot showing key metabolite levels of JHU083-treated vs. nontreated control tumors based on the metabolomic analysis shown in D. F, Absolute quantification of metabolites by LC/MS-MS (n = 3 or 5/group). G and H, Western blot images showing qualitative changes in c-MYC, phospho-c-MYC, and HIF-1ɑ in MB49 tumors following JHU083 treatment, and (H and I) MTT assay in DON-treated MB49 cells and immunoblot of cleaved caspase 3 quantification in CD45 fraction MB49 tumors (J). Statistical analyses were performed using the unpaired t test. (*, P < 0.05; **, P < 0.01; ***, P < 0.001; ****, P < 0.0001).
Figure 6.
Figure 6.
JHU083-induced glutamine antagonism causes extensive reprogramming of TILs. A, UMAP plot showing lymphocytic cell subsets identified from scRNA-seq analysis of CD45+ cells isolated from B6CaP tumors (JHU083-treated vs. control). B, UMAP density plots showing all NK and T cells. C, Dot plots of normalized expression of selected marker genes in T and NK cell subsets identified in A. D, Changes in proportions of NK cell subsets, stem cell–like CD8+ T cells, and CD4 Tregs from scRNA-seq (n = 3/group). E, Surface and intracellular expression of stem-like CD8+ T cells and Foxp3+ percentage population in B6CaP and MB49 tumors (n = 7/8 per group). F, Schematic workflow of T cell coculture with DON-pretreated human primary macrophages. G, CD8+ T cell proliferation measurement using autologous CD8+ T cells isolated from human PBMCs and cocultured with monocyte-derived macrophages pretreated with DON either during differentiation (days 0–9) or during polarization (days 5–9) phase. H, gMFI of TNF and IFNγ in cocultured autologous CD8+ T cells with DON pretreated monocyte-derived macrophages, and (I) Tumor volume measurement of MB49 and B6CaP tumors during the therapeutic window. Briefly, following the development of palpable tumors, tumor-bearing C57BL/6J mice were injected every third day with anti-PD1 alone or in combination with daily oral gavage of JHU083. The data are presented as mean values ± SEM. Statistical analyses were performed using either t test or a two-way ANOVA using Bonferroni’s multiple comparisons (*, P < 0.05; **, P < 0.01; ***, P < 0.001; ****, P < 0.0001). UMAP, uniform manifold approximation and projection for dimension reduction.

References

    1. Mantovani A, Sozzani S, Locati M, Allavena P, Sica A. Macrophage polarization: tumor-associated macrophages as a paradigm for polarized M2 mononuclear phagocytes. Trends Immunol 2002;23:549–55. - PubMed
    1. Vitale I, Manic G, Coussens LM, Kroemer G, Galluzzi L. Macrophages and metabolism in the tumor microenvironment. Cell Metab 2019;30:36–50. - PubMed
    1. Mantovani A, Allavena P, Marchesi F, Garlanda C. Macrophages as tools and targets in cancer therapy. Nat Rev Drug Discov 2022;21:799–820. - PMC - PubMed
    1. El-Kenawi A, Dominguez-Viqueira W, Liu M, Awasthi S, Abraham-Miranda J, Keske A, et al. . Macrophage-derived cholesterol contributes to therapeutic resistance in prostate cancer. Cancer Res 2021;81:5477–90. - PMC - PubMed
    1. Cassetta L, Pollard JW. Targeting macrophages: therapeutic approaches in cancer. Nat Rev Drug Discov 2018;17:887–904. - PubMed

MeSH terms