. 2024 Aug 15;144(7):757-770.
doi: 10.1182/blood.2024023849.

ABBV-319: a CD19-targeting glucocorticoid receptor modulator antibody-drug conjugate therapy for B-cell malignancies

Affiliations

ABBV-319: a CD19-targeting glucocorticoid receptor modulator antibody-drug conjugate therapy for B-cell malignancies

Chewei Anderson Chang et al. Blood. .

Abstract

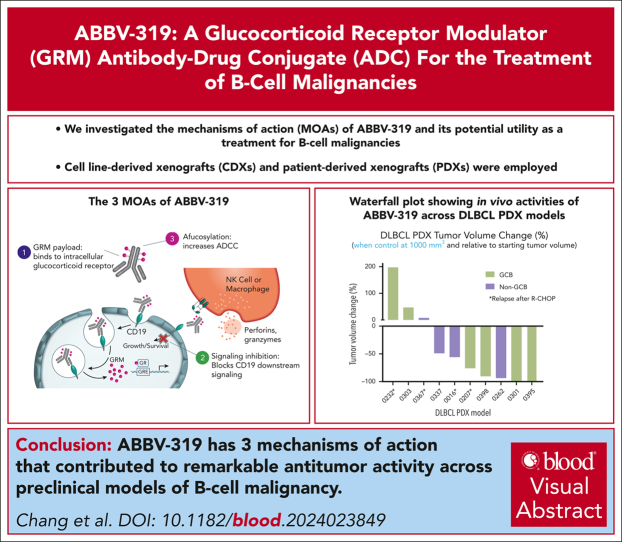
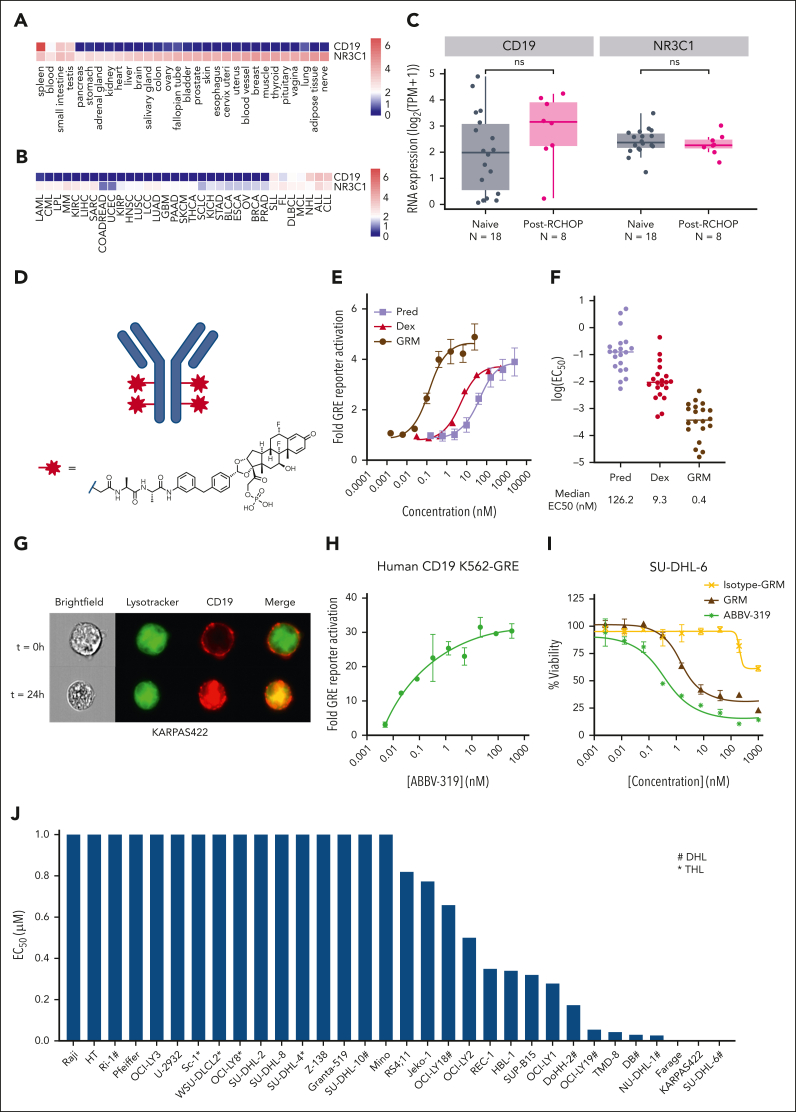
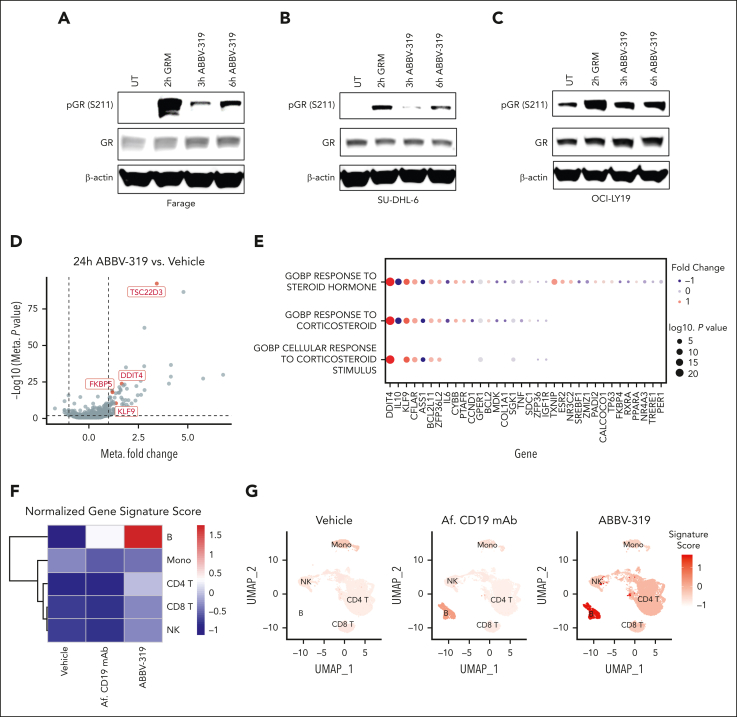
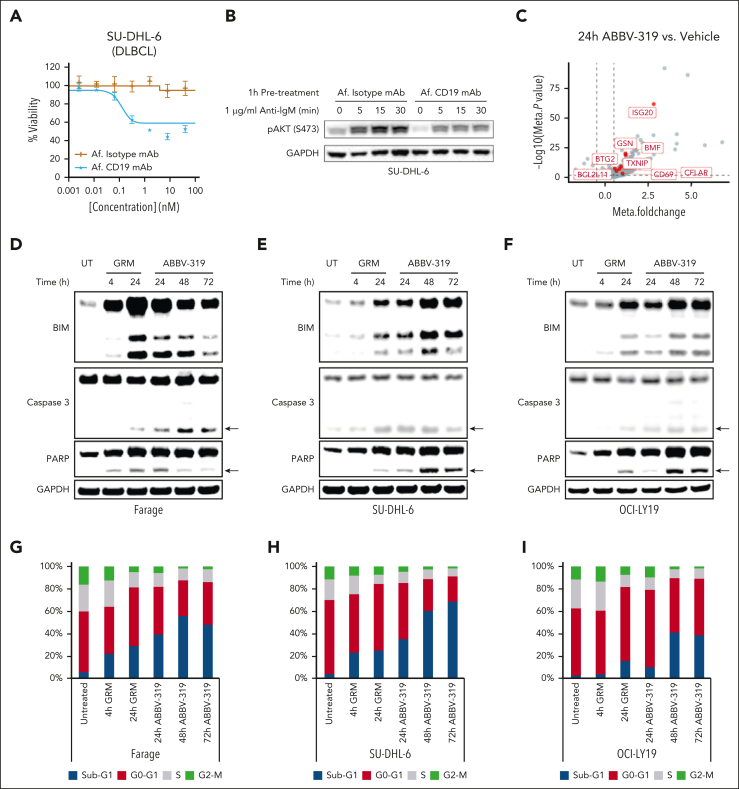
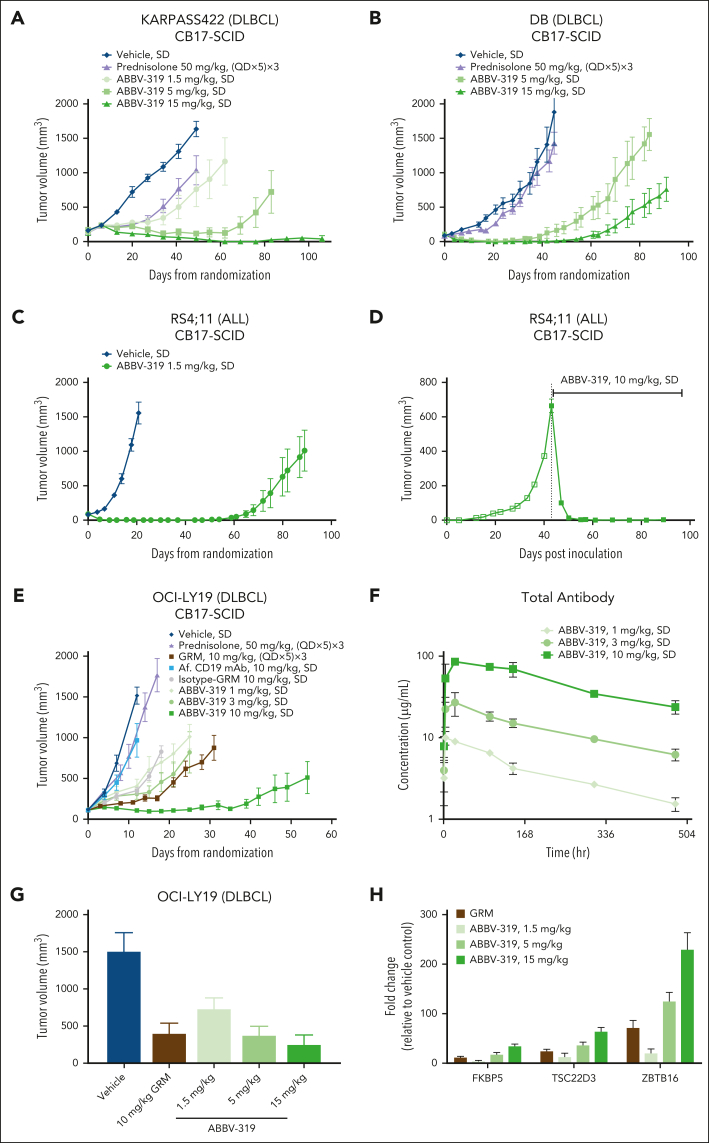
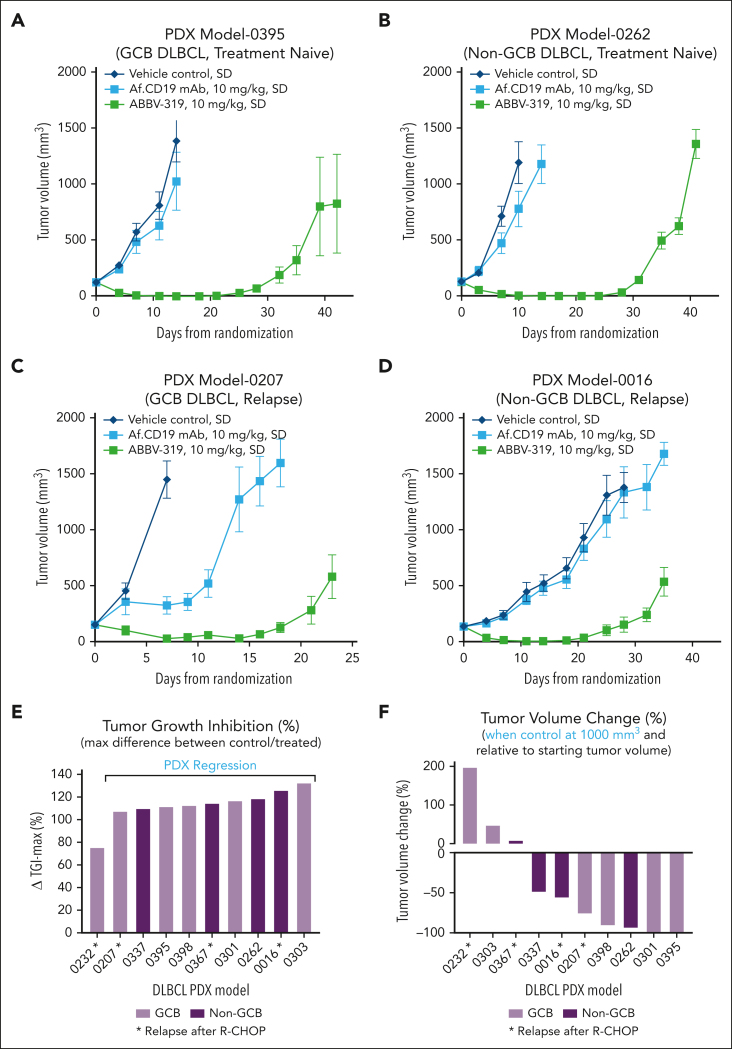
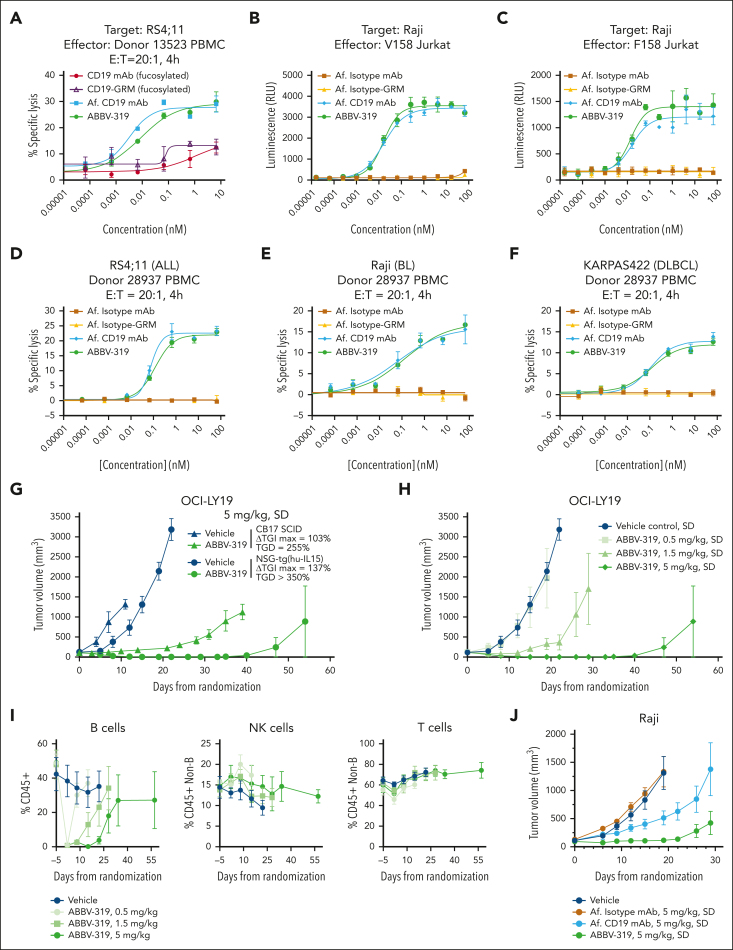
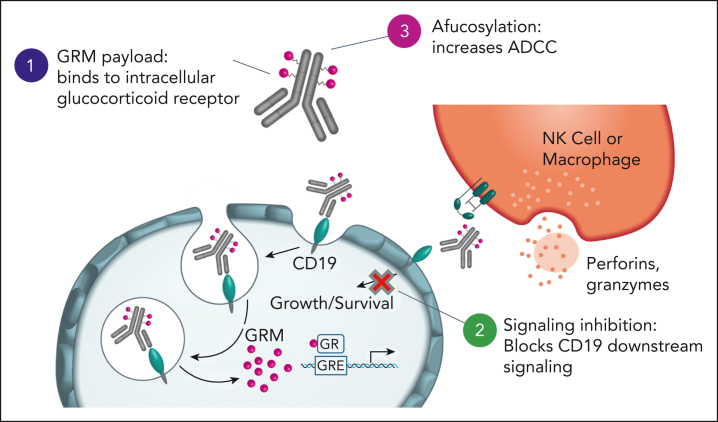
Glucocorticoids are key components of the standard-of-care treatment regimens for B-cell malignancy. However, systemic glucocorticoid treatment is associated with several adverse events. ABBV-319 is a CD19-targeting antibody-drug conjugate engineered to reduce glucocorticoid-associated toxicities while possessing 3 distinct mechanisms of action (MOA) to increase therapeutic efficacy: (1) antibody-mediated delivery of a glucocorticoid receptor modulator (GRM) payload to activate apoptosis, (2) inhibition of CD19 signaling, and (3) enhanced fragment crystallizable (Fc)-mediated effector function via afucosylation of the antibody backbone. ABBV-319 elicited potent GRM-driven antitumor activity against multiple malignant B-cell lines in vitro, as well as in cell line-derived xenografts and patient-derived xenografts (PDXs) in vivo. Remarkably, a single dose of ABBV-319 induced sustained tumor regression and enhanced antitumor activity compared with repeated dosing of systemic prednisolone at the maximum tolerated dose in mice. The unconjugated CD19 monoclonal antibody (mAb) also displayed antiproliferative activity in a subset of B-cell lymphoma cell lines through the inhibition of phosphoinositide 3-kinase signaling. Moreover, afucosylation of CD19 mAb enhanced Fc-mediated antibody-dependent cellular cytotoxicity. Notably, ABBV-319 displayed superior efficacy compared with afucosylated CD19 mAb in human CD34+ peripheral blood mononuclear cell-engrafted NSG-Tg(Hu-IL15) transgenic mice, demonstrating enhanced antitumor activity when multiple MOAs are enabled. ABBV-319 also showed durable antitumor activity across multiple B-cell lymphoma PDX models, including nongerminal center B-cell diffuse large B-cell lymphoma and relapsed lymphoma after R-CHOP treatment. Collectively, these data support the ongoing evaluation of ABBV-319 in a phase 1 clinical trial.


Conflict of interest statement

Conflict-of-interest disclosure: C.A.C., E.E., A.L.D., W.Z., C.C., K.P., D.M., E.P., A.O., P.E., L.R., R.D., C.H., L.L., W.A., P.Z., W.L., A.H.J., K.M., Z.Z., G.R., Z.C., Y.L., J.C., G.Z., T.C., M.B., C.C.M., A.H., M. McPherson, T.U., M.A.P., X.Z., J.H., M. McDevitt, K.J.F., S.M.-L., and J.W.P. are employees of AbbVie. O.P. and A.B. were employees of AbbVie at the time of the study. The design, study conduct, and financial support for this research were provided by AbbVie. AbbVie participated in the interpretation of the data, review, and approval of the manuscript.

Figures

None
Graphical abstract
Figure 1.
Figure 1.
Characterization of ABBV-319. (A) Analysis of CD19 and NR3C1 gene expression in normal tissues using GTEx data sets. (B) Analysis of CD19 and NR3C1 gene expression across different cancer indications using Aster ORIEN data sets. (C) Analysis of CD19 and NR3C1 gene expression in patients that are treatment naïve or post–R-CHOP treatment using Aster ORIEN data sets. Statistical analysis with Wilcoxon test. ns, not significant. (D) Structure of the GRM linker drug. (E) Fold change in GRE activity compared with the untreated control after treatment of K562 GRE reporter cells with prednisolone, dexamethasone, and GRM payload for 24 hours. Mean ± standard error of the mean (SEM) are depicted. (F) Summary of EC50 for prednisolone, dexamethasone, and GRM payload across 20 glucocorticoid-sensitive cell lines. Each dot represents the log(EC50) of a cell line and the median log(EC50) is displayed. (G) Imaging analysis of CD19 localization after treatment of KARPAS422 with an Alexa Fluor 647-labeled ABBV-319 for the indicated time. Brightfield, LysoTracker (green), CD19 (red), and merged images are displayed. (H) The fold change in GRE activity relative to the untreated control after treating K562-GRE reporter cells with ABBV-319 for 24 hours. (I) Percentage viability of SU-DHL-6 cells relative to the untreated control after treatment with GRM payload, isotype-GRM ADC, and ABBV-319 for 5 days. (J) EC50 of ABBV-319 across a panel of malignant B-cell lines with a range of Emax from supplemental Table 2. # denotes double-hit lymphoma (DHL) and ∗ denotes triple-hit lymphoma (THL) based on published annotations.
Figure 2.
Figure 2.
ABBV-319 engages and activates GR in DLBCL cell lines. (A-C) Immunoblot analysis of GR phosphorylation on serine 211 (S211) and GR expression after treatment with 10 nM GRM and 100 nM ABBV-319 for indicated time in Farage (A), SU-DHL-6 (B), and OCI-LY19 (C). β-actin was used as the loading control. (D) Volcano plot showing the fold change and P value from the meta-analysis of differentially expressed genes (DEGs) between 24-hour ABBV-319 treatment and vehicle control in GRM-sensitive cell lines. Each dot represents a DEG and the selected known GR targets are highlighted in red. (E) Pathways and genes enriched in the meta-analysis of DEGs between the ABBV-319 and vehicle treatment. The color represents the directionality of the fold change, and the size of the circle represents the log(P value). (F) Heat map showing the expression of the 8-gene glucocorticoid gene signature in different immune subsets in PMBC after 24 hours of indicated treatment. (G) Uniform manifold approximation and projection (UMAP) of immune cells within PBMC after the indicated treatment for 24 hours. Color indicates the expression of the 8-gene glucocorticoid gene signature.
Figure 3.
Figure 3.
ABBV-319 inhibits prosurvival signaling and induces apoptotic cell death in DLBCL. (A) The percentage viability relative to the untreated control after treatment of SU-DHL-6 cells with Af. isotype mAb and Af. CD19 mAb. Mean ± SEM is displayed. (B) SU-DHL-6 cells were pretreated with 100 nM Af. Isotype mAb or Af. CD19 mAb for an hour and then stimulated with 1 μg/ml anti-immunoglobulin M (anti-IgM) for the indicated time. Cell lysates were resolved on sodium dodecyl sulfate–polyacrylamide gel electrophoresis and immunoblot analysis for phospho-AKT (Ser473) and glyceraldehyde 3-phosphate dehydrogenase (GAPDH) are displayed. GAPDH is used as a loading control. (C) Volcano plot showing the fold change and P value from the meta-analysis of DEGs between 24-hour ABBV-319 treatment and vehicle control in ABBV-319-sensitive cell lines. Each dot represents a DEG and the genes involved in apoptosis are highlighted in red. (D-F) Immunoblot analysis of BIM, caspase 3, PARP, and GAPDH after treating Farage (D), SU-DHL-6 (E), and OCI-LY19 (F) with 10 nM GRM payload and 100 nM ABBV-319 for the indicated time. Arrows show the cleaved product of caspase 3 and PARP. (G-I) Cell cycle analysis of Farage (G), SU-DHL-6 (H), and OCI-LY19 (I) after treatment with 10 nM GRM and 100 nM ABBV-319 for the indicated time. The percentage of cells from sub-G1, G0-G1, S, and G2-M phases of the cell cycle are displayed.
Figure 4.
Figure 4.
ABBV-319 elicits potent and durable antitumor activity in CDX models. (A-E) Growth of xenografted KARPAS422 (A), DB (B), RS4;11 (C-D), and OCI-LY19 (E) tumors after the indicated treatment regimen. Drug treatments were initiated within 24 hours after tumor size matching and randomization (A-C,E), whereas the large RS4;11 tumor (D) was dosed at day 43 after inoculation. Means ± SEM of tumor volumes were plotted for each treatment group vs days from randomization or days after inoculation. (F) Total antibody detected in mouse whole blood from the OCI-LY19 study (E). Means ± SEM are shown. (G) Volume of xenografted OCI-LY19 tumors after indicated treatment for 7 days. GRM was dosed at (QD × 5) × 3, whereas ABBV-319 was dosed as a SD. Means ± SEM of tumor volumes were plotted for each treatment group. (H) Quantitative reverse transcription polymerase chain reaction analysis of FKBP5, TSC22D3, and ZBTB16 expression in tumors after the indicated treatments. Means ± SEM of fold change relative to the vehicle control are displayed. QD, once daily; SD, single dose.
Figure 5.
Figure 5.
ABBV-319 exhibits antitumor activity in non-GCB DLBCL and relapsed DLBCL PDX models. (A-D) Growth of xenografted PDX models 0395 (A), 0262 (B), 0207 (C), and 0016 (D) in NOD-SCID mice after the indicated treatment regimen. Means ± SEM of tumor volumes were plotted for each treatment group vs days from randomization. (A) and 0262 (B) were treatment naïve whereas PDX models 0207 (C) and 0016 (D) were from relapsed disease after the 4 R-CHOP treatments. GCB and non-GCB subtyping were determined via immunohistochemistry methods, as described in “Methods.” (E) Maximal percentage tumor growth inhibition relative to the vehicle control in each PDX model is displayed. Models showing tumor regression after ABBV-319 treatment are shown in the figure. (F) Percentage tumor volume change relative to the starting tumor volume when the vehicle control reaches 1000 mm3. GCB and non-GCB DLBCL are shown as different colors. ∗Denotes PDX samples from patients with relapsed disease after R-CHOP treatment.
Figure 6.
Figure 6.
ABBV-319 induces ADCC in vitro and in vivo. (A) Percentage specific lysis of RS4;11 cells in coculture with PBMC at an effector-to-target (E:T) ratio of 20:1 after 4-hour treatment with the indicated agents. Mean ± SEM are displayed. (B-C) Luciferase reporter activation in Jurkat cells expressing V158 (B) and F158 (C) FcγRIIIa after treatment with the indicated agents for 4 and 16 hours, respectively. Mean ± SEM are displayed. (D-F) Percentage specific lysis of RS4;11 (D), Raji (E), and KARPAS422 (F) in coculturing with PBMC at an E:T ratio of 20:1 after treatment with the indicated agent for 4 hours. Mean ± SEM are displayed. (G) Growth of OCI-LY19 tumors in CB17 SCID or CD34+ PBMC–engrafted NSG-Tg(Hu-IL15) mice after treatment with vehicle or a SD of ABBV-319 at 5 mg/kg. Mean ± SEM of tumor volumes were plotted for each treatment group vs days from randomization. ΔTGImax and TGD1000 were calculated as described in the Methods. (H) Growth of OCI-LY19 tumors in CD34+ PBMC–engrafted NSG-Tg(Hu-IL15) mice after treatment with vehicle or a SD of ABBV-319 at 0.5, 1.5, and 5 mg/kg. Means ± SEM of tumor volumes were plotted for each treatment group vs days from randomization. (I) Flow cytometric immunophenotyping analysis of tail vein bleeds from OCI-LY19 tumor-bearing mice (H). B cells are presented as the percentage of CD45+ cells, whereas T and NK cells are presented as percentages of CD45+ cells without B cells. Details of the immunophenotyping methods are in supplemental Methods. (J) Growth of Raji tumors in CD34+ PMBC–engrafted NSG-Tg(Hu-IL15) mice after the indicated treatment regimen. Means ± SEM of tumor volumes were plotted for each treatment group vs days from randomization.
Figure 7.
Figure 7.
ABBV-319 elicits antitumor effects through 3 distinct MOA. ABBV-319 results in CD19 internalization and lysosomal trafficking to release GRM payload. GRM payload drives the transcriptional activation of GR targets (eg, BCL2L11) to activate apoptotic cell death. ABBV-319 also blocks CD19-mediated activation of the PI3K pathway. Lastly, afucosylation of the Fc region enhances ADCC driven by effector cells.

Comment in

References

    1. Livingston RB, Carter SK. 1st ed. Springer; 1970. Single Agents in Cancer Chemotherapy.
    1. Pearson OH, Eliel LP. Use of pituitary adrenocorticotropic hormone (ACTH) and cortisone in lymphomas and leukemias. J Am Med Assoc. 1950;144(16):1349–1353. - PubMed
    1. Kofman S, Perlia CP, Boesen E, Eisenstein R, Taylor SG., 3rd The role of corticosteroids in the treatment of malignant lymphomas. Cancer. 1962;15:338–345. - PubMed
    1. Fisher RI, Gaynor ER, Dahlberg S, et al. Comparison of a standard regimen (CHOP) with three intensive chemotherapy regimens for advanced non-Hodgkin's lymphoma. N Engl J Med. 1993;328(14):1002–1006. - PubMed
    1. Weikum ER, Knuesel MT, Ortlund EA, Yamamoto KR. Glucocorticoid receptor control of transcription: precision and plasticity via allostery. Nat Rev Mol Cell Biol. 2017;18(3):159–174. - PMC - PubMed

MeSH terms