. 2024 Aug 1;144(5):525-540.
doi: 10.1182/blood.2024024251.

Motive and opportunity: MYC rearrangements in high-grade B-cell lymphoma with MYC and BCL2 rearrangements (an LLMPP study)

Affiliations

Motive and opportunity: MYC rearrangements in high-grade B-cell lymphoma with MYC and BCL2 rearrangements (an LLMPP study)

Laura K Hilton et al. Blood. .

Abstract

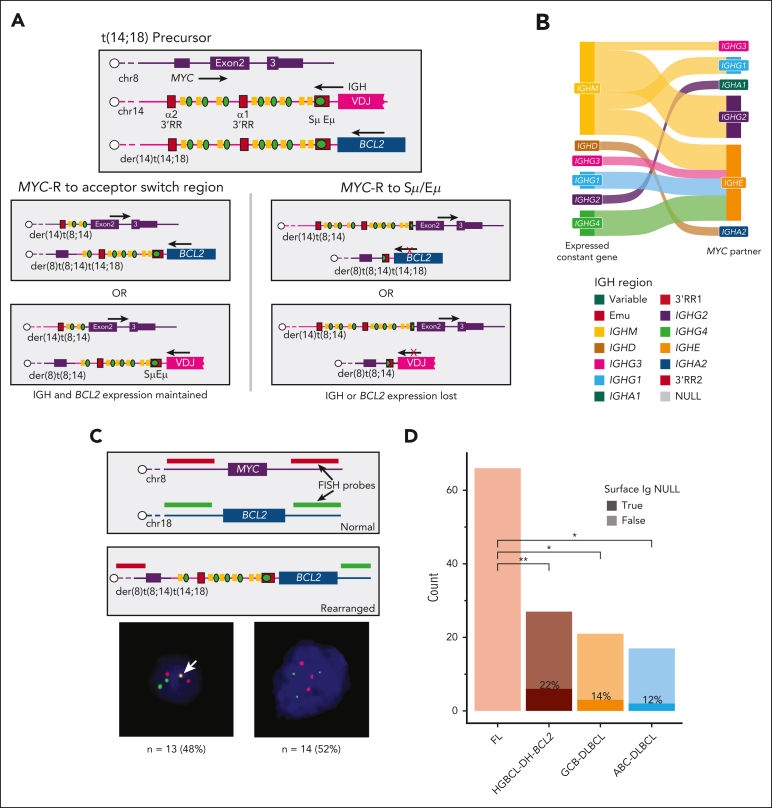
Rearrangements that place the oncogenes MYC, BCL2, or BCL6 adjacent to superenhancers are common in mature B-cell lymphomas. Lymphomas with diffuse large B-cell lymphoma (DLBCL) or high-grade morphology with both MYC and BCL2 rearrangements are classified as high-grade B-cell lymphoma with MYC and BCL2 rearrangements ("double hit"; HGBCL-DH-BCL2) and are associated with aggressive disease and poor outcomes. Although it is established that MYC rearrangements involving immunoglobulin (IG) loci are associated with inferior outcomes relative to those involving other non-IG superenhancers, the frequency of and mechanisms driving IG vs non-IG MYC rearrangements have not been elucidated. Here, we used custom targeted capture and/or whole-genome sequencing to characterize oncogene rearrangements across 883 mature B-cell lymphomas including Burkitt lymphoma, follicular lymphoma, DLBCL, and HGBCL-DH-BCL2 tumors. We demonstrate that, although BCL2 rearrangement topology is consistent across entities, HGBCL-DH-BCL2 have distinct MYC rearrangement architecture relative to tumors with single MYC rearrangements or with both MYC and BCL6 rearrangements (HGBCL-DH-BCL6), including both a higher frequency of non-IG rearrangements and different architecture of MYC::IGH rearrangements. The distinct MYC rearrangement patterns in HGBCL-DH-BCL2 occur on the background of high levels of somatic hypermutation across MYC partner loci in HGBCL-DH-BCL2, creating more opportunity to form these rearrangements. Furthermore, because 1 IGH allele is already disrupted by the existing BCL2 rearrangement, the MYC rearrangement architecture in HGBCL-DH-BCL2 likely reflects selective pressure to preserve both BCL2 and B-cell receptor expression. These data provide new mechanistic explanations for the distinct patterns of MYC rearrangements observed across different lymphoma entities.


Conflict of interest statement

Conflict-of-interest disclosure: D.W.S., R.D.M., L.M.R., G.W., L.M.S., E.C., T.C.G., J.R.C., K.F., E.S.J., A.R., W.C.C., G.I., J.D., and D.D.W. are named inventors on patents for the use of gene expression to subtype aggressive B-cell lymphomas, one of which is licensed to NanoString Technologies. C.S. reports consultancy fees from AbbVie, Bayer, and Seattle Genetics; and research funds from Trillium Therapeutics, Bristol Myers Squibb (BMS), and Epizyme. L.H.S. reports consulting fees/honoraria from AbbVie, Amgen, AstraZeneca, BeiGene, BMS/Celgene, GenMab, Kite/Gilead, Incyte, Janssen, Merck, Seagen, and Roche/Genentech; and research funding from Roche/Genentech and Teva. K.J.S. reports honoraria/consulting fees from BMS, Merck, Seagen, Janssen, and AbbVie; steering committee fees from AstraZeneca; research funding from BMS and Roche; and the data safety monitoring committee for Regeneron. D.W.S. reports consulting fees/honoraria from AbbVie, AstraZeneca, GenMab, Incyte, Roche/Genentech, and Veracyte and research funding from Roche/Genentech. The remaining authors declare no competing financial interests.

Figures

None
Graphical abstract
Figure 1.
Figure 1.
BCL2 aSHM is an accurate proxy for BCL2-Rs. (A) Summary of sequencing types across lymphoma entities. (B) Percentage of rearrangements identified by BA-FISH that were identified in sequencing data. (C-E) Architecture of BCL2-Rs in FL (C), DLBCL (D), and HGBCL-DH-BCL2 (E). In each plot, the outermost ring gives the chromosome ideogram, followed by a genomic coordinate scale, a gene coordinate track, and a rainfall plot of intermutation distance with points colored according to whether the mutation overlaps the canonical AID WRCY motif (red) or not (black). Mutations are only shown in regions covered by the targeted capture panel and include tumors without rearrangements. Innermost lines show the linkages between BCL2 and the most common rearrangement partners. (F) BCL2 expression by RNAseq stratified by BCL2-R status. FDR-corrected Wilcoxon tests were used to compare the expression of each group with DLBCLs without BCL2-R. ∗∗P < .01; ∗∗∗∗P < .0001. (G) Mutation count at the BCL2 TSS stratified by lymphoma entity and BCL2 FISH status. The x-axis indicates the presence of a rearrangement determined by sequencing. The horizontal black line indicates the optimal cutoff of 3.5 mutations for predicting the presence of a BCL2-R. The total number and percentage of tumors with mutations over the cutoff are indicated above each group. (H-I) Receiver operating characteristic (ROC) curves giving sensitivity and specificity of BCL2 mutation counts at the TSS (H) or within exon 1 (I) to predict BCL2 rearrangement status. The red point is labeled with the Youden optimal cutoff (sensitivity and specificity). AUC, area under the curve; FDR, false detection rate; ND, not done; NEG, negative; POS, positive; TSS, transcription start site.
Figure 1.
Figure 1.
BCL2 aSHM is an accurate proxy for BCL2-Rs. (A) Summary of sequencing types across lymphoma entities. (B) Percentage of rearrangements identified by BA-FISH that were identified in sequencing data. (C-E) Architecture of BCL2-Rs in FL (C), DLBCL (D), and HGBCL-DH-BCL2 (E). In each plot, the outermost ring gives the chromosome ideogram, followed by a genomic coordinate scale, a gene coordinate track, and a rainfall plot of intermutation distance with points colored according to whether the mutation overlaps the canonical AID WRCY motif (red) or not (black). Mutations are only shown in regions covered by the targeted capture panel and include tumors without rearrangements. Innermost lines show the linkages between BCL2 and the most common rearrangement partners. (F) BCL2 expression by RNAseq stratified by BCL2-R status. FDR-corrected Wilcoxon tests were used to compare the expression of each group with DLBCLs without BCL2-R. ∗∗P < .01; ∗∗∗∗P < .0001. (G) Mutation count at the BCL2 TSS stratified by lymphoma entity and BCL2 FISH status. The x-axis indicates the presence of a rearrangement determined by sequencing. The horizontal black line indicates the optimal cutoff of 3.5 mutations for predicting the presence of a BCL2-R. The total number and percentage of tumors with mutations over the cutoff are indicated above each group. (H-I) Receiver operating characteristic (ROC) curves giving sensitivity and specificity of BCL2 mutation counts at the TSS (H) or within exon 1 (I) to predict BCL2 rearrangement status. The red point is labeled with the Youden optimal cutoff (sensitivity and specificity). AUC, area under the curve; FDR, false detection rate; ND, not done; NEG, negative; POS, positive; TSS, transcription start site.
Figure 2.
Figure 2.
MYC-Rs frequently involve non-IG loci in HGBCL-DH-BCL2. (A-C) Diagrams showing the architecture of MYC-R (top row) and relative frequency (bottom row) of different rearrangement partners across BL (A), DLBCL (B), and HGBCL-DH-BCL2 (C). In each circular plot, the outermost ring gives the chromosome ideogram, followed by a genomic coordinate scale, a gene coordinate track, and a rainfall plot of intermutation distance with points colored according to whether the mutation overlaps the canonical AID WRCY motif (red) or not (black). Mutations are only shown in regions covered by the targeted capture panel and include tumors without rearrangements. Innermost lines show the linkages between MYC and the most common rearrangement partners. (D) MYC expression measured from RNAseq data across different lymphoma entities, stratified by rearrangement partner group. FDR-corrected Wilcoxon tests compare expression to DLBCL with no MYC-R (“none”; below the boxplots) or to tumors with MYC::IGH rearrangements within each entity (above the boxplots). “False negative” indicates tumors that were positive for MYC-R by FISH but the rearrangement was not identified by sequencing. ns, not significant; REF, reference group; ∗P < .05; ∗∗P < .01; ∗∗∗P < .001; ∗∗∗∗P < .0001.
Figure 3.
Figure 3.
MYC::IGH rearrangements arise by distinct mechanisms across lymphoma entities. (A-C) Diagrams showing the architecture of MYC::IGH rearrangements at high resolution (top row) and the frequency of each rearrangement partner (bottom row) across BL (A), DLBCL (B), and HGBCL-DH-BCL2 (C). In each circular plot, the outermost ring gives the chromosome ideogram, followed by a genomic coordinate scale, a gene coordinate track including Eμ and 3' regulatory region enhancers in red, and a rainfall plot of intermutation distance with points colored according to whether the mutation overlaps the canonical AID WRCY motif (red) or not (black), including mutations from tumors without rearrangements. Innermost lines show the linkages between MYC and IGH. (D) The frequency of MYC::IGH rearrangements attributable to either CSR or SHM. The frequency of each type of event was compared by FDR-corrected pairwise Fisher exact tests. (E) Expression of MYC determined from RNAseq data, stratified by the region of IGH to which MYC is rearranged. FDR-corrected Wilcoxon tests were used to compare expression levels of each group with DLBCL without MYC-R (“MYC-R Neg”). No RNAseq data were available for any of the HGBCL-DH-BCL2 tumors with MYC-R involving variable or Eμ/IGHM regions. ∗P < .05; ∗∗P < .01; ∗∗∗P < .001; ∗∗∗∗P < .0001. REF, reference group.
Figure 4.
Figure 4.
HGBCL-DH-BCL2 experience elevated SHM across MYC partner loci. (A) Median mutation counts across recurrent MYC partner loci covered by the targeted capture sequencing assay. (B) Mutation counts per tumor within the IGH Eμ enhancer and TSS of each constant gene. IGHM was separated from Eμ using the boundary defined in supplemental Figure 6A. In panels A-B, HGBCL-DH-BCL2 was used as the reference group for FDR-corrected Wilcoxon tests to identify significant differences in mutation counts for each locus. (C) A row-normalized heat map showing expression levels of each IGH constant gene determined by RNAseq. Samples are ordered according to IGHM expression. The CSR track indicates whether each tumor was predicted to express a functional IGHM/D (no) or a different IGHC gene (yes). (D) Expression levels of genes that may be involved in the regulation of aSHM and/or CSR compared with pairwise FDR-corrected Wilcoxon tests. (E) Mutation counts at the MYC TSS stratified by lymphoma entity and MYC rearrangement partner or predicted IGH rearrangement mechanism. The number and percentage of tumors with ≥1 mutation in the MYC TSS are indicated above each grouping. Within each entity, FDR-corrected Wilcoxon tests were used to compare the mutation counts for each MYC-R partner/mechanism group (with at least 4 tumors) with that of IGH-CSR. ns, not significant; ∗P < .05; ∗∗P < .01; ∗∗∗P < .001; ∗∗∗∗P < .0001. IGHC, constant region of IGH locus; IGHVDJ, variable (V), diversity (D), and joining (J) region of the IGH locus; ND, not done; REF, reference group.
Figure 5.
Figure 5.
HGBCL-DH-BCL2 tumors are frequently class switched. (A) Constant gene usage predicted from RNAseq data with MiXCR across lymphoma entities. The x-axis indicates the percent of tumors within each entity, whereas numbers at each bar indicate the absolute number of tumors predicted to use each constant gene. (B) The proportion of each lymphoma entity with predicted CSR (IGH constant gene other than IGHM or IGHD). The frequency of CSR between entities was compared with FDR-corrected pairwise Fisher exact tests. ∗∗P < .01; ∗∗∗∗P < .0001. (C) Constant gene usage in HGBCL-DH-BCL2 stratified by MYC-R partner.
Figure 6.
Figure 6.
MYC-R are constrained by the preceding BCL2-R. (A) Diagrams showing the topology of MYC and IGH alleles in a precursor cell harboring a IGH::BCL2 rearrangement, followed by the possible positions of rearrangements and their effects on BCL2 and BCR expression. (B) A Sankey diagram comparing the MiXCR-predicted expressed constant gene vs the MYC partner in HGBCL-DH-BCL2 tumors with MYC::IGH rearrangements. The figure legend gives the order of all constant genes and enhancer regions as they appear in the genome. (C) A custom FISH assay designed to identify MYC-R involving the der(14)t(14;18) chromosome, with representative examples of FISH patterns identified. The white arrow indicates the fusion observed in tumors with der(8)t(8;14)t(14;18). (D) The frequency of surface Ig expression determined by flow cytometry, compared with FDR-corrected pairwise Fisher exact tests. RR, regulatory region; ∗P < .05; ∗∗P < .01.
Figure 7.
Figure 7.
BCL6-R architecture. (A-C) Diagrams showing the architecture of MYC::IGH rearrangements at high resolution (top row) and the frequency of each rearrangement partner (bottom row) across DLBCL (A), HGBCL-DH-BCL2 (B), and HGBCL-DH-BCL6 (C). In each circular plot, the outermost ring gives the chromosome ideogram, followed by a genomic coordinate scale, a gene coordinate track, and a rainfall plot of intermutation distance with points colored according to whether the mutation overlaps the canonical AID WRCY motif (red) or not (black). Innermost lines show the linkages between BCL6 and IGH. (D) BCL6 expression measured from RNAseq data, stratified by lymphoma entity and BCL6-R partner. FDR-corrected Wilcoxon tests compared the expression of BCL6 stratified by rearrangement partner with that of DLBCL without BCL6-R. (E) Diagram showing MYC-R architecture in HGBCL-DH-BCL6. (F) MYC expression determined in HGBCL-DH-BCL6. FDR-corrected Wilcoxon tests compared the expression of MYC::IGH, all MYC::non-IGH, or false negative (tumors in which the MYC partner was not identified by sequencing) with the expression of MYC in DLBCL without MYC-R (“none”). ns, not significant; ∗P < .05; ∗∗∗∗P < .0001.

Comment in

References

    1. Ott G, Rosenwald A, Campo E. Understanding MYC-driven aggressive B-cell lymphomas: pathogenesis and classification. Blood. 2013;122(24):3884–3891. - PubMed
    1. Campo E, Jaffe ES, Cook JR, et al. The International Consensus Classification of mature lymphoid neoplasms: a report from the Clinical Advisory Committee. Blood. 2022;140(11):1229–1253. - PMC - PubMed
    1. Carbone A, Roulland S, Gloghini A, et al. Follicular lymphoma. Nat Rev Dis Primer. 2019;5(1):83. - PubMed
    1. Scott DW, King RL, Staiger AM, et al. High-grade B-cell lymphoma with MYC and BCL2 and/or BCL6 rearrangements with diffuse large B-cell lymphoma morphology. Blood. 2018;131(18):2060–2064. - PMC - PubMed
    1. Rosenwald A, Bens S, Advani R, et al. Prognostic significance of MYC rearrangement and translocation partner in diffuse large B-cell lymphoma: a study by the Lunenburg Lymphoma Biomarker Consortium. J Clin Oncol. 2019;37(35):3359–3368. - PubMed

Publication types

MeSH terms

Substances

LinkOut - more resources