. 2024 May 2;31(5):754-771.e6.
doi: 10.1016/j.stem.2024.04.001.

Alternative splicing of a chromatin modifier alters the transcriptional regulatory programs of stem cell maintenance and neuronal differentiation

Affiliations

Alternative splicing of a chromatin modifier alters the transcriptional regulatory programs of stem cell maintenance and neuronal differentiation

Mohammad Nazim et al. Cell Stem Cell. .

Abstract

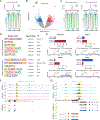
Development of embryonic stem cells (ESCs) into neurons requires intricate regulation of transcription, splicing, and translation, but how these processes interconnect is not understood. We found that polypyrimidine tract binding protein 1 (PTBP1) controls splicing of DPF2, a subunit of BRG1/BRM-associated factor (BAF) chromatin remodeling complexes. Dpf2 exon 7 splicing is inhibited by PTBP1 to produce the DPF2-S isoform early in development. During neuronal differentiation, loss of PTBP1 allows exon 7 inclusion and DPF2-L expression. Different cellular phenotypes and gene expression programs were induced by these alternative DPF2 isoforms. We identified chromatin binding sites enriched for each DPF2 isoform, as well as sites bound by both. In ESC, DPF2-S preferential sites were bound by pluripotency factors. In neuronal progenitors, DPF2-S sites were bound by nuclear factor I (NFI), while DPF2-L sites were bound by CCCTC-binding factor (CTCF). DPF2-S sites exhibited enhancer modifications, while DPF2-L sites showed promoter modifications. Thus, alternative splicing redirects BAF complex targeting to impact chromatin organization during neuronal development.

Keywords: BAF complex; DPF2; PTBP1; alternative splicing; chromatin remodeling; embryonic stem cell; histone modification; mammalian SWI/SNF complex; neuronal differentiation; transcription.


Conflict of interest statement

Declaration of interests The authors declare no competing interests.

Figures
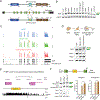
Figure 1.
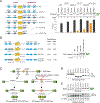
Figure 1.. Dpf2 exon 7 is alternatively spliced in a tissue- and developmental stage-specific manner.
(A) Schematic of Dpf2 gene and alternatively spliced variants of DPF2 protein showing the REQUIEM, C2H2, PHD1, and PHD2 domains. (B) RT-PCR of Dpf2 exon 7 splicing across mouse tissues. (C) Genome browser tracks of Dpf2 RNA in mouse ESC, NPC, and DIV-5 cortical neurons. (D) RT-PCR of RNA samples in (C). (E) Browser display of PTBP1 iCLIP-tags (purple lines) flanking exon 7 in ESCs. Star denotes cross-link sites. (F) RT-PCR of exon 7 splicing in minigene and endogenous transcripts after Ptbp1 and Ptbp2 knockdown. Bar graphs (right) show quantification of percent-spliced-in (PSI). Bars represent mean ± SD, n=3. *: p < 0.05; **: p < 0.01 (Student’s t-test).
Figure 2.
Figure 2.. PTBP1 and a weak 5’ splice site together regulate splicing of Dpf2 exon 7.
(A) Schematics of Dpf2 minigenes with wild-type or mutated sequences. PTBP1 iCLIP clusters are indicated as purple bars. (right panel) Quantification of RT-PCR data. (B) RT-PCR of Dpf2 minigenes containing wild-type or mutant 5’ and 3’SS with corresponding MaxEntScan scores. (C) CRISPR/Cas9 genome-editing to generate lines expressing either DPF2-S, or DPF2-L. (D-E) Genotyping (D), RT-PCR, and Immunoblot (E) of ESC clones carrying homozygous wild-type, E7-KO, and E7-KI alleles. U1–70K, internal control. ‘*’, non-specific band. Note that the lower signal in the outer lanes of the immunoblot is attributed to incomplete transfer.
Figure 3.
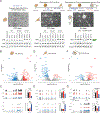
Figure 3.. DPF2 isoforms regulate distinct programs of gene expression during neuronal differentiation of ESC.
(A) Schematic of differentiation of ESC to NPC or GN. (bottom panel) RT-PCR assays. (B, D, F) Volcano plots of differentially expressed genes (DEGs) in mouse ESCs(B), NPC (D), and GN (F) expressing DPF2-S or DPF2-L. Significant DEGs were filtered by 1.5-fold changes with P-value below 0.05 (FDR < 0.1). (C, E, G) Browser tracks of selected DEGs in ESC (C), NPC (E), and GN (G). (right panel) Bar graphs of normalized expression (TPM mean ± SD). *: p < 0.05; **: p < 0.01; ***: p < 0.001 (Student’s t-test).
Figure 4.
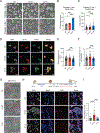
Figure 4.. DPF2 isoforms drive distinct phenotypes in ESC and developing neurons.
(A) Brightfield images of ESC colonies. Scale bar, 100 μm. (B) Quantification of percent flat-shaped ESC colonies. Seven fields were counted per genotype, each containing >80 individual colonies. (C) Quantification of mean (± SD) colony area for >100 individual ESC colonies. (D) Immunofluorescence of OCT4 and SOX2 in ESC in feeder-free culture. Arrows indicate individual cells with reduced OCT4 relative to SOX2. Scale bar, 20 μm. (E) Quantification of signal for OCT4 in (D). Mean (± SD) determined from >40 individual ESC per genotype. (F) Quantification of OCT4 signal relative to SOX2 in (D). Mean (± SD) ratios were determined from >40 individual ESCs per genotype. (G) Brightfield images of ESC-derived GNs at DIV-4. Arrow indicates a colony of proliferating non-neuronal cells. Scale bar, 100 μm. (H) Immunofluorescence of Map2 and GluR1 in DIV-4 GNs. Scale bar, 10 μm. (I) Quantification of ratio of Map2(−) over Map2(+) cells in (H). >20 fields per genotype were counted, each containing >35 individual cells. *: p < 0.05; **: p < 0.01; ***: p < 0.001; ****: p < 0.0001 (Student’s t-test)
Figure 5.
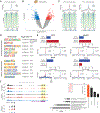
Figure 5.. DPF2-S preferentially binds to genomic regions associated with pluripotency transcription factors in ESC.
(A) Metaplot and normalized tag density profiles of ChIP-seq peaks in ESC. (B) Volcano plot of differential chromatin binding by DPF2-S and DPF2-L in ESC. Significant differential binding was filtered for 1.5-fold changes (P-value < 0.05). DPF2-S and DPF2-L preferential binding sites are labeled as red and blue dots, respectively. (C) Metaplot and normalized tag density profiles for DPF2-S and DPF2-L preferential binding sites. (D) Enrichment of sequence motifs in DPF2-S and DPF2-L preferential binding sites. (E) Percent overlap and metaplots of DPF2-S and DPF2-L preferential binding sites with known OCT4, NANOG, NFY-A, and KLF4 binding sites. (F) Genome browser tracks at the Myc locus. Annotated ESC enhancer region is shown as purple bar. Region of differential binding is highlighted in yellow. (G) UpSet plot of DEGs regulated by alternative DPF2 isoforms and Myc (X axis). Y axis shows the intersection between sets.
Figure 6.
Figure 6.. DPF2-S and -L preferentially bind regions associated with NFI or CTCF transcription factors in NPC.
(A) Metaplot and normalized tag density profiles of all ChIP-seq peaks in NPC. (B) Volcano plot showing differential chromatin binding by DPF2-S and DPF2-L in NPC. Significant differential binding was filtered by 1.5-fold changes (P-value < 0.05). (C) Metaplot and normalized tag density profiles for DPF2-S and DPF2-L preferential binding sites. (D) Enrichment of sequence motifs in the DPF2-S and DPF2-L preferential binding sites. (E) Percent overlap and metaplots of DPF2-S and DPF2-L preferential binding sites with known NFI, ASCL1, OLIG2, and CTCF binding sites in NPC. (F-G) Browser tracks for the Gm4779, 8030474K03Rik (F), and Synpo (G) loci. Regions showing differential binding are highlighted in yellow.
Figure 7.
Figure 7.. DPF2-S binds to chromatin sites with enhancer modifications, and DPF2-L to sites with promoter modifications.
(A) Analysis with an 18-state ChromHMM model of DPF2-S and DPF2-L preferential binding sites in ESC. Rows represent different chromatin states and columns the fold enrichments (ChromHMM emission probabilities) of these states, colored from highest to lowest. (B) Metaplots of signal intensities for H3K4me1, H3K4me2, H3K4me3, H3K9ac, H3K27ac, and H3K79me2 chromatin modifications in ESC near DPF2-S and DPF2-L preferential binding sites. (C) Analysis with a mouse E15.5 forebrain-specific 15-state ChromHMM model of DPF2-S and DPF2-L preferential binding sites in NPC. (D) Metaplots of signal intensities for H3K4me1, H3K4me2, H3K4me3, H3K9ac, H3K27ac, and H3K27me3 chromatin modifications in NPC near the DPF2-S and DPF2-L preferential binding sites.

References

    1. Vuong JK, Lin C-H, Zhang M, Chen L, Black DL, and Zheng S (2016). PTBP1 and PTBP2 Serve Both Specific and Redundant Functions in Neuronal Pre-mRNA Splicing. Cell Reports 17, 2766–2775. 10.1016/j.celrep.2016.11.034. - DOI - PMC - PubMed
    1. Keppetipola N, Sharma S, Li Q, and Black DL (2012). Neuronal regulation of pre-mRNA splicing by polypyrimidine tract binding proteins, PTBP1 and PTBP2. Critical Reviews in Biochemistry and Molecular Biology 47, 360–378. 10.3109/10409238.2012.691456. - DOI - PMC - PubMed
    1. Boutz PL, Stoilov P, Li Q, Lin C-H, Chawla G, Ostrow K, Shiue L, Ares M, and Black DL (2007). A post-transcriptional regulatory switch in polypyrimidine tract-binding proteins reprograms alternative splicing in developing neurons. Genes Dev. 21, 1636–1652. 10.1101/gad.1558107. - DOI - PMC - PubMed
    1. Linares AJ, Lin C-H, Damianov A, Adams KL, Novitch BG, and Black DL (2015). The splicing regulator PTBP1 controls the activity of the transcription factor Pbx1 during neuronal differentiation. eLife 4, e09268. 10.7554/eLife.09268. - DOI - PMC - PubMed
    1. Makeyev EV, Zhang J, Carrasco MA, and Maniatis T (2007). The MicroRNA miR-124 Promotes Neuronal Differentiation by Triggering Brain-Specific Alternative Pre-mRNA Splicing. Molecular Cell 27, 435–448. 10.1016/j.molcel.2007.07.015. - DOI - PMC - PubMed

Publication types

MeSH terms