. 2024 Jun 4;36(6):1335-1350.e8.
doi: 10.1016/j.cmet.2024.04.010. Epub 2024 May 2.

Dietary intake and glutamine-serine metabolism control pathologic vascular stiffness

Affiliations

Dietary intake and glutamine-serine metabolism control pathologic vascular stiffness

Nesrine S Rachedi et al. Cell Metab. .

Abstract

Perivascular collagen deposition by activated fibroblasts promotes vascular stiffening and drives cardiovascular diseases such as pulmonary hypertension (PH). Whether and how vascular fibroblasts rewire their metabolism to sustain collagen biosynthesis remains unknown. Here, we found that inflammation, hypoxia, and mechanical stress converge on activating the transcriptional coactivators YAP and TAZ (WWTR1) in pulmonary arterial adventitial fibroblasts (PAAFs). Consequently, YAP and TAZ drive glutamine and serine catabolism to sustain proline and glycine anabolism and promote collagen biosynthesis. Pharmacologic or dietary intervention on proline and glycine anabolic demand decreases vascular stiffening and improves cardiovascular function in PH rodent models. By identifying the limiting metabolic pathways for vascular collagen biosynthesis, our findings provide guidance for incorporating metabolic and dietary interventions for treating cardiopulmonary vascular disease.

Keywords: cardiovascular disease; collagen metabolism; fibrosis; glutamine metabolism; metabolism; nutrition; pulmonary hypertension; serine metabolism; vascular fibroblast.


Conflict of interest statement

Declaration of interests S.Y.C. has served as a consultant for Merck, Janssen, and United Therapeutics. S.Y.C. is a director, officer, and shareholder in Synhale Therapeutics. S.Y.C. has held research grants from WoodNext, Bayer, and United Therapeutics. S.Y.C. and T.B. have filed patent applications regarding the targeting of metabolism in pulmonary hypertension. G.Y., Z.-K.Y., and O.O. are listed as inventors in patents not related to this work, which are filed by MSKCC. O.O. receives royalties from MSKCC, Johnson & Johnson, Jazz, and Y-mAbs and owns shares in Angiogenex, for which he is an unpaid member of the SAB, all of which are not related to this work.

Figures
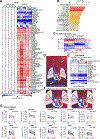
Figure 1:
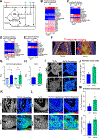
Figure 1:. In vitro and in vivo evidence of proline and glycine metabolic rewiring in PH.
(A-B) Heatmap (A) and pathway enrichment analysis (B) of significantly (FDR<0.1; P<0.05) modulated intracellular metabolites in PH-PAAFs, with log2(fold change) range between −4 to 4. (C) Heatmap of significantly (FDR<0.1; P<0.05) modulated metabolites in PH-PAAF conditioned media, with log2(fold change) range between −2 to 2. (D) Schema of blood sampling for measurement of transpulmonary gradient of metabolites in rat (yellow, site of blood collection). (E) Heat map of significantly (FDR<0.1; P<0.05) modulated metabolites in the transpulmonary gradient of monocrotaline-exposed rats (N=8 per group), with log2(fold change) range between −1 to 1. (F) Schema of blood sampling for measurement of transpulmonary gradient of metabolites in human. (G) Level of indicated metabolites in the transpulmonary gradient of patients with PH (N=8) and control (N=5). P values calculated by paired two-tailed Student’s T-test. Mono: Monocrotaline. PCW: Pulmonary capillary wedge. N’ numbers indicate biological replicates.
Figure 2:
Figure 2:. Glutamine and serine catabolism sustain proline and glycine anabolism in activated pulmonary arterial adventitial fibroblasts (PAAFs).
(A) Schematic representation of glucose, glutamine, and serine pathways. (B-E) PAAFs plated on the indicated substrate and treated as indicated. Heatmap of 13C6-glucose (B), 13C5-glutamine (C), 13C5-glutamate (D) and 13C3-serine (E) incorporation in intracellular metabolites. (F) 18F-FGln-PET imaging displayed increased tracer uptake in RV (white arrow) and lung (red arrow) of MCT PAH rats. (G-H) 18F-FGln uptake in regions of bronchovasculature (G), and lung parenchyma (H) in monocrotaline-exposed rats (N=6) as compared with PBS control (N=6). Data are expressed as standard uptake value ratios (SUVr). (I-M) After treating monocrotaline-exposed rats vs. controls (N=3–4 per group) with 15N-labeled glutamine, 15N-labeled serine, or 15N-labeled serine and 2H-labeled glutamine administered simultaneously, rats were sacrificed, and fixed lung was analyzed by multi-isotope imaging mass spectrometry (MIMS). Representative images (I, K and L) and quantification of 15N-glutamine (J), and 15N-serine and 2H-glutamine (M) incorporation by pulmonary arteriolar mural cells, expressed as percent above background ratio. The rainbow scale is set from 0% above background ratio in blue to 100% for glutamine or 150% for serine in red (2 to 2.5 fold above background ratio). Scale=10 μm. In all the panels *P<0.05; **P<0.01; two-tailed Student’s t-test was used; data show mean ± s.e.m. N’ numbers indicate biological replicates.
Figure 3:
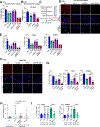
Figure 3:. Glutamine and serine catabolism sustain the metabolic needs of collagen biosynthesis.
(A-B) Collagen concentration (media) of IL-6-activated PAAFs (A) and PH-PAAFs (B) treated as indicated. (C-I) Schema of the experimental procedure (C). Representative image (D and F) and quantification (E, G and I) of fibrillar collagen and vascular (PAEC and PASMC) cell proliferation. (H) Matrix stiffness assessed by atomic force microscopy. Data are represented by Tukey box-and-whisker plots. Median represents measures from n=3 matrices/group. In all panels **P<0.01; ***P<0.001; ANOVA with Bonferroni’s multiple comparison test was used in (A-G, I); Kruskal-Wallis with Dunn’s post-hoc testing was used in (H); data show mean ± s.d. Scale=20 μm. For all the panels, each dot represents a biological replicates.
Figure 4:
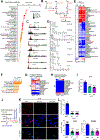
Figure 4:. YAP and TAZ metabolically control collagen biosynthesis.
(A) Pathway enrichment analysis of genes with TEAD biding sites (ENCODE Project) in their promoter regions. (B) Schematic of the collagen metabolism pathway. (C) TEAD binding enrichment in the promoter region of indicated genes. (D) ChIP-qPCR confirmed the presence of TEAD/YAP binding sites in the promoter regions of indicated genes. Results are expressed as percentage of total input DNA prior to immunoprecipitation with anti-YAP or anti-IgG control. (E-F) Heatmap with log2(fold change) range between −2 to 2 (E) and pathway enrichment analysis (F) of significantly (FDR<0.1; P<0.05) modulated intracellular metabolites in PAAFs treated as indicated. (G-H) PAAFs were treated as indicated. Heatmap of 13C5-glutamine (G) and 13C3-serine (H) incorporation in intracellular metabolites. (I) Matrix collagen concentration of PAAFs treated as indicated. (J-L) Schema of the experimental procedure (J). Representative image (K) and quantification (L) of fibrillar collagen and vascular (PAEC and PASMC) cell proliferation. Scale=20 μm. In all panels *P<0.05; **P<0.01; ****P<0.0001; Mann-Whitney test was used in (D:SLC6A9-E; SHMT1:E); two-tailed Student’s T-test was used in remaining panels of (D); ANOVA with Bonferroni’s multiple comparison test was used in (I, L: Ki67 graphs); Kruskal-Wallis with Dunn’s post-hoc testing was used in (L: area thresholded). Data show mean ± s.d. For all the panels, each dot represents a biological replicates.
Figure 5:
Figure 5:. Genetic deletion of YAP and TAZ in vascular fibroblast prevents collagen biosynthesis and ameliorates PH.
(A) Protocol for conditional YAP/TAZ deletion (cKO) in IL-6 transgenic mice. (B-C, E, and H) Immunostaining and quantification for GLS1 (B), SHMT1 (C), collagen I (Col1; E) and Ki67 (H) in pulmonary artery from YAP/TAZcKO mice or control mice (Ctrl). (D) Collagen concentration (Total and fibrillar) of lungs from YAP/TAZcKO mice or Ctrl mice. (F) Representative images and quantification of picrosirius red staining in pulmonary artery from YAP/TAZcKO mice or Ctrl mice. (G) Pulmonary vascular stiffness assessed by atomic force microscopy. Data are represented by Tukey box-and-whisker plots. Median represents measures from n=3 mice/group. (I-K) Pulmonary arteriolar muscularization (I), right ventricular systolic pressure (J), and right ventricular hypertrophy (Fulton index, RV/LV+S; K) of YAP/TAZcKO mice or Ctrl mice. Scale=50 μm. In all panels, *P<0.05; **P<0.01; ***P<0.001; ****P<0.0001; Mann-Whitney test was used in (F:Orthogonal; G-I); two-tailed Student’s T-test was used in (B-E; F:Parallel; J-K). Data show mean ± s.e.m. Panel B-C, E-F, and H-I: each dot represents a single artery from N=5 Control mice and N=6 cKO mice. Panel D and J-K each dot represents a single mouse
Figure 6:
Figure 6:. Pharmacologic inhibition of glutamine and serine catabolism decreases collagen biosynthesis and vascular stiffening in PH.
(A) In a protocol of disease reversion, rats were subjected to monocrotaline injection, and seven days later, they received daily i.p. injections of either GLS1 inhibitor (CB-839, N=8), or SHMT1 inhibitor (SHIN1, N=9), or both CB-839 + SHIN1 (N=9) or vehicle (Ctrl; N=9). (B) Collagen concentration (Total and fibrillar) of lungs from rats treated as indicated. (C) Immunostaining and quantification for collagen I (Col1) in pulmonary artery from rats treated as indicated. (D) Pulmonary vascular stiffness assessed by atomic force microscopy. Data are represented by Tukey box-and-whisker plots. Median represents measures from n=4 rats/group for (SHIN1 and CB-839+SHIN1) and n=7 rats/group for (Ctrl and CB-839). (E) Immunostaining and quantification for Ki67 in pulmonary artery from rats treated as indicated. (F-H) Pulmonary arteriolar muscularization (F), right ventricular systolic pressure (G), and right ventricular hypertrophy (Fulton index, RV/LV+S; H) of rats treated as indicated. Each dot represents a single rat. Scale=50 μm. In all panels *P<0.05; **P<0.01; ***P<0.001; ****P<0.0001; ANOVA with Bonferroni’s multiple comparison test was used in (B, C, E, H); Kruskal-Wallis with Dunn’s post-hoc testing was used in (D, F, G). Data show mean ± s.e.m. In panels B-C, and E-H each dot represents a single rat
Figure 7:
Figure 7:. A glutamine- and serine-free diet prevents pulmonary vascular stiffening and PH.
(A) Rats received normal chow until 12 weeks of age; they were then transferred to either a control diet (synthetic diet, containing glutamine and serine) or a matched diet lacking glutamine and serine (Gln/Ser diet). Eighteen (18) days after diets were initiated, rats were injected with monocrotaline. At Day 39, rats were euthanized and assessed for PH. (B) Serum levels of glutamine, serine, and glucose were analyzed at serial time points. Mean expression in control group was assigned a fold change of 1, to which relevant samples were compared. (C) At D39, serum levels of the indicated metabolites were analyzed. Unpaired two-tailed Student’s T-test and Mann-Whitney test. (D) Collagen concentration (total and fibrillar) of lungs from rats treated as indicated. (E) Immunostaining and quantification for collagen I (Col1) in pulmonary artery from rats treated as indicated. (F) Pulmonary vascular stiffness assessed by atomic force microscopy. Data are represented by Tukey box-and-whisker plots. Median represents measures from n=7 rats/group for (standard diet) and n=4 rats/group for (synthetic diet and Gln/Ser diet). (G-H) Immunostaining (G) and quantification (H) for Ki67 in pulmonary artery from rats treated as indicated. (I-K) Pulmonary arteriolar muscularization (I), right ventricular systolic pressure (J), and right ventricular hypertrophy (Fulton index, RV/LV+S; K) of rats treated as indicated. Each dot represents a single rat. Scale=50 μm. In all panels, *P<0.05; **P<0.01; ***P<0.001; ****P<0.0001; Mann-Whitney test was used in (C:glutamine/glutamate; phenylalanine/tyrosine; D:soluble/insoluble collagen); two-tailed Student’s T-test was used in remaining panels of (C) as well as (D: collagen). ANOVA with Bonferroni’s multiple comparison test was used in (E, G, H, I, J); Kruskal-Wallis with Dunn’s post-hoc testing was used in (F). Data show mean ± s.e.m. In panels C-E and G-J each dot represents a single rat.

References

    1. Roth GA, Mensah GA, Johnson CO, Addolorato G, Ammirati E, Baddour LM, Barengo NC, Beaton AZ, Benjamin EJ, Benziger CP, et al. (2020). Global Burden of Cardiovascular Diseases and Risk Factors, 1990–2019: Update From the GBD 2019 Study. J Am Coll Cardiol 76, 2982–3021. 10.1016/j.jacc.2020.11.010. - DOI - PMC - PubMed
    1. Cecelja M, and Chowienczyk P (2012). Role of arterial stiffness in cardiovascular disease. JRSM Cardiovasc Dis 1. 10.1258/cvd.2012.012016. - DOI - PMC - PubMed
    1. Bertero T, Cottrill KA, Lu Y, Haeger CM, Dieffenbach P, Annis S, Hale A, Bhat B, Kaimal V, Zhang Y-Y, et al. (2015). Matrix Remodeling Promotes Pulmonary Hypertension through Feedback Mechanoactivation of the YAP/TAZ-miR-130/301 Circuit. Cell Rep 13, 1016–1032. 10.1016/j.celrep.2015.09.049. - DOI - PMC - PubMed
    1. Kothapalli D, Liu S-L, Bae YH, Monslow J, Xu T, Hawthorne EA, Byfield FJ, Castagnino P, Rao S, Rader DJ, et al. (2012). Cardiovascular protection by apoE and apoE-HDL linked to suppression of ECM gene expression and arterial stiffening. Cell Rep 2, 1259–1271. 10.1016/j.celrep.2012.09.018. - DOI - PMC - PubMed
    1. Zhang H, Wang D, Li M, Plecitá-Hlavatá L, D’Alessandro A, Tauber J, Riddle S, Kumar S, Flockton A, McKeon BA, et al. (2017). Metabolic and Proliferative State of Vascular Adventitial Fibroblasts in Pulmonary Hypertension Is Regulated Through a MicroRNA-124/PTBP1 (Polypyrimidine Tract Binding Protein 1)/Pyruvate Kinase Muscle Axis. Circulation 136, 2468–2485. 10.1161/CIRCULATIONAHA.117.028069. - DOI - PMC - PubMed

LinkOut - more resources