. 2024 May 14;19(5):710-728.
doi: 10.1016/j.stemcr.2024.04.005. Epub 2024 May 2.

H1FOO-DD promotes efficiency and uniformity in reprogramming to naive pluripotency

Affiliations

H1FOO-DD promotes efficiency and uniformity in reprogramming to naive pluripotency

Akira Kunitomi et al. Stem Cell Reports. .

Abstract

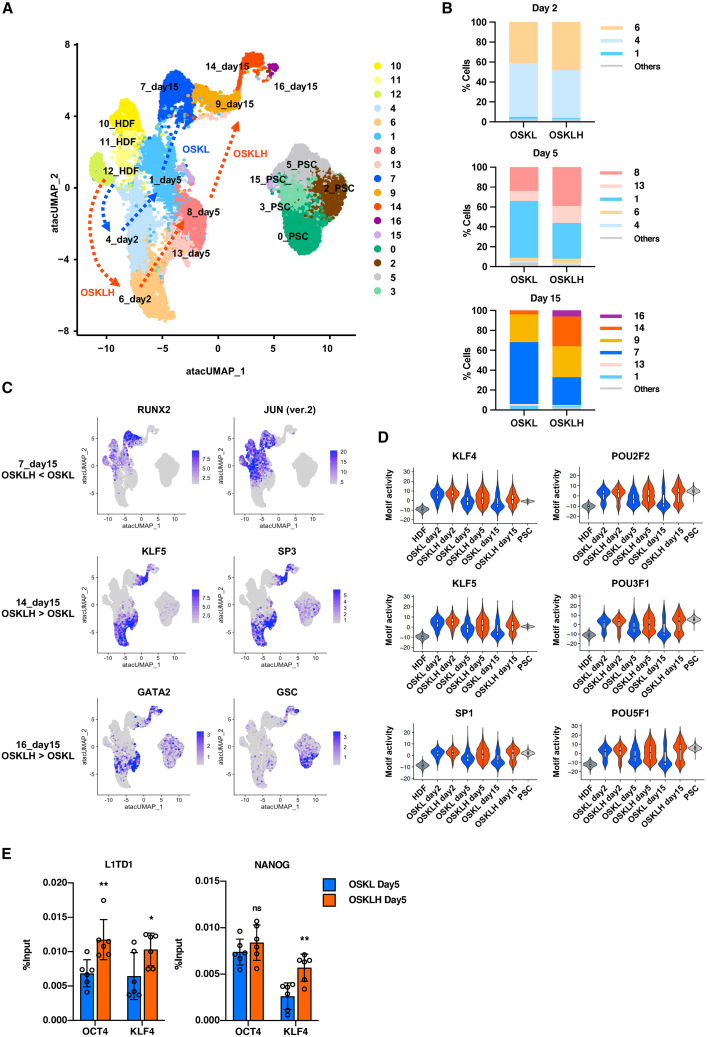
Heterogeneity among both primed and naive pluripotent stem cell lines remains a major unresolved problem. Here we show that expressing the maternal-specific linker histone H1FOO fused to a destabilizing domain (H1FOO-DD), together with OCT4, SOX2, KLF4, and LMYC, in human somatic cells improves the quality of reprogramming to both primed and naive pluripotency. H1FOO-DD expression was associated with altered chromatin accessibility around pluripotency genes and with suppression of the innate immune response. Notably, H1FOO-DD generates naive induced pluripotent stem cells with lower variation in transcriptome and methylome among clones and a more uniform and superior differentiation potency. Furthermore, we elucidated that upregulation of FKBP1A, driven by these five factors, plays a key role in H1FOO-DD-mediated reprogramming.

Keywords: FKBP1A; H1FOO; Sendai virus vector; destabilized domain; heterogeneity; induced pluripotent stem cell; innate immune response; naive pluripotency; primed pluripotency; reprogramming.


Conflict of interest statement

Declaration of interests A.K. and K.F. are co-inventors on a patent describing the method for producing human iPSCs from somatic cells using H1FOO-DD. K.F. is a co-founder and CEO of Heartseed Inc., and S.T., S. Yuasa, and K.F. own equity in Heartseed Inc. S.T. is an advisor of Heartseed Inc. J.K. and H.H. are employees and K.K. is a board member of ID Pharma Co., Ltd., without compensation relating to this study. S. Yamanaka is a scientific advisor to iPS Academia Japan without salary.

Figures

None
Graphical abstract
Figure 1
Figure 1
H1FOO-DD enhances reprogramming into primed pluripotency (A) qPCR analysis of H1FOO expression in HDFs, HDFs during reprogramming and H9 ESCs. Data are shown as the mean ± SD. n = 3. ND: not determined. (B) Schematic structure of the SeV-H1FOO vector and the modified vectors. We created vectors in which DD is added to the 5′ side (H1FOO-DD) or 3′ side (DD-H1FOO) of H1FOO for this study. (C) Representative phase-contrast image and immunofluorescent staining for H1FOO of HDFs at day 5 post SeV-H1FOO-DD infection. Scale bar, 50 μm. (D) Protein expression analysis of H1FOO-DD with Shield1 or without Shield1 by western blotting. Two days after the SeV vectors infection, cell culture temperature was raised from 35°C to 37°C to remove the SeV vectors. Three days after raising the temperature, 1 μM of Shield1 was added and the cells were collected the next day. We quantified the expression level of H1FOO-DD with GAPDH protein expression. Data are shown as the mean ± SD. n = 3. p < 0.05. (E) Sequential protein expression analysis of H1FOO and H1FOO-DD by western blotting after the SeV-H1FOO or SeV-H1FOO-DD vector infection. We quantified the expression level of H1FOO and H1FOO-DD with GAPDH protein expression. Data are shown as the mean ± SD. n = 3. p < 0.05, ∗∗∗p < 0.001. (F) Number of alkaline phosphatase (AP)-positive primed human iPSC colonies generated from HDFs at day 14. Each of the linker histone H1 related vectors were co-infected with SeV-OSKL. Data are shown as the mean ± SD. n = 3. p < 0.05. (G) Number of AP-positive primed human iPSC colonies generated from HDFs and PBMC at day 14. We used CytoTune-EX-iPS vector for reprogramming in this experiment. Data are shown as the mean ± SD. n = 3. p < 0.05.
Figure 2
Figure 2
Single-cell RNA-seq analysis of the reprogramming process to iPSCs (A) UMAP of single-cell RNA-seq analysis. Dashed arrows indicate the reprogramming process inferred to be followed by the majority of SeV-OSKL- or SeV-OSKLH-infected HDFs. (B) Percentage of cells in each cluster at day 5 and day 15 after SeV infection. (C) Feature plot of representative marker gene expression in the UMAP. (D) Dot plot of representative marker gene expression by cluster. The color of the dot indicates the average expression of the gene, and the size of the dot indicates the percentage of cells in which the gene is expressed. (E) Dot plot of representative marker gene expression by cell type.
Figure 3
Figure 3
Single-cell ATAC-seq analysis of the reprogramming process to iPSCs (A) UMAP of single-cell ATAC-seq analysis. Dashed arrows indicate the reprogramming process inferred to be followed by the majority of SeV-OSKL- or SeV-OSKLH-infected HDFs. (B) Percentage of cells in each cluster at day 2, day 5, and day 15 after SeV infection. (C) Feature plot of representative motif in #7, #14, and #16 in the UMAP. (D) Violin plot of KLF/SP and POU family motif activity level in each cell group. (E) ChIP-qPCR analysis of L1TD1 and NANOG immunoprecipitated with OCT4 or KLF4. Data are shown as the mean ± SD. n = 6. p < 0.05, ∗∗p < 0.01.
Figure 4
Figure 4
FKBP1A suppresses innate immune responses and promotes reprogramming (A) Upregulated and downregulated DEGs of bulk RNA-seq analysis comparing SeV-OSKL-infected group to SeV-OSKLH-infected group at day 1, 2, and 5. (B) qPCR analysis of FKBP1A expression in PSC and several conditions of HDF. Data are shown as the mean ± SD. n = 3. ∗∗∗∗p < 0.0001. (C) Quantification of EpCAM and ANPEP expression in HDFs during reprogramming at day 15 by flow cytometry. Data are shown as the mean ± SD. n = 3. ∗∗∗∗p < 0.0001. (D) qPCR analysis of innate immune response-related marker gene expression during reprogramming at day 5 and day 15. Data are shown as the mean ± SD. n = 3. p < 0.05, ∗∗p < 0.01, ∗∗∗p < 0.001, ∗∗∗∗p < 0.0001. (E) Quantification of Annexin V and DAPI expression in HDFs during reprogramming at day 5 and day 15 by flow cytometry. Data are shown as the mean ± SD. n = 3. p < 0.05, ∗∗p < 0.01, ∗∗∗p < 0.001, ∗∗∗∗p < 0.0001.
Figure 5
Figure 5
Excessive innate immune response deteriorates reprogramming (A) Number of AP-positive primed human iPSC colonies generated from HDFs at day 14. Each HDF was infected with SeV-Mock in addition to OSKL MOI = 15 except for MOI 15 condition. Data are shown as the mean ± SD. n = 4. ∗∗p < 0.01, ∗∗∗∗p < 0.0001. (B) qPCR analysis of innate immune response-related inflammation marker gene expression in each condition at day 14. Data are shown as the mean ± SD. n = 3. p < 0.05, ∗∗∗p < 0.001, ∗∗∗∗p < 0.0001. (C) qPCR analysis of SeV genome expression in generated iPSC clones at p20 (day 160). Data are shown as the mean ± SD. n = 3 for each clone. ND, not detected even after 40 amplification cycles. (D) qPCR analysis of innate immune response-related inflammation marker gene expression in each condition at p20 (day 160). Data are shown as the mean ± SD. n = 3 for each clone. (E) Number of genes with MAE >2.0 in clones in the MOI 15 and MOI 75 groups in RNA-seq. (F) Number of genes with MAE >2.0 in clones in the MOI 15 and MOI 75 groups in DNA methylation array. (G) Dot plot of algorithmic scores generated by Scorecard analysis based on 96 genes expression per sample. n = 1 of each point.
Figure 6
Figure 6
H1FOO-DD enhances reprogramming into naive pluripotency (A) Representative phase-contrast images of naive iPSCs reprogrammed with SeV-OSKL or SeV-OSKLH on iMEF feeder cells (p14). Scale bars, 200 μm. (B) Comparison of AP-positive naive human iPSC colonies generated from HDFs or PBMCs at day 14. Data are shown as the mean ± SD. n = 4. ∗∗p < 0.01, ∗∗∗∗p < 0.0001. (C) Number of genes with MAE >2.0 in clones of nOSKL-iPSCs and nOSKLH-iPSCs in RNA-seq. (D) Number of genes with MAE >2.0 in clones of nOSKL-iPSCs and nOSKLH-iPSCs in DNA methylation array. (E) Spare respiratory capacity of 6 clones each of nOSKL-iPSCs and nOSKLH-iPSCs analyzed by Seahorse. n = 1 of each point and n = 6 for each clone. p < 0.05. (F) Metabolic profiles showing ECAR and OCR under FCCP-induced respiration measured at 50 min in the Seahorse analysis shown in Figure S5E. Each point shows the average of n = 6 for each clone. (G) Quantification of the RNA fluorescence in situ hybridization patterns for XIST with HUWE1 in cells with bi-allelic UTX expression. 100 cells were analyzed in each cell line. (H) Representative phase-contrast images of primed H9 ESC and nOSKLH-iPSC-derived differentiated cells on day 3 after trophectoderm induction. Scale bars, 400 μm. (I) Percentage of TACSTD2+HAVCR1+ cells differentiated from primed H9 ESCs (H9), nOSKL-iPSCs, and nOSKLH-iPSCs analyzed by flow cytometry. Data are shown as the mean ± SD. n = 3. ∗∗∗∗p < 0.0001.

References

    1. Akifuji C., Iwasaki M., Kawahara Y., Sakurai C., Cheng Y.S., Imai T., Nakagawa M. MYCL promotes iPSC-like colony formation via MYC Box 0 and 2 domains. Sci. Rep. 2021;11 - PMC - PubMed
    1. Banaszynski L.A., Chen L.C., Maynard-Smith L.A., Ooi A.G.L., Wandless T.J. A rapid, reversible, and tunable method to regulate protein function in living cells using synthetic small molecules. Cell. 2006;126:995–1004. - PMC - PubMed
    1. Bredenkamp N., Yang J., Clarke J., Stirparo G.G., von Meyenn F., Dietmann S., Baker D., Drummond R., Ren Y., Li D., et al. Wnt Inhibition Facilitates RNA-Mediated Reprogramming of Human Somatic Cells to Naive Pluripotency. Stem Cell Rep. 2019;13:1083–1098. - PMC - PubMed
    1. Chen Y.G., Liu F., Massague J. Mechanism of TGFbeta receptor inhibition by FKBP12. EMBO J. 1997;16:3866–3876. - PMC - PubMed
    1. Diebold S.S., Kaisho T., Hemmi H., Akira S., Reis e Sousa C. Innate antiviral responses by means of TLR7-mediated recognition of single-stranded RNA. Science (New York, NY) 2004;303:1529–1531. - PubMed

Publication types

MeSH terms