. 2024 May 9;187(10):2465-2484.e22.
doi: 10.1016/j.cell.2024.04.005. Epub 2024 May 2.

Small-molecule-induced epigenetic rejuvenation promotes SREBP condensation and overcomes barriers to CNS myelin regeneration

Affiliations

Small-molecule-induced epigenetic rejuvenation promotes SREBP condensation and overcomes barriers to CNS myelin regeneration

Xuezhao Liu et al. Cell. .

Abstract

Remyelination failure in diseases like multiple sclerosis (MS) was thought to involve suppressed maturation of oligodendrocyte precursors; however, oligodendrocytes are present in MS lesions yet lack myelin production. We found that oligodendrocytes in the lesions are epigenetically silenced. Developing a transgenic reporter labeling differentiated oligodendrocytes for phenotypic screening, we identified a small-molecule epigenetic-silencing-inhibitor (ESI1) that enhances myelin production and ensheathment. ESI1 promotes remyelination in animal models of demyelination and enables de novo myelinogenesis on regenerated CNS axons. ESI1 treatment lengthened myelin sheaths in human iPSC-derived organoids and augmented (re)myelination in aged mice while reversing age-related cognitive decline. Multi-omics revealed that ESI1 induces an active chromatin landscape that activates myelinogenic pathways and reprograms metabolism. Notably, ESI1 triggered nuclear condensate formation of master lipid-metabolic regulators SREBP1/2, concentrating transcriptional co-activators to drive lipid/cholesterol biosynthesis. Our study highlights the potential of targeting epigenetic silencing to enable CNS myelin regeneration in demyelinating diseases and aging.

Keywords: Epigenetic silencing; HDAC3 Inhibition; SREBP condensation; aging; chromatin remodeling; lipid/cholesterol biosynthesis; multiple sclerosis; myelin regeneration; oligodendrocyte; small molecule.


Conflict of interest statement

Declaration of interests The authors declare no competing interests.

Figures

Figure 1.
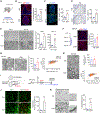
Figure 1.. OLs within MS lesions are epigenetically silenced.
(A) Schematic diagram of MS brain. (B) Left: NAWM and MS lesion immunostained for MBP and OLIG2. Arrow, lesion site. Right: Numbers of OLIG2+ cells. n=9 MS patients. (C) MS lesion stained for MBP, CC1, and OLIG2. Arrow, OLIG2+ cell. (D) Left: NAWM and MS lesion stained for H3K27ac, CC1, and MBP. Magnified images show CC1+ OLs (arrows) co-labeled with MBP and H3K27ac. Right: Percentage of H3K27ac+ cells among CC1+ cells (n=9 MS patients). (E) Left: NAWM and MS lesion stained for indicated markers. Arrow, CC1+ cell. Right: Percentages of H3K27me3high and H3K9me3high cells among CC1+ cells. (F) Schematic of the epigenetic silencing barrier to OL myelin production. Data are means ± SEM. ***p<0.001; Student’s t test. Scale bars: B) 100 μm; C,E) 20 μm; D) low- (20 μm) or high-power (5 μm). See also Figure S1 and Table S1.
Figure 2.
Figure 2.. Epigenetic-targeting compound ESI1 enhances myelin production.
(A) Upper: Schematic of screen. Lower: Immunostains for the corpus callosum from CNP-Luc mice at P14. Arrows, Luc/OLIG1+ cells. Arrowhead, PDGFRα+ cells. (B) Relative luciferase activity in OLs treated with the five most active compounds in the library. (C) Western blot of vehicle- and compound-treated pre-OLs. (D) Immunostains for pre-OLs treated as indicated. (E) Percentages of MBP+ cells after indicated treatment. n=6 experiments. (F) Images (left) and quantification (right) of MBP+ cells in pre-OLs seeded on microfibers and treated with vehicle (Veh), T3, or ESI1 (n=4 experiments). (G) Images (left) and quantification (right) of myelin length of MBP+ cells in co-cultures. (H) Schematic of time course of ESI1 administration and analysis. (I-K) MBP immunostaining (I), Plp1 mRNA (J) and quantification (K) in the cortices from mice treated with Veh or ESI1. n=4 animals/group. Data are means ± SEM. *p<0.05, **p<0.01, ***p<0.001; one-way ANOVA followed by Holm-Sidak’s multiple comparisons test in E-G. Student’s t test in K. Scale bars, A) 20 μm; D, F, I, J), 100 μm; G) 50 μm. See also Figure S1.
Figure 3.
Figure 3.. ESI1 promotes remyelination after LPC-induced demyelination and optic nerve crush.
(A) Schematic depicting LPC-induced demyelination model. (B-D) Left: Representative images of LPC lesions immunostained for B) MBP, C) CC1, or D) Plp1 mRNA in vehicle- or ESI1-treated mice at Dpl 7. Dashed line indicates lesion site. Right panels: Quantification as indicated. n=5 animals/group. (E) EM images (left) and quantification (right) of spinal LPC lesions in mice treated with vehicle or ESI1 at Dpl 7 and 14. n=3 animals/group. (F) LPC-induced demyelination model (left), LPC lesions immunostained for ASPA at Dpl 21 (middle) and quantification (right). Dashed lines, lesion. n=4 animals/group. (G-H) Left: EM images of LPC lesions at Dpl 21 (G) or Dpl 28 (H) treated with vehicle or ESI1 from Dpl 14. Right: Quantification of myelinated axons (middle) and g-ratio (right). n=4 animals/group. (I) AAV-OIC-induced axon regeneration after optic nerve crush and ESI1 treatment. (J) Images (left) and quantification (right) of optic nerves from vehicle- or ESI1-treated mice immunostained for GST-π and BrdU at day 28 post-crush. Arrows: co-labeling. n=3 animals/group. (K) Left: low- and high-power (inset) EM images of regenerated optic nerves. Right: Percent myelinated axons. n=3 animals/group. Data are means ± SEM. *p<0.05, **p<0.01, ***p<0.001. Student’s t test in B-H, J, K. Scale bars: B-D, F) 100 μm; J) 20 μm; E, G, H) 2 μm; K) low- (2 μm) and high-power (0.5 μm). See also Figure S2–S4.
Figure 4.
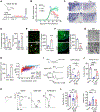
Figure 4.. ESI1 promotes remyelination and functional recovery in EAE mice.
(A) Schematic depicting MOG35–55-induced EAE model. (B) Clinical scores in EAE mice treated with vehicle or ESI1 (10 mg/kg) daily for 10 days at PID 17 (arrow). n=15 animals/group. (C) Images of Mbp and Plp1 mRNAs in lumbar spinal cord lesions (dashed line) at PID 27. (D) Percent demyelinated area (left) and Plp1+ cells/mm2 (right). n=5 animals/group. (E-F) Left: lesion areas of lumbar spinal cords at PID 27 stained for CC1 and OLIG2 (E) or analyzed with FISH for Serpina3n (F). Arrows, labeling cells. Right: Quantification. n=5 animals/group. (G-H) EM images (G) of lumbar spinal cord lesions at PID 27 and quantification (H) of remyelinated axons (left) and g-ratio (right). n = 3 animals/group. >100 axons/animal were analyzed. (I) Left: CAPs of naïve mice, vehicle- and ESI1-treated EAE mice. Right: Quantification of CAP amplitude. n=5, 8, and 6 mice, respectively. (J) Performance of naïve, vehicle- and ESI1-treated EAE mice on an accelerating rotarod (4–40 rpm). n=8, 8, and 9 mice, respectively. (K, L) Representative VEP traces (K) and quantification (L) from naïve, vehicle- and ESI1-treated EAE mice. n=13 animals/group. Data are means ± SEM. n.s., not significant, *p<0.05, **p<0.01, ***p<0.001. Student’s t test in B, D-F, H. One-way ANOVA followed by Holm-Sidak’s multiple comparisons test in I, J. L. Scale bars: C, F) 100 μm; E) 20 μm; G) 2 μm. See also Figures S2–S4.
Figure 5.
Figure 5.. ESI1 induces SREBP nuclear condensation to promote lipid/cholesterol biosynthesis.
(A) Left: Volcano plot of differentially-regulated-genes (DEG) in vehicle- (n=2 samples) and ESI1-treated pre-OLs (n=3 samples); fold-change > 2; p<0.05. Right: DEG Heatmap. (B) Left: pathway enrichment. NES, net enrichment score. Right: qRT-PCR analyses. n=3 experiments. (C) Gene regulatory networks upregulated after ESI1 treatment. (D) Sterol metabolic profiling in O4+ OLs treated with vehicle or ESI1. n=3 experiments/timepoint. (E) Left: SREBP-mediated fatty acid/cholesterol biosynthesis. Right: Western blots of SREBP1/2 in Oli-neu cells treated with ESI1. (F) Immunostains of SREBP1/2 in NIH3T3 cells treated with vehicle- or ESI1 for 4h. Arrows, nuclear condensates. (G) GFP localization in vehicle- or ESI1-treated HEK293T cells expressing nSREBP1-GFP or nSREBP2-GFP. Arrows, nuclear condensates. (H) nSREBP1-GFP (upper) or nSREBP2-GFP (lower) expression in HEK293T cells treated vehicle or ESI1 and immunostained for MED1 or RNAPII. Arrows, co-labeled cells. (I) Images of O4+ OLs treated with vehicle or ESI1 and immunostained with indicated markers. High-magnification images show co-labeled condensates (arrows). (J) qRT-PCR of O4+ OLs treated with vehicle or ESI1 for 48 h. n=3 experiments. (K) Western blots for acetylated SREBP1 or SREBP2 after treatment. (L) Nuclear localization of wild-type or mutant SREBP1/2-GFP. Arrows, nuclear condensates. (M) Expression of lipid and cholesterol genes in cells expressing wild-type and mutant nSREBP1/2. n=3 experiments. Data are means ± SEM. *p<0.05, **p<0.01, ***p<0.001. Student’s t test in B and J. One-way ANOVA in M. Scale bars: F, G, and L) 10 μm; H) 5 μm; I) low-power 10 μm, high-power 1 μm. See also Figure S5 and Table S2.
Figure 6.
Figure 6.. ESI1 treatment establishes active epigenome for myelinogenesis.
(A) CUT&RUN-seq signals for indicated marks around peak centers from Veh- and ESI1-treated O4+ OLs. (B) Venn diagram of H3K27ac-targeted loci and differentially expressed genes (DEGs). (C) Gene ontology of the intersected H3K27ac-targeted genes and DEGs. (D) Transcription factor motifs identified in H3K27ac-targeted elements after ESI1 treatment. (E) Signal intensities of TCF7L2 and SOX10 peaks relative to H3K27ac peaks. (F) Super-enhancer enrichment profile from vehicle- and ESI1-treated pre-OLs. (G) Top-ranking super-enhancer loci of transcriptional regulators in ESI1-treated pre-OLs. (H) Long-range chromatin interactions (H3K27ac HiChIP 3D) at indicated gene loci in vehicle- or ESI1-treated pre-OLs. HiChIP (1D), normalized HiChIP short-range reads. (I) qRT-PCR of MBP and MAG in human OPCs treated with vehicle or ESI1. n=3 experiments. (J and K) MBP immunostain (J) and quantification (K) of MBP+ myelinating OLs in human myelinoids treated with vehicle or ESI1. Scale bar, 50 μm. (L) Average sheath lengths from OLs (left) and length distribution of myelin sheaths (right) in vehicle- and ESI1-treated myelinoids. Each data point is one OL. n=8 myelinoids/group. Data are means ± SEM. n.s., not significant, **p<0.01, ***p<0.001. Student’s t test in I, K, L. See also Figure S6.
Figure 7.
Figure 7.. ESI1 enhances (re)myelination in aged mice and reverses age-related cognitive deficits.
(A) Images (left) and quantification (right) of MBP+ area in the superficial cortex (layers I-III) and hippocampus of mice treated with vehicle or ESI1 from 18 to 19 months of age. Arrows, cortex or hippocampus regions. n=3 mice/group. (B) Schematic of experiment (left), images (middle), and quantification (right) in the hippocampus of aged mice treated with vehicle or ESI1. Arrows, GSTπ+/tdTomato+ cells. n=3 mice/group. (C) Diagram of the Morris water maze test. (D-H) Measures of D) routes to hidden platform, E) latencies, F) swimming speed, G) routes after platform removal, and H) average travel distance, the number of platform crossings, and time spent in the target quadrant in Morris water maze test of vehicle- or ESI1-treated aged mice. n=8 mice/group. (I) LPC-induced demyelination in the spinal white matter of aged mice (18M). (J) Images of LPC lesions (dashed line) immunostained for indicated markers in vehicle- or ESI1-treated aged mice at Dpl 21. (K) MBP+ remyelinating area (left) and number of H3K27ac+ or GST-π+ cells (right). n=5 animals/group. (L) EM images (left) and percent myelinated axons (right) in the lesions of aged mice treated with vehicle or ESI1. n=3 animals/group. Data are means ± SEM. n.s., not significant, *p<0.05, **p<0.01, and ***p<0.001. Student’s t test in A, B, E, F, H, K, and L. Two-way repeated ANOVA in E and F. Scale bars: A) 80 μm, B) 50 μm, J) 100 μm, and L) 2 μm. See also Figure S7.

References

    1. Tintore M, Vidal-Jordana A, and Sastre-Garriga J (2019). Treatment of multiple sclerosis - success from bench to bedside. Nature reviews. Neurology 15, 53–58. 10.1038/s41582-018-0082-z. - DOI - PubMed
    1. Stangel M, Kuhlmann T, Matthews PM, and Kilpatrick TJ (2017). Achievements and obstacles of remyelinating therapies in multiple sclerosis. Nature reviews. Neurology 13, 742–754. 10.1038/nrneurol.2017.139. - DOI - PubMed
    1. Blakemore WF, and Franklin RJ (2008). Remyelination in experimental models of toxin-induced demyelination. Curr Top Microbiol Immunol 318, 193–212. - PubMed
    1. Kuhlmann T, Miron V, Cui Q, Wegner C, Antel J, and Bruck W (2008). Differentiation block of oligodendroglial progenitor cells as a cause for remyelination failure in chronic multiple sclerosis. Brain 131, 1749–1758. 10.1093/brain/awn096. - DOI - PubMed
    1. Jakel S, Agirre E, Mendanha Falcao A, van Bruggen D, Lee KW, Knuesel I, Malhotra D, Ffrench-Constant C, Williams A, and Castelo-Branco G (2019). Altered human oligodendrocyte heterogeneity in multiple sclerosis. Nature 566, 543–547. 10.1038/s41586-019-0903-2. - DOI - PMC - PubMed

Publication types

MeSH terms

Substances