. 2024 May 23;187(11):2817-2837.e31.
doi: 10.1016/j.cell.2024.04.009. Epub 2024 May 3.

FLT3L governs the development of partially overlapping hematopoietic lineages in humans and mice

Mana Momenilandi  1 Romain Lévy  2 Steicy Sobrino  3 Jingwei Li  4 Chantal Lagresle-Peyrou  5 Hossein Esmaeilzadeh  6 Antoine Fayand  7 Corentin Le Floc'h  1 Antoine Guérin  8 Erika Della Mina  8 Debra Shearer  4 Ottavia M Delmonte  9 Ahmad Yatim  10 Kevin Mulder  11 Mathieu Mancini  12 Darawan Rinchai  10 Adeline Denis  13 Anna-Lena Neehus  1 Karla Balogh  4 Sarah Brendle  14 Hassan Rokni-Zadeh  15 Majid Changi-Ashtiani  16 Yoann Seeleuthner  1 Caroline Deswarte  1 Boris Bessot  5 Cassandre Cremades  17 Marie Materna  1 Axel Cederholm  18 Masato Ogishi  10 Quentin Philippot  1 Omer Beganovic  19 Mania Ackermann  20 Margareta Wuyts  21 Taushif Khan  22 Sébastien Fouéré  23 Florian Herms  24 Johan Chanal  25 Boaz Palterer  9 Julie Bruneau  26 Thierry J Molina  26 Stéphanie Leclerc-Mercier  26 Jean-Luc Prétet  27 Leila Youssefian  28 Hassan Vahidnezhad  29 Nima Parvaneh  30 Kristl G Claeys  31 Rik Schrijvers  32 Marine Luka  33 Philippe Pérot  34 Jacques Fourgeaud  35 Céline Nourrisson  36 Philippe Poirier  36 Emmanuelle Jouanguy  37 Stéphanie Boisson-Dupuis  37 Jacinta Bustamante  38 Luigi D Notarangelo  9 Neil Christensen  4 Nils Landegren  39 Laurent Abel  37 Nico Marr  40 Emmanuelle Six  41 David Langlais  42 Tim Waterboer  43 Florent Ginhoux  11 Cindy S Ma  8 Stuart G Tangye  8 Isabelle Meyts  44 Nico Lachmann  20 Jiafen Hu  4 Mohammad Shahrooei  45 Xavier Bossuyt  46 Jean-Laurent Casanova  47 Vivien Béziat  48
Affiliations

FLT3L governs the development of partially overlapping hematopoietic lineages in humans and mice

Mana Momenilandi et al. Cell. .

Abstract

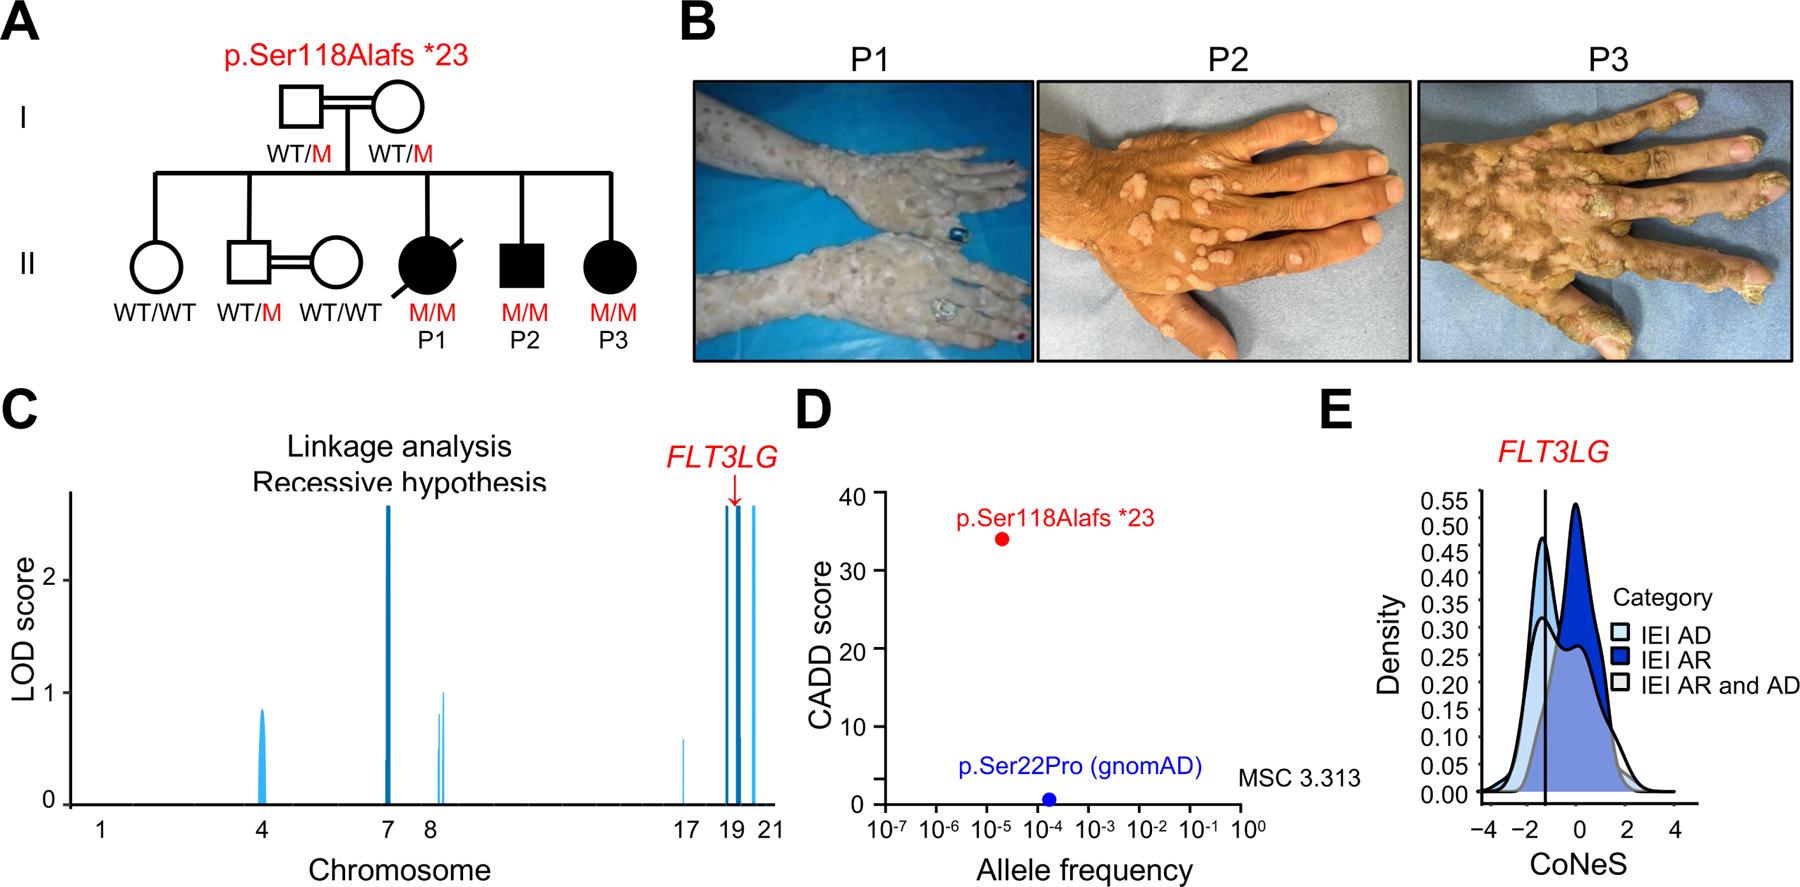
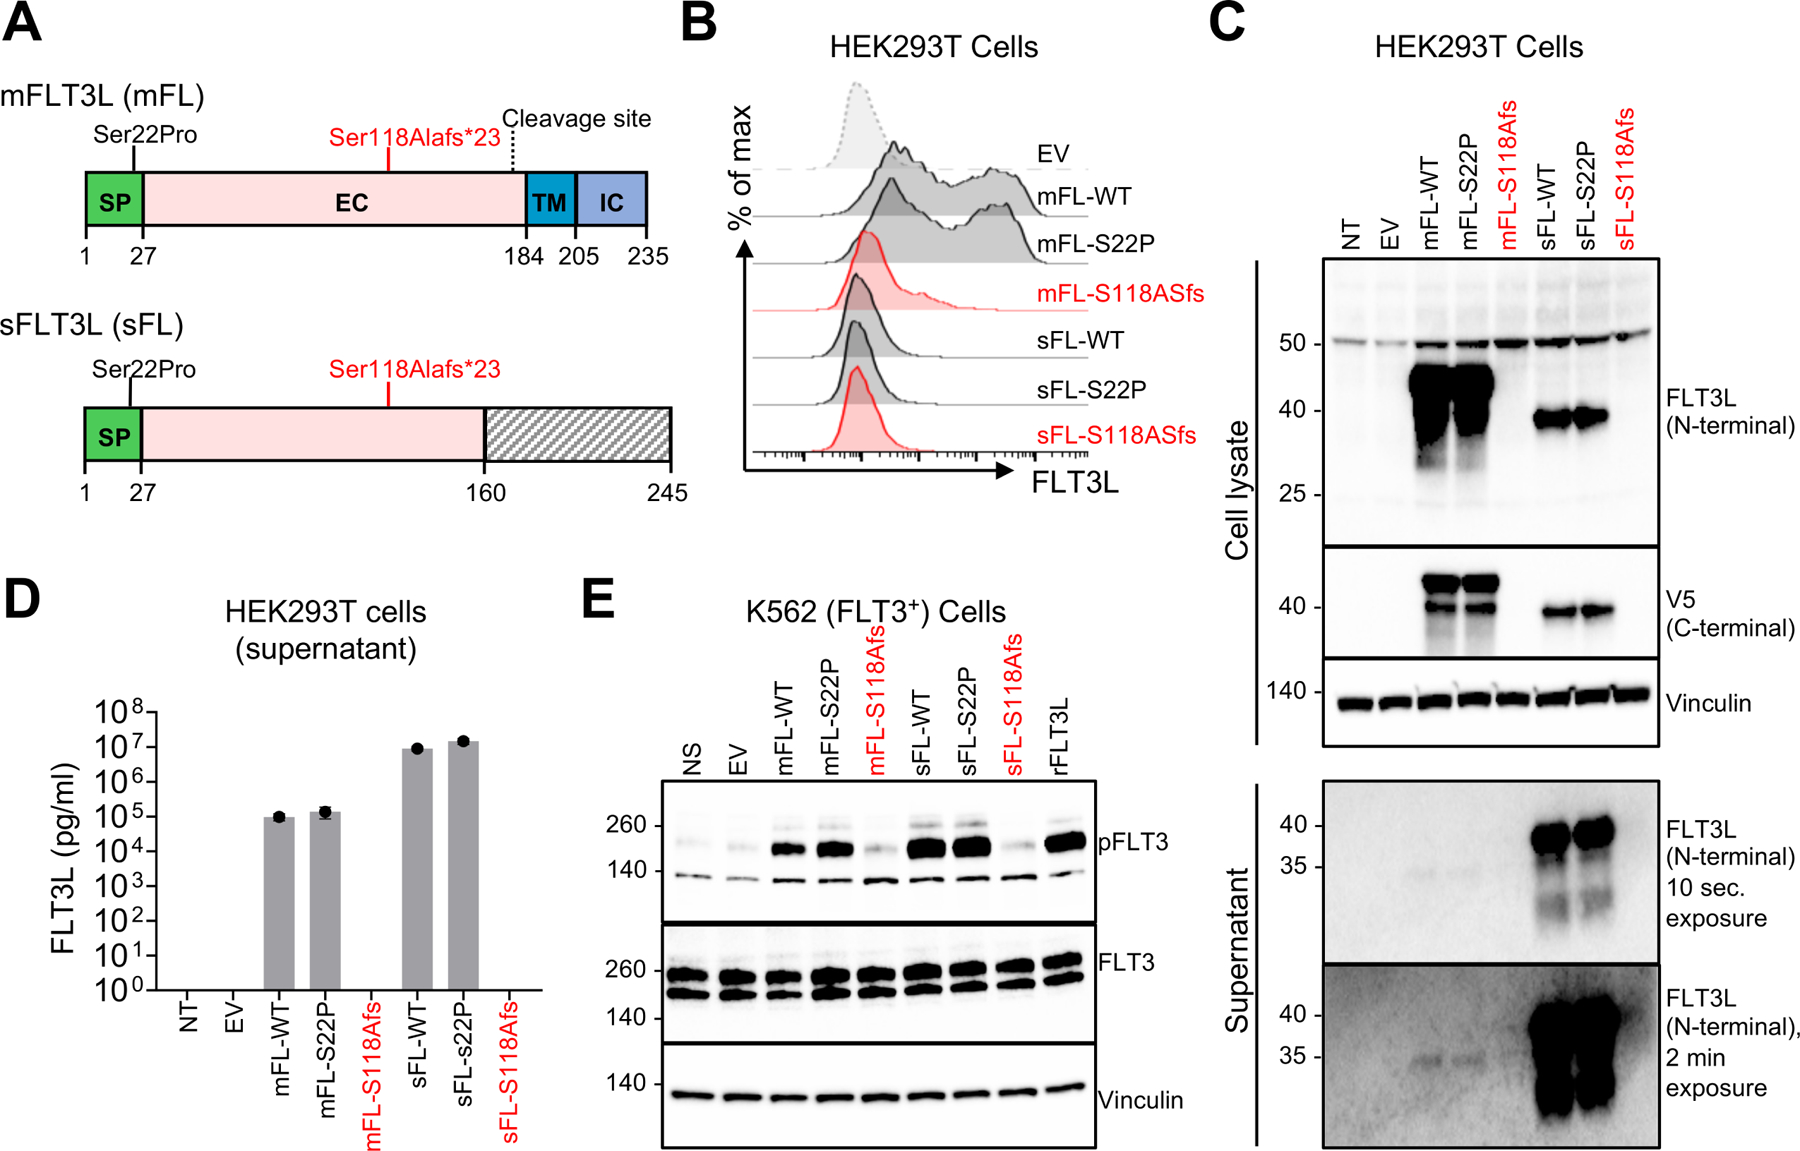
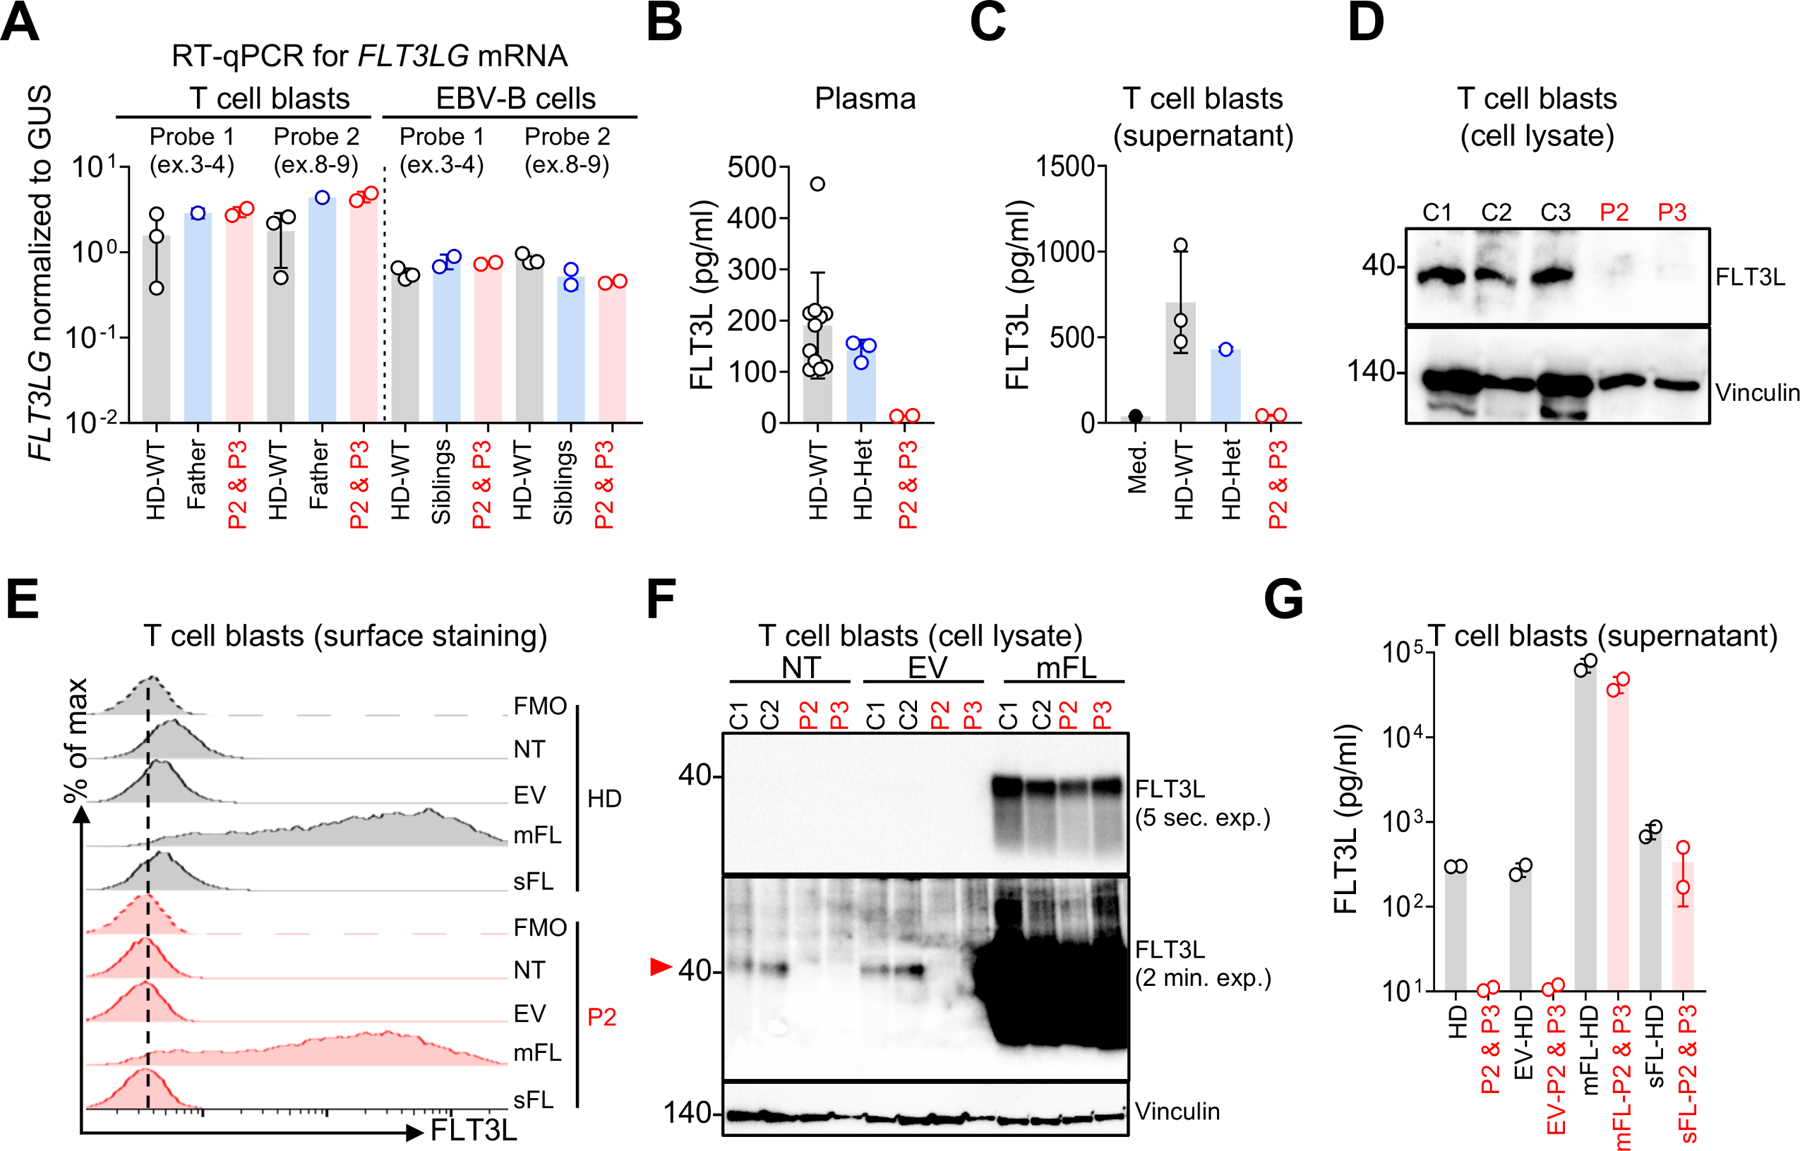
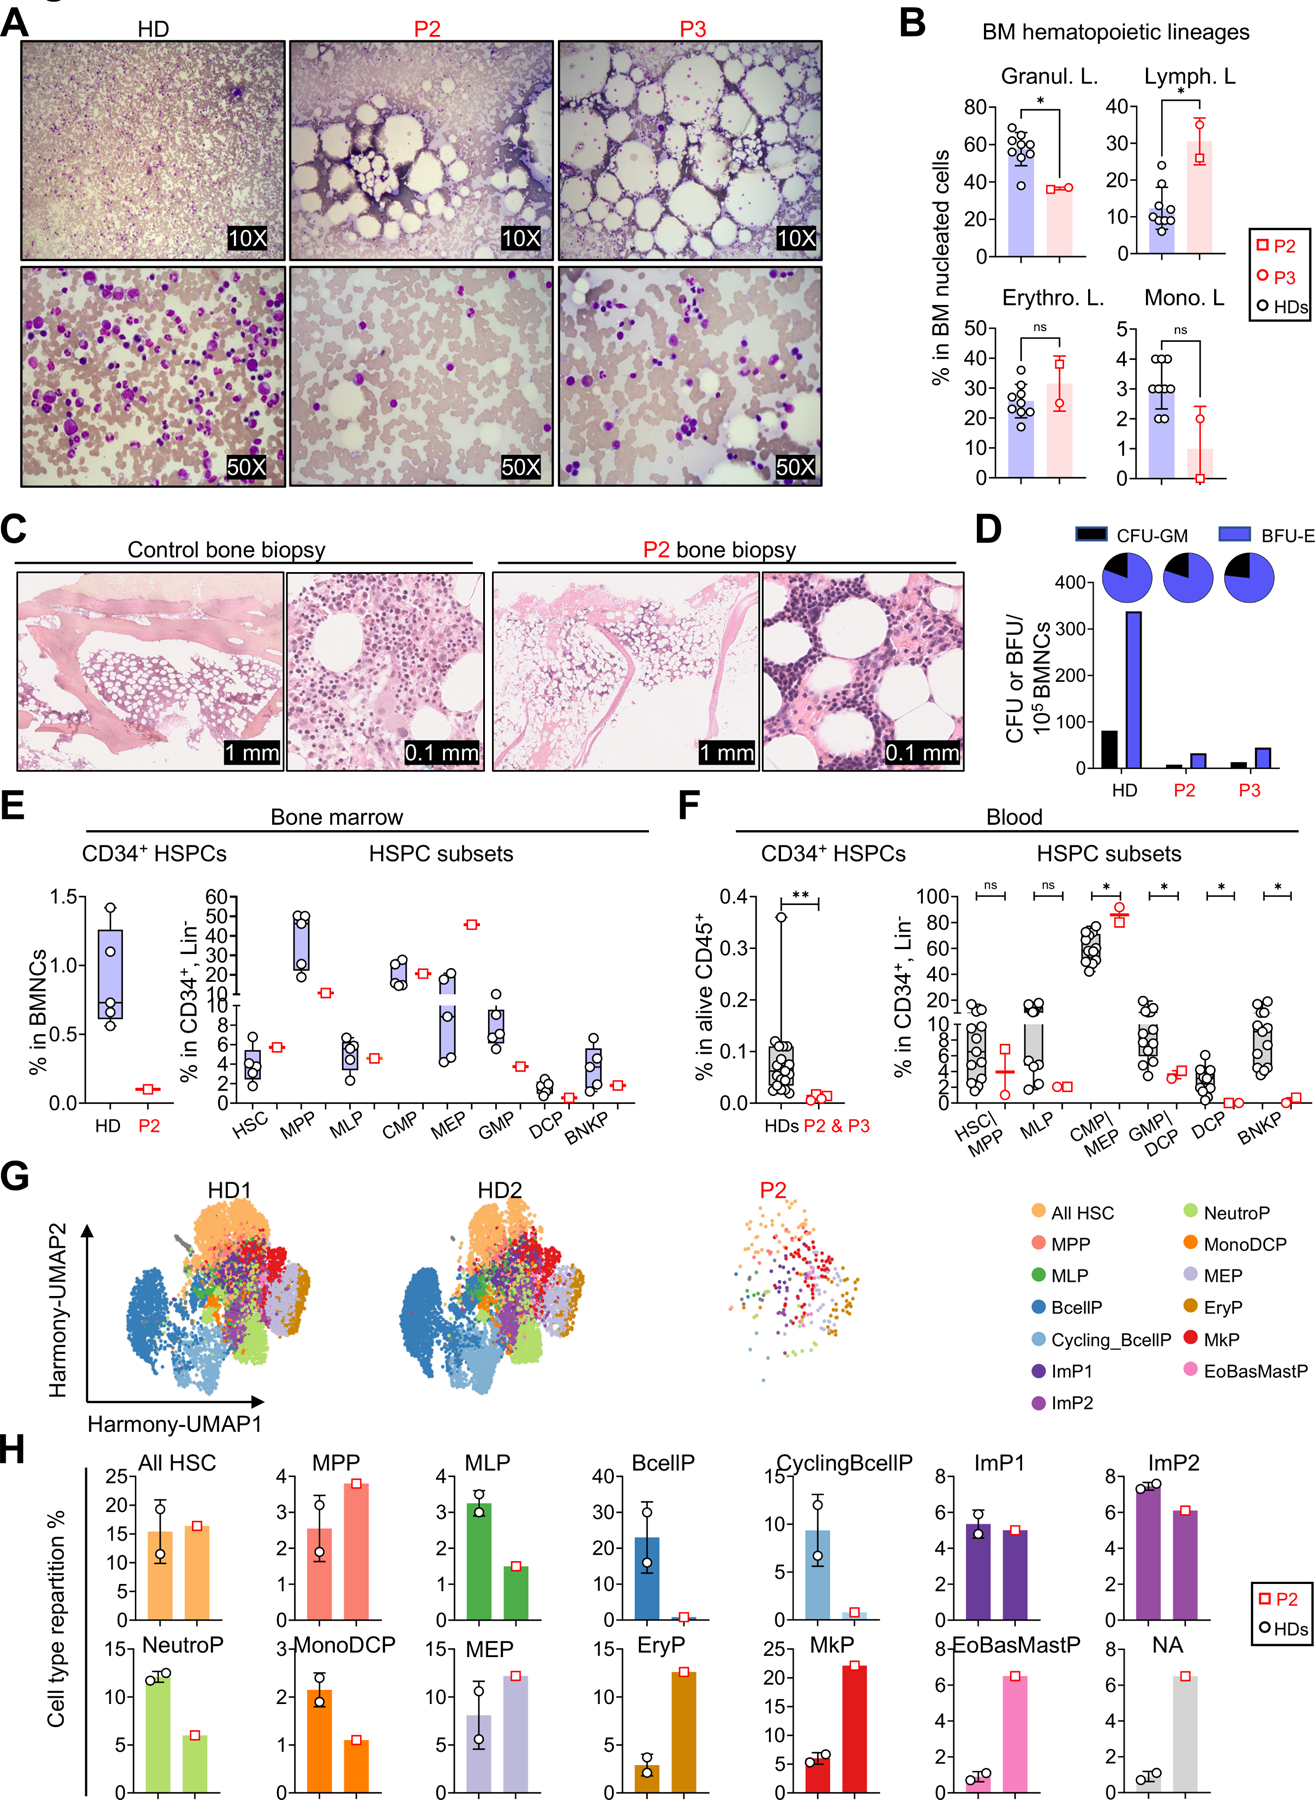
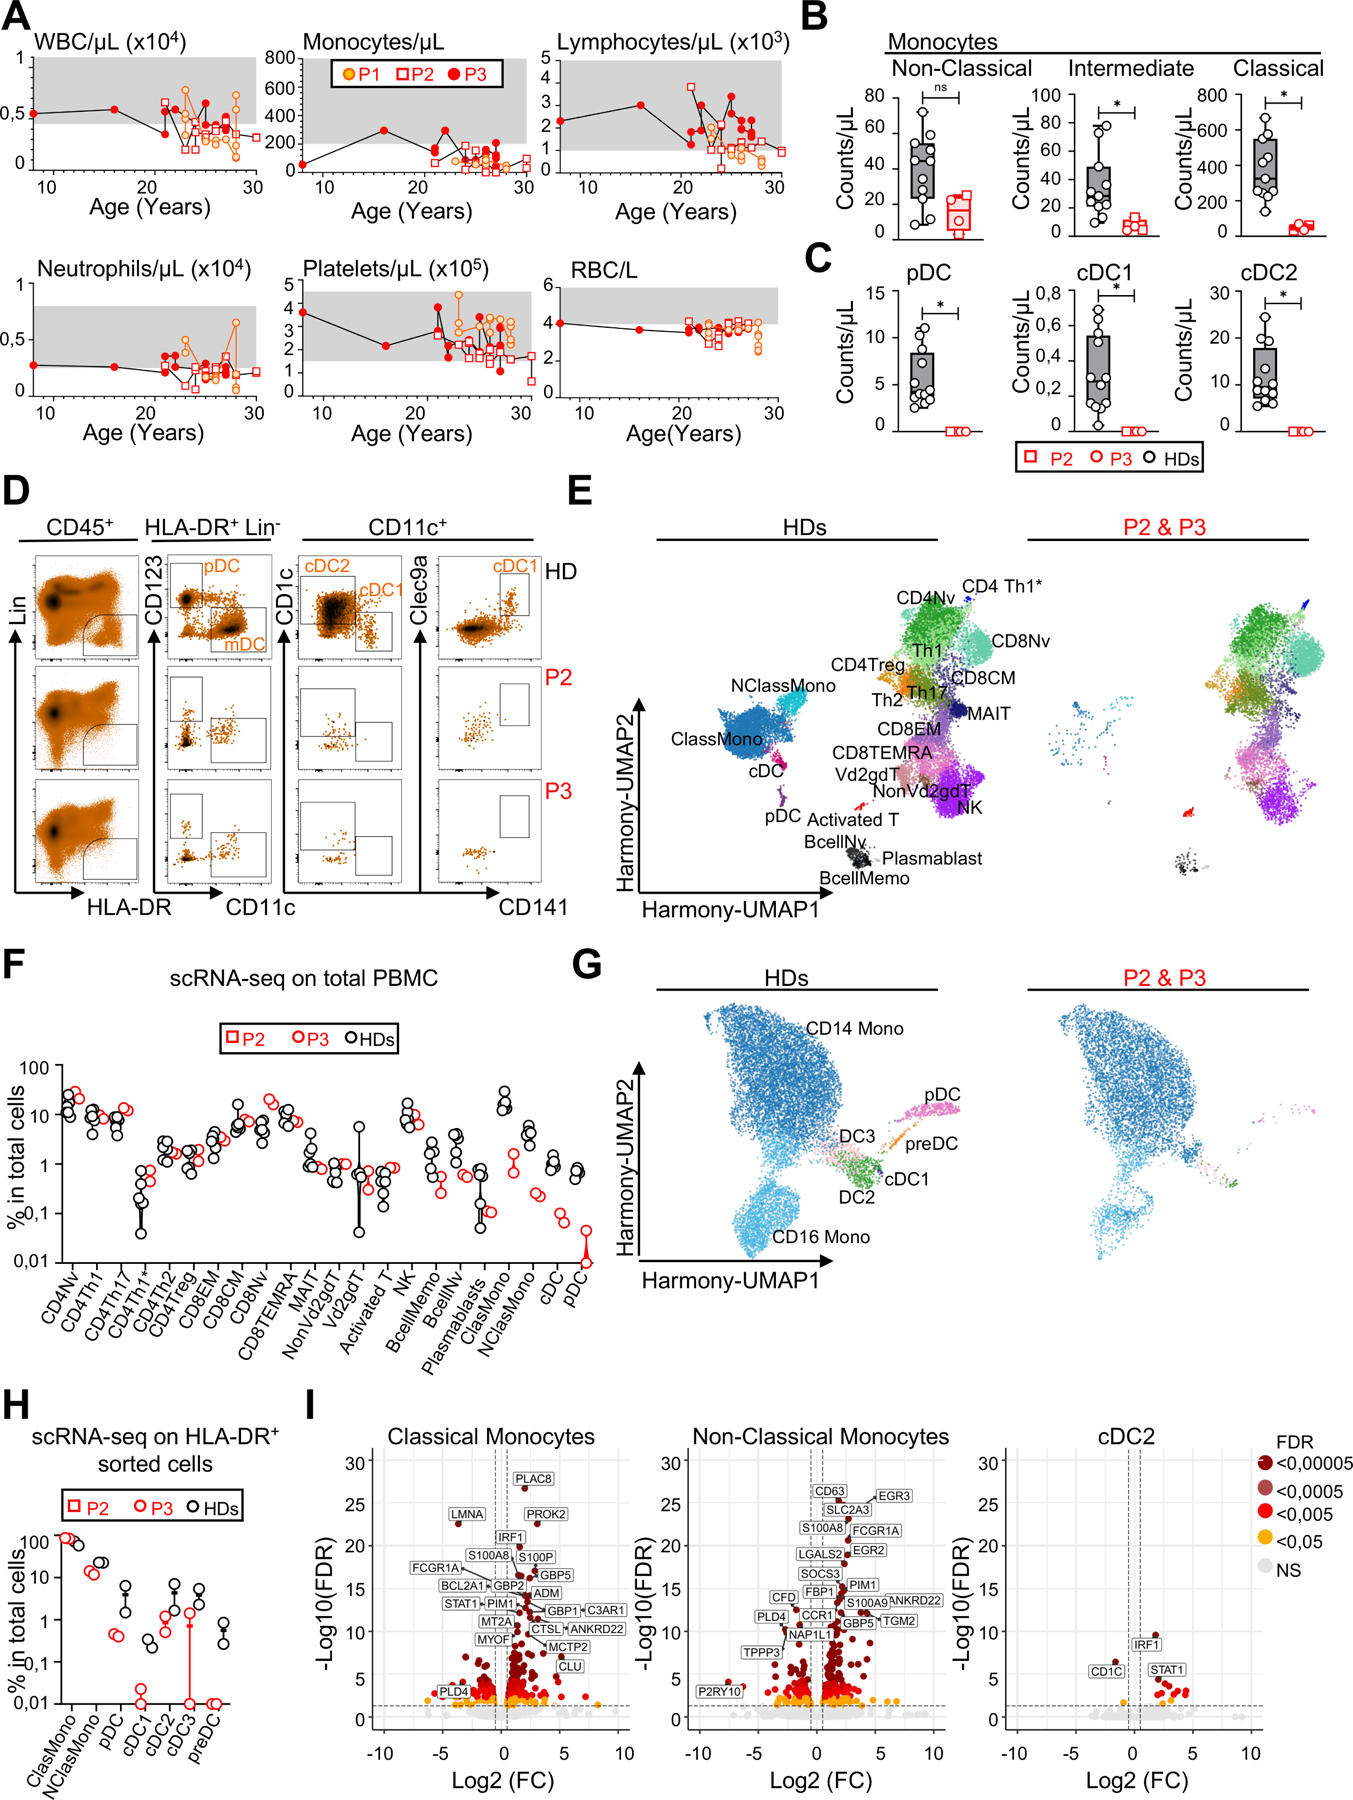
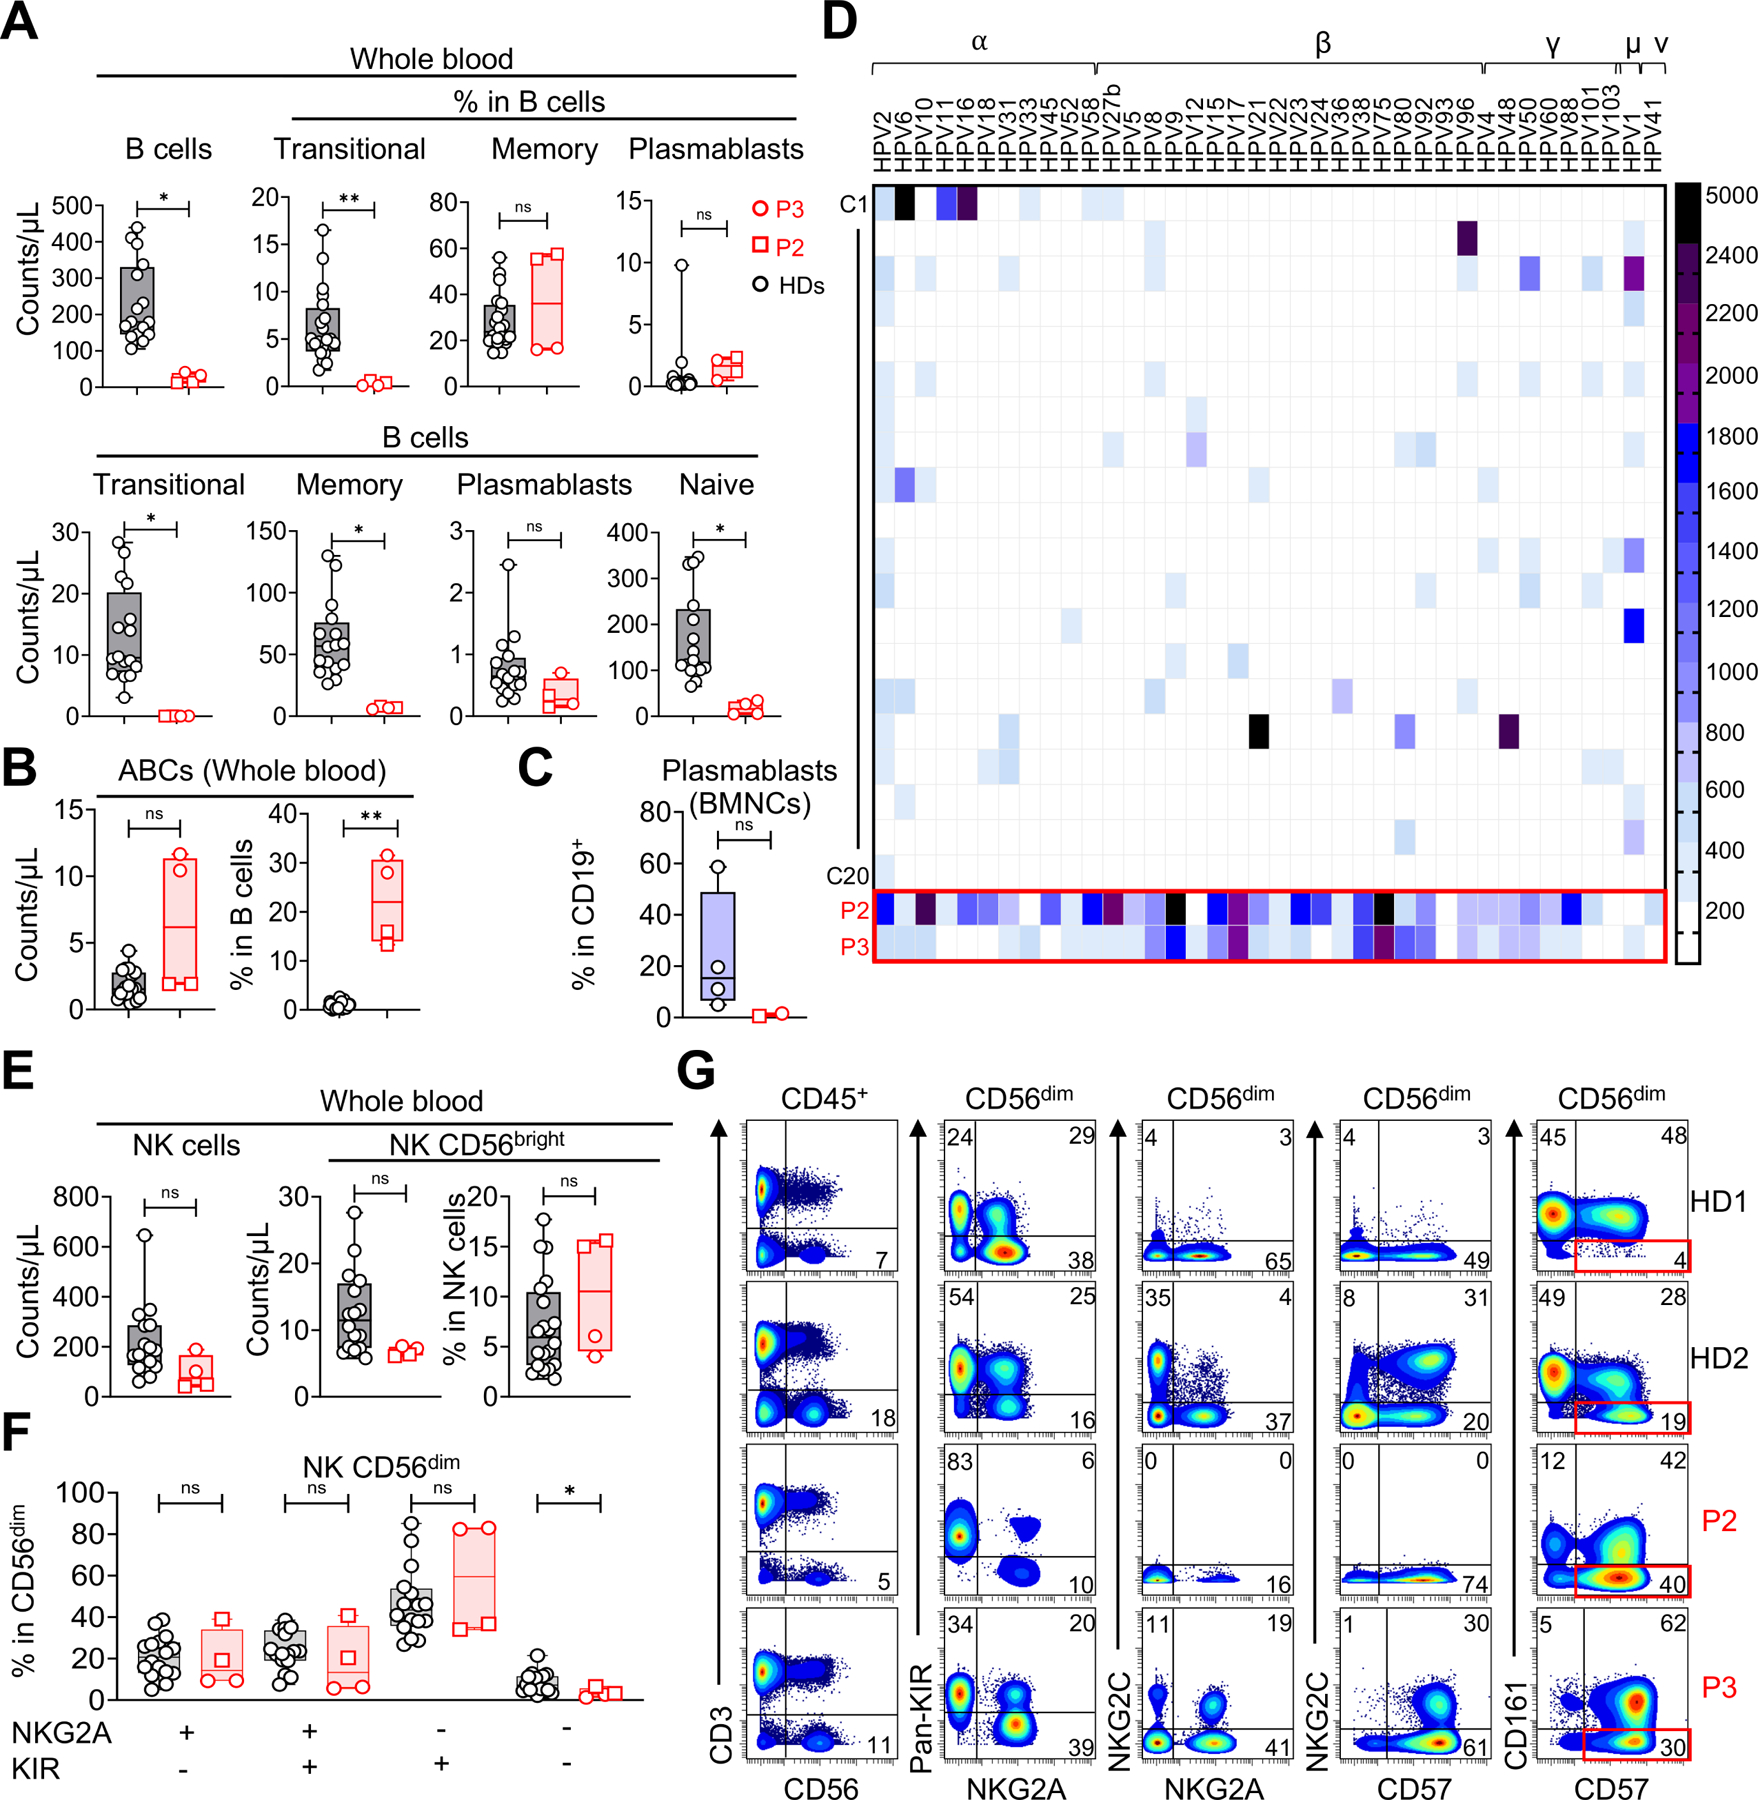
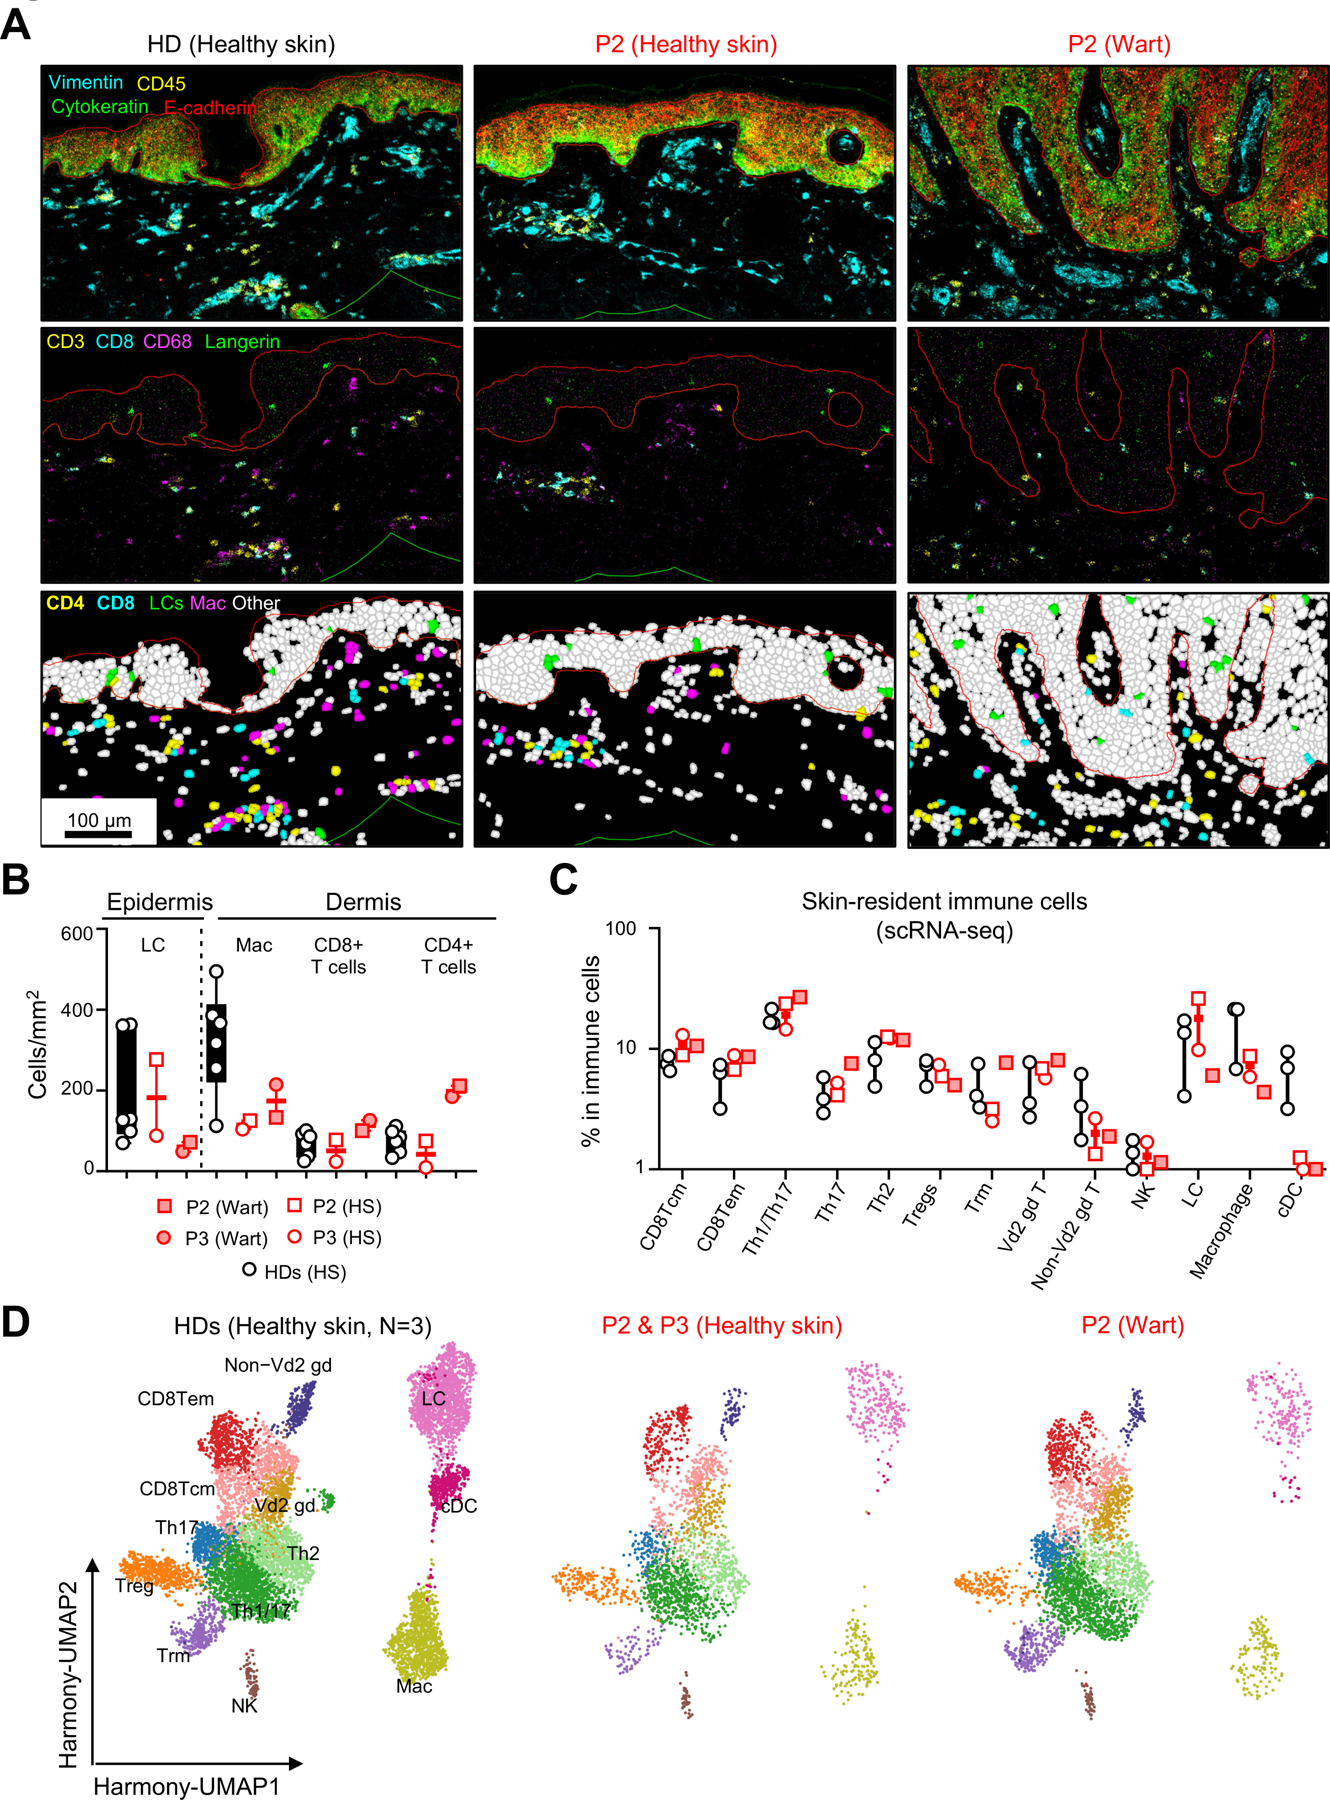
FMS-related tyrosine kinase 3 ligand (FLT3L), encoded by FLT3LG, is a hematopoietic factor essential for the development of natural killer (NK) cells, B cells, and dendritic cells (DCs) in mice. We describe three humans homozygous for a loss-of-function FLT3LG variant with a history of various recurrent infections, including severe cutaneous warts. The patients' bone marrow (BM) was hypoplastic, with low levels of hematopoietic progenitors, particularly myeloid and B cell precursors. Counts of B cells, monocytes, and DCs were low in the patients' blood, whereas the other blood subsets, including NK cells, were affected only moderately, if at all. The patients had normal counts of Langerhans cells (LCs) and dermal macrophages in the skin but lacked dermal DCs. Thus, FLT3L is required for B cell and DC development in mice and humans. However, unlike its murine counterpart, human FLT3L is required for the development of monocytes but not NK cells.

Keywords: B cells; FLT3; FLT3L; FLT3LG; NK cells; dendritic cells; hematopoiesis; human; papillomavirus; primary immunodeficiency.


Conflict of interest statement

Declaration of interests J.-L.C. serves on the scientific advisory boards of ADMA Biologics Inc., Kymera Therapeutics, and Elixiron Immunotherapeutics.

Figures

Figure 1.
Figure 1.. Three patients homozygous for a frameshift FLT3LG variant
(A) Pedigree showing the familial segregation of the c.343delC (p. Ser118Alafs*23) FLT3LG allele. Solid black symbols indicate patients with FLT3L deficiency. Symbols linked with a double line indicate consanguinity. M: mutant, WT: wild type. (B) Cutaneous warts on the hands of P1, P2, and P3. (C) Genome-wide linkage analysis on gDNA from 7 family members, assuming AR inheritance with complete penetrance. All 6 linked regions with a high LOD score are shown in blue and positioned on chromosomes 7, 19, and 20; one of the regions on chromosome 19 included FLT3LG (red arrow). (D) Allele frequency and CADD score for the only FLT3LG variant reported in the homozygous state in public databases (showed in blue). The c.343delC variant is indicated in red. The dotted line corresponds to the mutation significance cutoff (MSC) for FLT3LG. (E) CoNeS score of FLT3LG is consistent with an AR trait. See also Figures S1 and S2.
Figure 2.
Figure 2.. The patients’ FLT3LG mutation is loss-of-expression and loss-of-function in vitro.
(A) Schematic representation of the two functional FLT3L isoforms. The different domains are indicated. The position of the p.Ser118Alafs*23 mutation is indicated in red and that of the p.Ser22Pro mutation is indicated in black. mFLT3L (mFL): membrane-bound FLT3L. sFLT3L (sFL): secreted FLT3L. SP: signal peptide. EC: extracellular domain. TM: transmembrane domain. IC: intracellular domain. (B) Surface FLT3L expression in an overexpression system, as assessed by FACS on HEK293T cells 48 hours after transfection with an empty vector (EV), or a vector encoding the WT sFL or mFL isoform, or the indicated FLT3LG variants. (C) WB analysis of cell-culture supernatants or cell lysates obtained from HEK293T cells, as in B. (D) Soluble FLT3L protein determination by ELISA on the cell-culture supernatant of HEK293T cells, as in B and C. Bars indicate the mean and SD. (E) Phospho-FLT3 (pFLT3) levels in K562 cells transduced with FLT3, as assessed by WB, after 5 minutes stimulation with the supernatant collected from HEK293T cells 48 h after transfection. rhFLT3L was used as a positive control. All the data shown are representative of three independent experiments. See also Figures S3A-J.
Figure 3.
Figure 3.. Biological significance of the FLT3LG allele and rescue of the phenotype
(A) Total mRNA was extracted from the T-cell blasts of three HDs, a heterozygous control (the father), P2, and P3, and EBV-B cells from three HDs, both healthy siblings, P2, and P3. Total mRNA was subjected to RT-qPCR for the assessment of FLT3LG expression with two different probes. Data are displayed as 2−ΔCt values normalized against the expression of endogenous GUS. Bars represent the mean values and SD. (B) Soluble FLT3L determination by ELISA in plasma samples from 12 HDs (all HDs were adults; male or female, and from multiple ethnic groups), the three heterozygous family members, P2, and P3. Bars indicate the mean and SD. (C) Soluble FLT3L determination by ELISA on supernatant samples collected from T-cell blasts from three adult HDs, the heterozygous father, P2, and P3. The medium (Med) from the T-cell culture was used as a negative control. Bars represent the mean and SD. (D) WB analysis of cell lysates obtained from T-cell blasts from three unrelated HDs, P2 and P3. Vinculin was used as a loading control. (E-G) T-cell blasts from patients and controls were either left non-transduced (NT) or were transduced with lentiviruses generated with an empty vector (EV) or with vectors containing the WT sFL or mFL cDNA. (E) Cell-surface FLT3L expression assessed by flow cytometry with a monoclonal Ab (EP1140Y). (F) WB analysis of FLT3L on T-cell blasts from P2, P3, and two HDs. Vinculin was used as a loading control. The red arrow shows the band corresponding to the endogenous FLT3L. (G) Soluble FLT3L protein determination by ELISA on the cell-culture supernatant of T-cell blasts from P2, P3, and two HDs. Bars represent mean with SD. See also Figure S3K.
Figure 4.
Figure 4.. Bone-marrow and hematopoietic progenitors in FLT3L-deficient patients
(A) Light microscopy images of bone marrow smears, for P2, P3 and one age-matched adult HD, after May-Grumwald-Giemsa (MGG) staining. The nucleated cells appear violet. The round, unstained areas correspond to adipocytes, dissolved by MGG staining. (B) Scatter dot plots visualizing the proportions of the indicated hematopoietic lineages among total nucleated cells from P2, P3, and HDs. Bars represent the mean and SD. Two-tailed Mann–Whitney U tests were performed to assess the difference between the patients and nine HDs (4 males and 5 females, aged 23–43, all from European ancestries). *P-value≤0.05, ns: not significant. (C) Bone biopsy for P2 and an age-matched control, showing hypocellularity in P2. At higher magnification of P2’s slide, we observed mostly mature erythroblasts and megakaryocytes, whereas the granulocytic lineage appeared largely hypoplastic. (D) Counts of hematopoietic progenitors (CFU & BFU) in a colony-forming assay performed 13 days after culture with cells from P2, P3, and an adult HD. The pie charts display the proportions of the total colonies corresponding to CFU-GM and BFU-E. (E) Left: frequency of CD34+ hematopoietic stem and progenitor cells (HSPCs) from the BM samples of P2 and 5 adult HDs (all males, aged 24–43). Right: frequency of hematopoietic stem cells (HSCs), multipotent progenitors (MPPs), multilymphoid progenitors (MLPs), common myeloid progenitors (CMPs), megakaryocyte–erythroid progenitors (MEPs), granulocyte–monocyte progenitors (GMPs), dendritic cell progenitors (DCPs), and B cell–NK progenitors (BNKPs) in CD34+Lin cells from P2 and 5 HDs. Data are presented as individual values (min to max). Boxplots show the median and interquartile range (IQR). (F) Left: frequency of CD34+ cells from the PBMCs of P2, P3, and 19 HDs. Right: frequency of HSCs/MPPs, MLPs, CMPs/MEPs, GMPs/DCPs, DCPs, and BNKPs in P2, P3 and 13 HDs (all HDs were adults, male or female, and from multiple ethnic groups). Data are presented as individual values (min to max). Boxplots show the median and IQR. Two-tailed Mann–Whitney U tests were performed to assess the difference between the patients and the controls. *P-value≤0.05, **P-value≤0.01, and ns: not significant. The value for a single time point was used for each individual in all statistical analyses; however, the graphs for the patients display different values measured at different time points. (G-H) Single-cell RNA sequencing on CD34+ cell-enriched HSPCs from the bone marrow of P2 and two HDs (one male, one female, aged 44 and 53, respectively). (G) Unsupervised analysis of CD34+ HSPCs from HDs (HD1: 7604 cells and HD2: 7298 cells) and P2 (262 cells), represented as two-dimensional Uniform manifold approximation and projection (UMAP) plots. All HSCs: HSC and HSC-enriched, MPP, MLP, ImP1 & ImP2: immature myeloid progenitors, NeutroP: neutrophil progenitors, MonoDCP: monocyte and dendritic cell progenitors, PreB: B cell progenitors, MEP: megakaryocyte and erythrocyte progenitors, EryP: erythroid progenitors, MkP: megakaryocyte progenitors, EoBasMastP: eosinophil, basophil and mast cell progenitors, NA: not annotated. (H) Proportion of each HSPC subpopulation among the CD34+ HSPC shown in 5G. Bars represent the mean and SD. See also Figure S4.
Figure 5:
Figure 5:. Hematological profile, including the myeloid- and lymphoid-related immune compartments in the peripheral blood of FLT3L-deficient patients
(A) Absolute numbers for peripheral blood cell subsets in P1, P2, and P3 over time. The reference values for each parameter are indicated by shaded areas. WBC: white blood cells, RBC: red blood cells. (B) Absolute counts for peripheral blood monocyte subsets assessed by CyTOF in P2, P3, and 11 HDs (all HDs were adults, male or female, and from multiple ethnic groups). Data are presented as individual values (min to max). Boxplots show the median and IQR. Two-tailed Mann–Whitney U tests were performed to assess the difference between patients and controls. *P-value≤0.05, and ns: not significant. The value for a single time point for each individual was used for all statistical analyses. However, the graphs for the patients display different values measured at different time points. (C) Absolute counts of peripheral blood dendritic cells assessed by CyTOF in P2, P3, and 12 HDs (all HDs were adults, male or female, and from multiple ethnic groups). Data presentation and statistics are as in B. (D) Flow-cytometry analysis of three subsets of circulating DCs assessed in P2, P3, and one HD after the acquisition of more than >107 events, with more than 5 million live cells/sample. The first gating shows the HLA-DR+Lin (CD3, CD19, CD20, CD14, CD16, CD56) population gated on live CD45+ cells after the removal of doublets. (E) UMAP clustering for 5′ scRNA-seq performed on total PBMCs from P2, P3 and six HDs (all HDs were adults, male or female, and from multiple ethnic groups). The 22 clusters were identified on the basis of cell marker expression analysis. (F) Frequencies of the clusters shown in 5E. (G) UMAP clustering for 5′ scRNA-seq performed on the flow cytometry-sorted HLA-DR+Lin (CD3, CD19, CD20, CD56) populations from P2, P3 and two adult HDs (one male and one female, from the same ethnic group as the patients). The seven clusters targeted are identified on the basis of cell marker expression analysis. (H) Frequencies of the clusters identified in 5G. (I) Volcano plot showing the results of a differential gene expression (DEG) analysis of the experiment in 5G and H, comparing normalized gene expression levels between patients and controls. Genes with a log2 fold change (log2FC) in expression and a FDR< 0.0005 were considered significant. A color code indicates the level of significance. See also Figure S5.
Figure 6.
Figure 6.. B-cell and NK cell features in FLT3L-deficient patients
(A) Absolute blood counts of peripheral B-cell subsets, as defined by CyTOF, for P2, P3, and 20 HDs (all HDs were adults, male or female, and from multiple ethnic groups). Data are presented as individual values (min to max). Boxplots show the median and IQR. Two-tailed Mann–Whitney U tests were performed to assess the difference between the patients and the controls. *P-value≤0.05, **P< 0.01, ns: not significant. The value for a single time point for each individual was used for all statistical analyses. However, the graphs for the patients display different values measured at different time points. (B) Absolute blood counts and proportions among B cells of age-related B cells (ABCs), as defined by CyTOF, for P2, P3, and 20 HDs (as in A). Data presentation and statistics are as in A. (C) Proportions of plasmablasts among the CD19+ B cells of BMNCs, as defined by CyTOF, for the BM samples of patients and four adult HDs. Data presentation and statistics are as in A. (D) Heatmap showing the relative values for antibody reactivity against 38 different HPV types measured in a Luminex-based serological analysis performed on plasma samples from P2, P3 and 20 adult controls (male or female, multiple ethnic groups; each row represents a single serum sample). MFI values above 200 were considered positive. (E) Absolute counts of total NK cells and CD56bright NK cells, and the proportion of CD56bright cells among NK cells from P2, P3, and 16 HDs (all HDs were adults, male or female, and from multiple ethnic groups). Data presentation and statistics are as in A. (F) Percentages of CD56dim NK cell differentiation subsets, as defined on the basis of pan-KIR and NKG2A expression detected by flow cytometry, for P2, P3 and 16 HDs (as in E). Data presentation and statistics are as in A. (G) Flow-cytometry analysis showing that the CD56dim NK cell subsets of the two patients include adaptive NK cells. This subset can be identified as NKG2C+/−CD161CD57+ cells. Two HDs were included as examples. HD1 has no adaptive NK cells. HD2 has a large subset of adaptive NK cells. Note that P2 is homozygous for a frequent deletion in KLRC2, which encodes NKG2C. See also Figures S5E, S6 and S7.
Figure 7.
Figure 7.. Skin phenotype of FLT3L-deficient patients
(A) Imaging mass cytometry (IMC) on paraffin-embedded skin biopsy specimens from HDs or healthy skin (HS) and a wart from P2. In the upper panel, the epidermis and dermis were defined based on cytokeratin and E-cadherin expression. The images in the middle panel show the staining for CD3, CD8, CD68 and langerin. Finally, the images in the lower panel show Langerhans cells (LCs), macrophages (Mac), CD4 and CD8 T cells after segmentation and identification by a machine-learning approach. (B) Quantification of the main immune subsets in the epidermis (LCs) and dermis (Mac, CD4 and CD8 T cells) after identification by a machine-learning approach applied to biopsy specimens from six different HDs (adults, male or female and from multiple ethnic groups), with comparison to HS and warts from two patients. Data are presented as individual values (min to max). Boxplots show the median with IQR. No statistical analysis was performed here. (C) The frequencies of each immune subset after 5′ scRNA-seq on skin biopsy specimens of HS from three HDs (adults, male or female, and from multiple ethnic groups), P2 and P3, and a wart from P2. All the principal clusters targeted are identified on the basis of cell marker expression analysis. Data presentation are as in B. (D) UMAP clustering for the immune subsets shown in 7C.

References

    1. Orkin SH, and Zon LI (2008). Hematopoiesis: An Evolving Paradigm for Stem Cell Biology. Cell 132, 631–644. 10.1016/j.cell.2008.01.025. - DOI - PMC - PubMed
    1. Bao EL, Cheng AN, and Sankaran VG (2019). The genetics of human hematopoiesis and its disruption in disease. EMBO Mol. Med 11, e10316. 10.15252/emmm.201910316. - DOI - PMC - PubMed
    1. Ceredig R, Rolink AG, and Brown G (2009). Models of haematopoiesis: seeing the wood for the trees. Nat. Rev. Immunol 9, 293–300. 10.1038/nri2525. - DOI - PubMed
    1. Lagresle-Peyrou C, Six EM, Picard C, Rieux-Laucat F, Michel V, Ditadi A, Chappedelaine CD, Morillon E, Valensi F, Simon-Stoos KL, et al. (2009). Human adenylate kinase 2 deficiency causes a profound hematopoietic defect associated with sensorineural deafness. Nat. Genet 41, 106–111. 10.1038/ng.278. - DOI - PMC - PubMed
    1. De Vaal OM, and Seynhaeve V (1959). RETICULAR DYSGENESIA. The Lancet 274, 1123–1125. 10.1016/S0140-6736(59)90105-9. - DOI - PubMed

MeSH terms