. 2024 May 13;42(5):833-849.e12.
doi: 10.1016/j.ccell.2024.04.007. Epub 2024 May 2.

Molecular targets of glucocorticoids that elucidate their therapeutic efficacy in aggressive lymphomas

Affiliations

Molecular targets of glucocorticoids that elucidate their therapeutic efficacy in aggressive lymphomas

Jaewoo Choi et al. Cancer Cell. .

Abstract

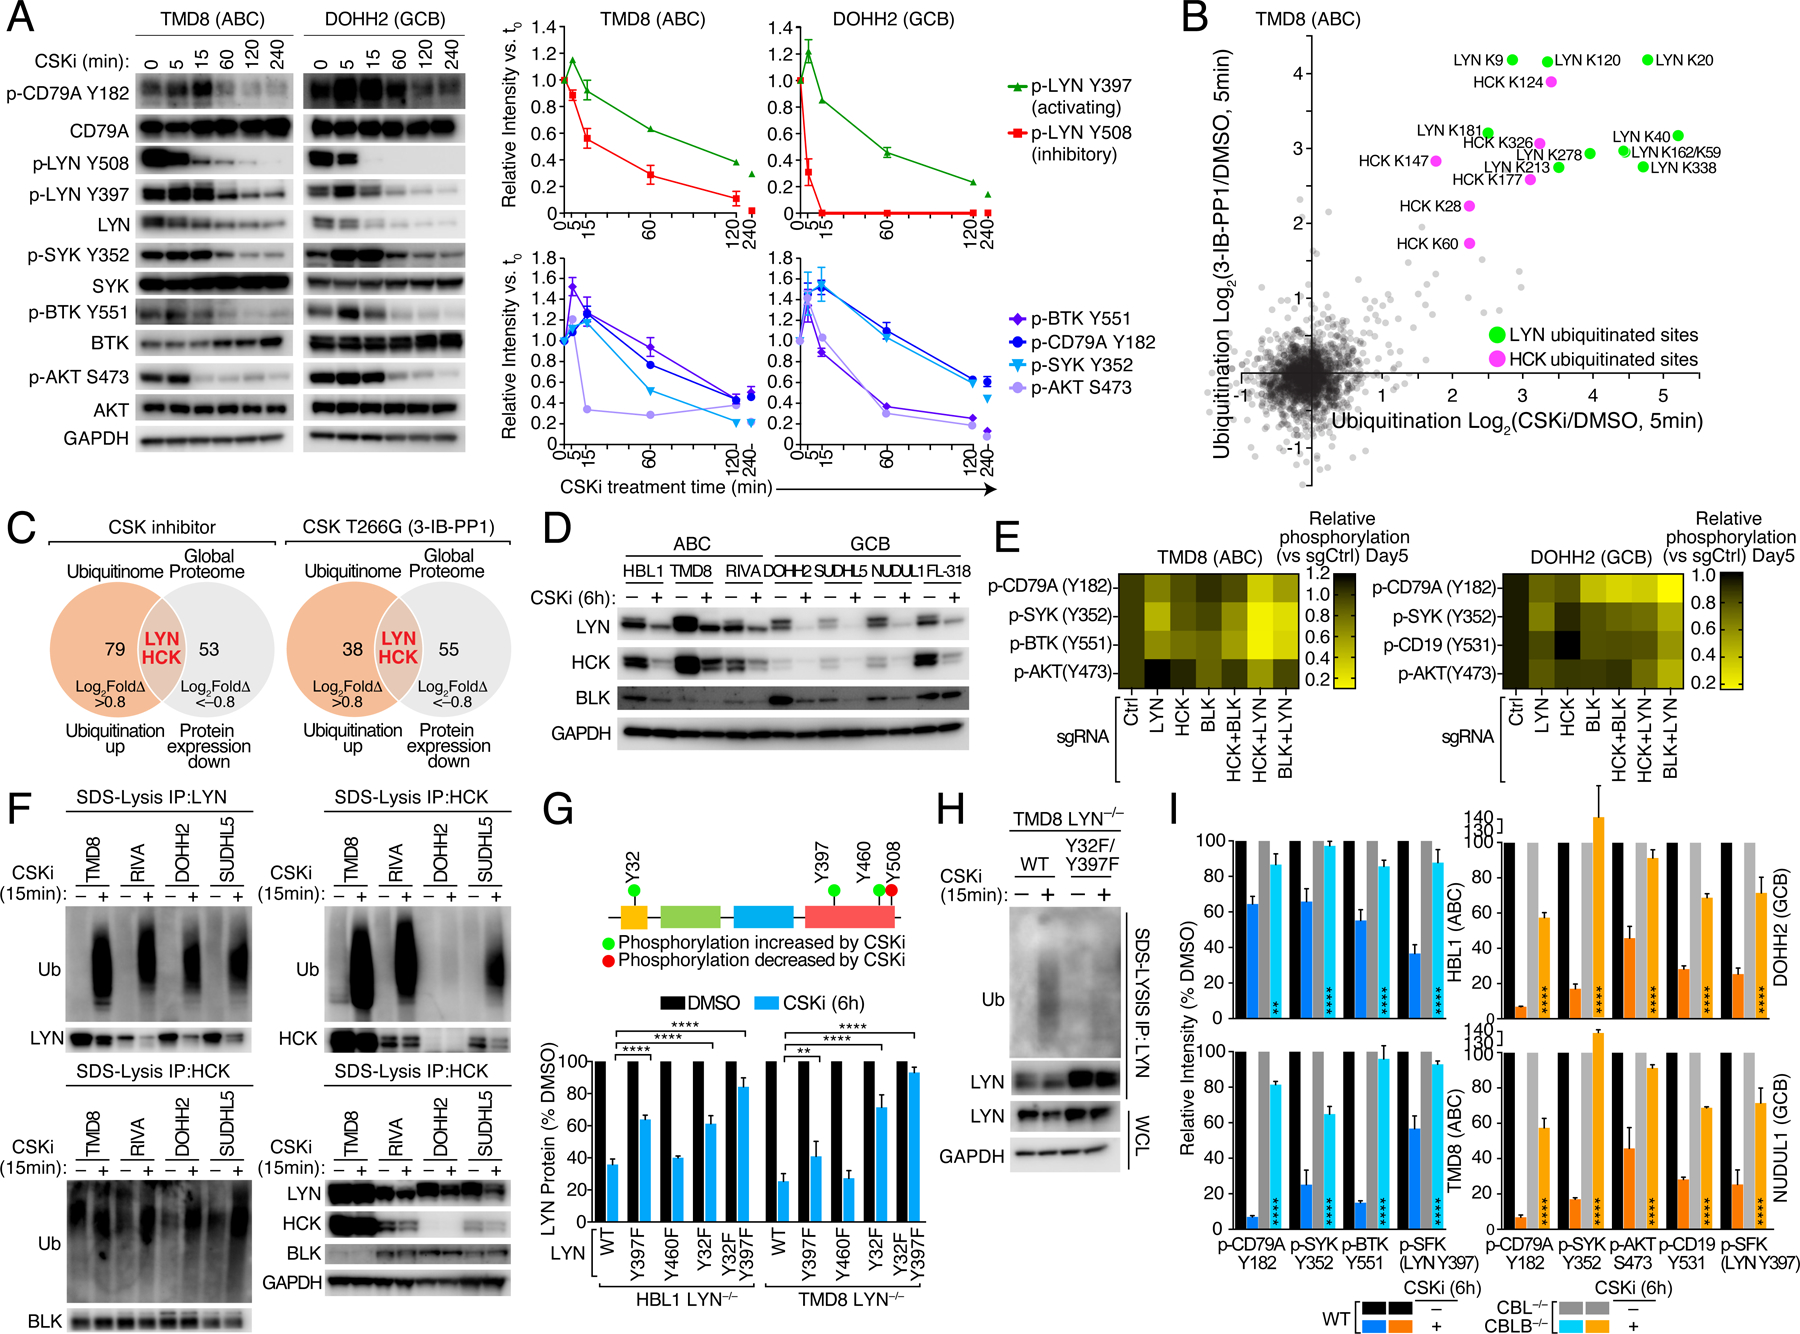
Glucocorticoids have been used for decades to treat lymphomas without an established mechanism of action. Using functional genomic, proteomic, and chemical screens, we discover that glucocorticoids inhibit oncogenic signaling by the B cell receptor (BCR), a recurrent feature of aggressive B cell malignancies, including diffuse large B cell lymphoma and Burkitt lymphoma. Glucocorticoids induce the glucocorticoid receptor (GR) to directly transactivate genes encoding negative regulators of BCR stability (LAPTM5; KLHL14) and the PI3 kinase pathway (INPP5D; DDIT4). GR directly represses transcription of CSK, a kinase that limits the activity of BCR-proximal Src-family kinases. CSK inhibition attenuates the constitutive BCR signaling of lymphomas by hyperactivating Src-family kinases, triggering their ubiquitination and degradation. With the knowledge that glucocorticoids disable oncogenic BCR signaling, they can now be deployed rationally to treat BCR-dependent aggressive lymphomas and used to construct mechanistically sound combination regimens with inhibitors of BTK, PI3 kinase, BCL2, and CSK.

Keywords: ABC; B cell receptor; CSK; DLBCL; GCB; PI3 kinase; combination therapy; dexamethasone; glucocorticoids; prednisone.


Conflict of interest statement

Declaration of interests The authors declare no competing interests.

Figures

Figure 1.
Figure 1.. Synthetic lethality with glucocorticoids
(A) Heatmap of the prednisolone drug interaction landscape ranked by average Excess HSA of DLBCL lines. (B) Normalized enrichment score for drug targets ranked by the Drug-Target Set Enrichment Analysis (DTSEA). (C) Xenografts using DLBCL cells treated with either vehicle, Ibrutinib, Copanlisib, Dexamethasone, or the combination. Mean±SEM, n=4–5 mice per group, two-way ANOVA. (D) Workflow of glucocorticoid (GC)-sensitized CRISPR-Cas9 screens. (E) Ranked list of average prednisolone CRISPR Screen Scores (CSSs) in DLBCL and BL lines. (F) Common synergizing sgRNAs with prednisolone in DLBCL and BL lines. ****P ≤0.0001. Also see Figure S1 and Table S1.
Figure 2.
Figure 2.. Negative regulators of BCR/PI3K signaling are direct GR targets
(A) Volcano plots of average gene signature expression in DLBCL lines treated with prednisolone by RNA-seq. (B) Mean nuclear NF-κB (p50) and FOXO1 translocation scores in DLBCL and BL lines treated with prednisolone. Mean±SEM, n≥3, two-tailed t-test. (C) Heatmap of identified GR peaks in DLBCL and BL lines treated with prednisolone. (D) Venn diagram of GR bound genes in DLBCL and BL lines treated with prednisolone. Pathway enrichment analysis by Toppgene suite. (E) Criteria for selection of 58 GR direct targets mediating glucocorticoid toxicity. (F) Heatmap of relative mRNA expression of 58 GR direct targets after prednisolone treatment. (G) Ranked list of cumulative prednisolone CSSs of 58 GR direct targets in DLBCL and BL lines. (H) Heatmap of % rescue of cell viability in DLBCL lines transduced with the indicated sgRNAs and treated with the indicated concentrations of prednisolone. *P ≤0.05, **P ≤0.01, ***P ≤0.001. Also see Figure S2 and Table S2.
Figure 3.
Figure 3.. GR transactivation of LAPTM5 increases BCR turnover and suppresses BCR signaling
(A) Immunoblots and quantification for CD79AY182 phosphorylation in DLBCL and BL lines treated with prednisolone. Mean±SEM, n=3. (B) Immunoblots and quantification for CD79AY182 phosphorylation in DLBCL lines expressing GR wild-type or GRR477S, a DNA-binding mutant isoform, treated with prednisolone. Mean±SEM, n=3, two-way ANOVA. (C) Relative mean fluorescence intensities (MFI) of IgM and CD79B in DLBCL and BL lines treated with prednisolone. Mean±SEM, n=3. (D) Representative tracks of GR binding peaks at the LAPTM5 locus from HBL1 cells treated with prednisolone by CUT&RUN. (E) Quantification and immunoblots using the indicated antibodies in Ramos cells expressing LAPTM5 wild-type or AP1/GRE mutants treated with prednisolone. Mean±SEM, n=3, two-way ANOVA. (F) Immunoblots and quantification for the indicated proteins in HBL1, FL-318, and Ramos cells expressing endogenous LAPTM5 wild-type or ΔAP1ΔGRE2 mutant treated with prednisolone. Mean±SEM, n=3, two-way ANOVA. (G) Competitive growth assay of co-culturing indicated GFP-negative cells (LAPTM5 wild-type or ΔAP1ΔGRE2) with GFP-positive control cells in the presence of prednisolone. Mean±SEM, n=3. (H) Genetic analysis of LAPTM5 mutations in DLBCL biopsy specimens (n=1975). (I) Deleted chromosomal regions encompassing LAPTM5 in DLBCL biopsies and the percentile expression of LAPTM5 mRNA in each biopsy relative to other biopsies (n=574) along with the cell-of-origin (COO) classification. (J) FACS analysis of HBL1 xenografts generated using a mixture of BFP-positive cells expressing indicated sgRNAs and BFP-negative control cells. Mean±SEM, n=5 mice per group, unpaired two-tailed t-test. (K) Percent sgRNA+ follicular B cells and sgRNA+/Cas9+ GC B cells in 8-week Aid-Cas9 BM chimeras transduced with non-targeting (sgCtrl) or Laptm5-targeting sgRNAs, immunized subcutaneously with NP-CGG 7–10 days prior to analysis. Data are pooled from 2 experiments with 3–5 mice/experiment, unpaired two-tailed t-test. *P ≤0.05, ** P ≤0.01, *** P ≤0.001, ****P ≤0.0001, ns; not significant. Also see Figure S3.
Figure 4.
Figure 4.. Glucocorticoid repression of CSK is lethal in BCR-dependent aggressive lymphomas
(A) Representative tracks of GR peaks at the CSK genomic locus from HBL1 cells treated with prednisolone by CUT&RUN. (B) CSSs of BCR pathway components in DLBCL and BL lines. Mean±SD, n=3 cell lines. (C) Toxicity assays of CSK knockout in DLBCL and BL lines. (D) CSK knockout rescue experiment in DLBCL lines expressing exogenous CSK WT or CSKK222R mutant. Mean ± SEM, n=2 pooled from two different cell lines. (E) MTS proliferation assays in BCR-dependent and BCR-independent DLBCL and BL lines treated with indicated dose of CSKi. Mean±SD, n=3 technical replicates. Representative data; n=3 (F) Volcano plots of average gene expression signatures in DLBCL lines treated with CSKi by RNA-seq. (G) Mean nuclear NF-κB (p50) and FOXO1 translocation scores in DLBCL lines treated with indicated drugs. Mean±SEM, n=3, two-way ANOVA. (H) Phospho-tyrosine profiling in DLBCL lines treated with CSKi. *P ≤0.05, **P ≤0.01, ***P ≤0.001. Also see Figure S4, Table S3, and S4.
Figure 5.
Figure 5.. CSK sustains oncogenic BCR signaling
(A) Immunoblots and quantification for the indicated proteins in DLBCL lines treated with CSKi for indicated time points. Mean±SEM, n=3. (B) Ubiquitination profiling in TMD8 cells treated with CSKi or 3-IB-PP1. (C) Overlap of proteins with increased ubiquitylation and decreased protein expression by CSKi and 3-IB-PP1. (D) Immunoblots using the indicated antibodies in DLBCL lines treated with CSKi, n=3. (E) Heatmap of relative phosphorylation levels in DLBCL lines infected with indicated sgRNAs (day 5). (F) In vivo ubiquitylation assays and immunoblots of DLBCL lines treated with CSKi, n=3. (G) Schematic representation of LYN phosphorylation marks affected by CSKi and LYN protein levels (WT and mutants) in ABC lines treated with CSKi. Mean±SEM, n=3, two-way ANOVA. (H) In vivo ubiquitylation assays in TMD8 cells expressing LYN wild-type or Y32F/Y397F treated with CSKi, n=3 (I) Quantification of indicated phosphorylation levels in indicated cells treated with CSKi. Mean±SEM, n=3, two-way ANOVA. ** P ≤0.01, ****P ≤0.0001. Also see Figure S5 and Table S4.
Figure 6.
Figure 6.. Synthetic lethality with CSK inhibition
(A) Ranked list of average CSKi CSSs of DLBCL lines. (B) Overlap of sgRNAs promoting sensitivity and resistance from CSKi and glucocorticoid CRISPR screens. (C) Heatmap of ranked top 20 sensitizing and resistant genes in CSKi and GC CRISPR screens by the average CSSs. (D) Heatmap of the CSKi drug interaction landscape ranked by average Excess HSA of DLBCL lines. (E) Cell viability and Excess HSA matrices in DLBCL lines treated with indicated doses of CSKi and betamethasone. (F) Quantification of CD79A phosphorylation levels in DLBCL lines treated with indicated drugs. Mean±SEM, n≥3, two-way ANOVA. (G) CSKi drug synergy scores with indicated drugs assessed by Caspase 3/7 apoptosis assays. **P ≤0.01, ****P ≤0.0001. Also see Figure S6 and Table S5.
Figure 7.
Figure 7.. Therapeutic combinations of glucocorticoids with CSKi
(A-D) Xenografts using HBL1 and FL-318 cells treated with indicated drugs for the indicated days. Mean±SEM, n=4–5 mice per group. two-way ANOVA. (F) Model of glucocorticoids and CSKi regulation of oncogenic BCR signaling in aggressive lymphomas. ** P ≤0.01, ****P ≤0.0001. Also see Figure S7.

References

    1. Pearson OH, Eliel LP, and et al. (1949). Adrenocorticotropic hormone- and cortisone-induced regression of lymphoid tumors in man; a preliminary report. Cancer 2, 943–945. 10.1002/1097-0142(194911)2:6<943::aid-cncr2820020602>3.0.co;2-p. - DOI - PubMed
    1. Rosenthal MC, Saunders RH, Schwartz LI, Zannos L, Perez Santiago E, and Dameshek W (1951). The use of adrenocorticotropic hormone and cortisone in the treatment of leukemia and leukosarcoma. Blood 6, 804–823. - PubMed
    1. Payvar F, DeFranco D, Firestone GL, Edgar B, Wrange O, Okret S, Gustafsson JA, and Yamamoto KR (1983). Sequence-specific binding of glucocorticoid receptor to MTV DNA at sites within and upstream of the transcribed region. Cell 35, 381–392. 10.1016/0092-8674(83)90171-x. - DOI - PubMed
    1. Scheidereit C, Geisse S, Westphal HM, and Beato M (1983). The glucocorticoid receptor binds to defined nucleotide sequences near the promoter of mouse mammary tumour virus. Nature 304, 749–752. 10.1038/304749a0. - DOI - PubMed
    1. Weikum ER, Knuesel MT, Ortlund EA, and Yamamoto KR (2017). Glucocorticoid receptor control of transcription: precision and plasticity via allostery. Nat Rev Mol Cell Biol 18, 159–174. 10.1038/nrm.2016.152. - DOI - PMC - PubMed

MeSH terms