. 2024 May 3;134(11):e177427.
doi: 10.1172/JCI177427.

Intermittent glucocorticoid treatment improves muscle metabolism via the PGC1α/Lipin1 axis in an aging-related sarcopenia model

Affiliations

Intermittent glucocorticoid treatment improves muscle metabolism via the PGC1α/Lipin1 axis in an aging-related sarcopenia model

Ashok D Prabakaran et al. J Clin Invest. .

Abstract

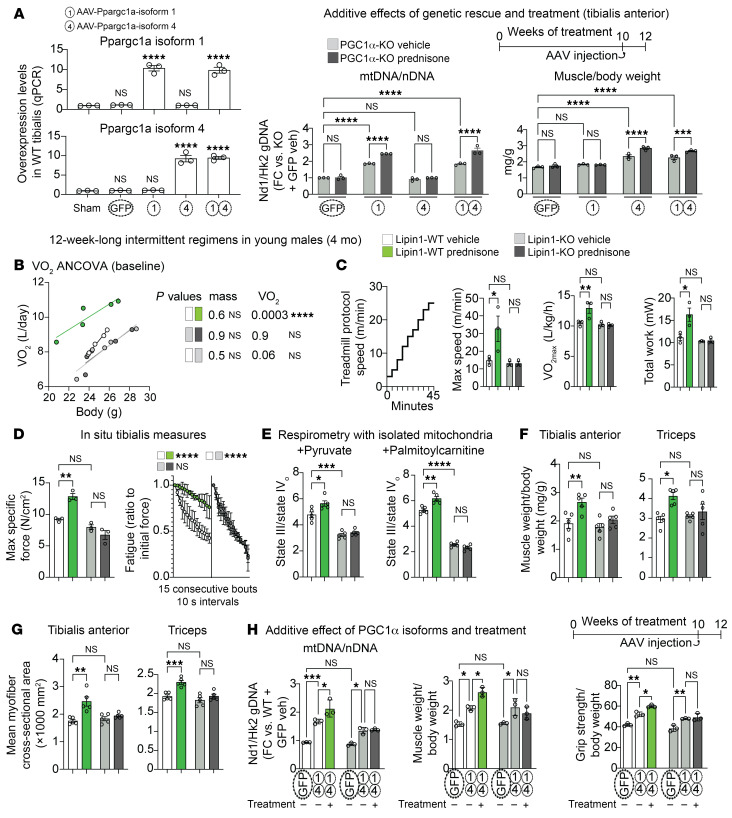
Sarcopenia burdens the older population through loss of muscle energy and mass, yet treatments to functionally rescue both parameters are lacking. The glucocorticoid prednisone remodels muscle metabolism on the basis of frequency of intake, but its mechanisms in sarcopenia are unknown. We found that once-weekly intermittent prednisone administration rescued muscle quality in aged 24-month-old mice to a level comparable to that seen in young 4-month-old mice. We discovered an age- and sex-independent glucocorticoid receptor transactivation program in muscle encompassing peroxisome proliferator-activated receptor γ coactivator 1 α (PGC1α) and its cofactor Lipin1. Treatment coordinately improved mitochondrial abundance through isoform 1 and muscle mass through isoform 4 of the myocyte-specific PGC1α, which was required for the treatment-driven increase in carbon shuttling from glucose oxidation to amino acid biogenesis. We also probed myocyte-specific Lipin1 as a nonredundant factor coaxing PGC1α upregulation to the stimulation of both oxidative and anabolic effects. Our study unveils an aging-resistant druggable program in myocytes for the coordinated rescue of energy and mass in sarcopenia.

Keywords: Aging; Epigenetics; Mitochondria; Muscle; Muscle biology.


Conflict of interest statement

Conflict of interest: MQ is listed as co-inventor on a patent application related to intermittent glucocorticoid use filed by Northwestern University (PCT/US2019/068618).

Figures

Figure 1
Figure 1. Intermittent once-weekly prednisone regimen rejuvenates mitochondrial and mass properties of aging muscle.
(A) Treatment improved strength and treadmill performance in background-matched male mice at young adult (4 mo) and older adult (24 mo) ages, improving the parameters of the treated aged mice to levels comparable to those of the control (veh, vehicle) young adult mice at the endpoint. (B) Treatment rescued specific force in older mice to levels seen in control young mice, while increasing resistance to repetitive tetanus fatigue to a comparable extent at both ages. max, maximum. (C and D) Treatment improved mitochondrial abundance (mtDNA/nDNA, MitoTracker) and decreased superoxide levels (MitoSOX) in aged muscle compared with young control-like levels. Analogous trends were observed with mitochondrial respiration levels and NMR-quantitated levels of ATP and phosphocreatine in quadriceps muscles. AA, antimycin A; FC, fold change; rot, rotenone. (EG) In treated older mice, total lean mass increased to young control-like levels. This correlated with rescue of muscle weight/body weight ratios in older mice in locomotory (gastrocnemius, quadriceps, triceps) and respiratory (diaphragm) muscles. Tibialis anterior muscle analyses showed coupling of myofiber CSA trends with the changes in muscle mass. n = 4–8/group. Histograms and curves report the mean ± SEM; pre- and post-treatment plots report each subject trend; violin plots indicate the mean and the 25th–75th percentiles. *P < 0.05, **P < 0.01, ***P < 0.001, and ****P < 0.0001; (start-end) pre-/post-paired 3-way ANOVA with Šidák’s test (endpoint) (A and E); 2-way ANOVA with Šidák’s test (BD, F, and G).
Figure 2
Figure 2. Epigenetic and transcriptional profiling reveals a treatment-induced muscle GR cistrome that is maintained through aging.
(A and B) Motif analysis and robust promoter peaks in the canonical target Fkbp5 confirm GR ChIP-Seq data sets. (CE) Treatment increased GR peak numbers and genome-wide, GRE-bound GR signal to comparable extents in both young and older age groups in both males and females. In all experimental groups, treatment increased the GR signal in promoters and 5′-UTR regions. norm, normalized. (F) PCA analysis of RNA-Seq data sets showed age- and treatment-related trends across sexes. (G and H) GO analysis revealed enrichment for muscle metabolic factors, particularly Ppargc1a (encoding PGC1α) and Lpin1 (encoding the PGC1α cofactor Lipin1). veh, vehicle; pred, prednisone. (I) Expression of both isoforms 1 and 4 of Ppargc1a was rescued to young-like levels in treated older muscle, correlating with increased GR binding on canonical and alternative start sites (arrows). TPM, transcripts per million. n = 3/group. Histograms report the mean ± SEM. *P < 0.05, **P < 0.01, and ****P < 0.0001; 2-way ANOVA with Šidák’s test.
Figure 3
Figure 3. Myocyte-specific inducible PGC1α ablation blocks treatment effects on both mitochondrial function and muscle mass.
(A) Recombination of the floxed allele reduced expression of both PGC1α isoforms in muscle. (B and C) In young adult mice, myocyte-specific inducible PGC1α ablation blocked the effects of 12-week-long intermittent prednisone treatment on strength, treadmill performance, force, and fatigue. (D) PGC1α ablation blocked or blunted the treatment effects on mitochondrial abundance and on the mitochondrial RCR and the basal OCR in muscle tissue regardless of fuel. (E) PGC1α ablation blocked or blunted treatment effects on lean mass, muscle mass, myofiber CSA. (F) Treatment increased protein translation in muscle dependent on myocyte PGC1α. n = 3–6/group. Histograms and curves report the mean ± SEM; pre- and post-treatment plots report each subject trend; violin plots indicate the mean and 25th–75th percentiles. *P < 0.05, **P < 0.01, ***P < 0.001, and ****P < 0.0001; (start-end) pre-/post-paired 3-way ANOVA with Šidák’s test (B and E); (endpoint) 2-way ANOVA with Šidák’s test (A, C, D, and F).
Figure 4
Figure 4. Treatment increases carbon shuttling between glucose and amino acids in muscle dependent on myocyte-specific PGC1α.
(A) In isolated contracting muscle exposed to 13C6-glucose, treatment increased carbon shuttling to alanine, glutamate, glutamine, and aspartate, but not to serine or glycine. (B) Myocyte-specific PGC1α was required for treatment-driven upregulation of mitochondrial enzymes and/or enzyme isoforms mediating the underlying reactions between glucose derivatives and amino acids. The treatment effect on expression of those genes was also confirmed in young and older muscles by RNA-Seq. αKG, α-ketoglutarate; ala, alanine; asp, aspartate; glu, glutamate; gln, glutamine; oxa, oxaloacetate; pyr, pyruvate. (C) MS images showed increased levels of target amino acids in treated young and aged muscles after a glucose-plus-insulin challenge. n = 3–6/group. Histograms report the mean ± SEM. *P < 0.05, **P < 0.01, ***P < 0.001, and ****P < 0.0001; 2-way ANOVA with Šidák’s test.
Figure 5
Figure 5. Myocyte-specific Lipin1 controls energy-mass balance in muscle.
(A) MyoAAV-mediated overexpression in WT muscle 2 weeks after r.o. injection of 1012 vg/mouse (left). Combination of AAV and treatment in PGC1α-KO mice revealed an additive effect of the treatment on genetic rescue of mitochondrial abundance by Pgc1α isoform 1 and muscle mass by PGC1α isoform 4 (right) in tibialis anterior muscles. Together with our RNA-Seq/ChIP-Seq screening, the additive effect warranted investigation of Lipin1 as a treatment-driven cofactor to coax PGC1α regulation with energy-mass balance. (B) ANCOVA for VO2 in metabolic cages without specific exercise triggers showed increased VO2 independent from body mass in control (WT Lipin1) mice, but not after Lipin1 ablation (Lipin1-KO). (C) In the metabolic treadmill test, treatment increased VO2max as well as speed and work until exhaustion dependent on myocyte-specific Lipin1. (D and E) Lipin 1 was critical for treatment-driven effects on muscle force and fatigability and mitochondrial respiration. (F and G) Analogously to its cofactor PGC1α manipulation, Lipin1 ablation blunted or blocked treatment effects on muscle mass in 2 different locomotory muscles (tibialis, hind limbs; triceps, forelimbs). (H) KO of Lipin1 blocked the additive effect of treatment on top of the PGC1α isoform 1 and isoform 4 overexpression effect on mitochondrial abundance, tibialis anterior muscle mass, and grip strength. n = 3–5/group. Histograms and curves report the mean ± SEM. *P < 0.05, **P < 0.01, ***P < 0.001, and ****P < 0.0001; 2-way ANOVA with Šidák’s test.

References

    1. Cruz-Jentoft AJ, et al. Understanding sarcopenia as a geriatric syndrome. Curr Opin Clin Nutr Metab Care. 2010;13(1):1–7. doi: 10.1097/MCO.0b013e328333c1c1. - DOI - PubMed
    1. Newman AB, et al. Strength and muscle quality in a well-functioning cohort of older adults: the Health, Aging and Body Composition Study. J Am Geriatr Soc. 2003;51(3):323–330. doi: 10.1046/j.1532-5415.2003.51105.x. - DOI - PubMed
    1. Short KR, et al. Decline in skeletal muscle mitochondrial function with aging in humans. Proc Natl Acad Sci U S A. 2005;102(15):5618–5623. doi: 10.1073/pnas.0501559102. - DOI - PMC - PubMed
    1. Migliavacca E, et al. Mitochondrial oxidative capacity and NAD+ biosynthesis are reduced in human sarcopenia across ethnicities. Nat Commun. 2019;10(1):5808. doi: 10.1038/s41467-019-13694-1. - DOI - PMC - PubMed
    1. Leveille M, et al. PGC-1α isoforms coordinate to balance hepatic metabolism and apoptosis in inflammatory environments. Mol Metab. 2020;34:72–84. doi: 10.1016/j.molmet.2020.01.004. - DOI - PMC - PubMed

MeSH terms

Substances