. 2024 May 28;11(5):ENEURO.0252-23.2024.
doi: 10.1523/ENEURO.0252-23.2024. Print 2024 May.

Spatiotemporal Organization of Prefrontal Norepinephrine Influences Neuronal Activity

Affiliations

Spatiotemporal Organization of Prefrontal Norepinephrine Influences Neuronal Activity

Samira Glaeser-Khan et al. eNeuro. .

Abstract

Norepinephrine (NE), a neuromodulator released by locus ceruleus (LC) neurons throughout the cortex, influences arousal and learning through extrasynaptic vesicle exocytosis. While NE within cortical regions has been viewed as a homogenous field, recent studies have demonstrated heterogeneous axonal dynamics and advances in GPCR-based fluorescent sensors permit direct observation of the local dynamics of NE at cellular scale. To investigate how the spatiotemporal dynamics of NE release in the prefrontal cortex (PFC) affect neuronal firing, we employed in vivo two-photon imaging of layer 2/3 of the PFC in order to observe fine-scale neuronal calcium and NE dynamics concurrently. In this proof of principle study, we found that local and global NE fields can decouple from one another, providing a substrate for local NE spatiotemporal activity patterns. Optic flow analysis revealed putative release and reuptake events which can occur at the same location, albeit at different times, indicating the potential to create a heterogeneous NE field. Utilizing generalized linear models, we demonstrated that cellular Ca2+ fluctuations are influenced by both the local and global NE field. However, during periods of local/global NE field decoupling, the local field drives cell firing dynamics rather than the global field. These findings underscore the significance of localized, phasic NE fluctuations for structuring cell firing, which may provide local neuromodulatory control of cortical activity.

Keywords: arousal; calcium imaging; computational modeling; norepinephrine; spatiotemporal activity; two-photon imaging.


Figures

Figure 1.
Figure 1.
High NE axon and low NET density in the PFC permits observation of spatially diffuse NE. A, Light sheet microscopy was performed by fixing the brain of DBH-TdTomato mice, staining with an anti-NET antibody, and subsequently imaging horizontal slices. Light sheet microscopy 3D images of NET (green) and LC axons (red). B, The PFC receives denser LC innervation than the visual cortex (left) but has a lower density of NET (center). Comparison of axon density in the PFC versus the visual cortex from n = 10 brain slices (right; 2-sample t test: t(16) = 3.96; p = 0.001). C, Mice were infected with two adeno-associated viruses to express jRGECO1a (a red Ca2+ sensor) and GRAB-NE2h (a green NE sensor). Simultaneous Ca2+ and NE dynamics were measured in awake head-fixed mice using two-photon imaging through a GRIN lens implant targeting the medial PFC. D, An example field of view from two-photon imaging of jREGCO1a (top) and GRAB-NE2h (bottom). Ca2+ dynamics were extracted as the average fluctuations in manually traced putative cell body ROIs. Each putative cell body was assigned its own local NE field, defined as the 15 μm circular disk surrounding the somatic ROI (excluding pixels assigned to the cell body itself and any overlapping NE fields).
Figure 2.
Figure 2.
Local NE has a characteristic spatial and temporal scale. A, Example of movement-corrected local (15 μm radius) NE fluorescence around putative cells. Different local NE fields peak at different times. B, Cumulative distribution function (CDF) showing significantly lowered correlations between local NE fields to each other (dotted) compared with the correlations between local NE fields and the global NE fluorescence (solid; KS test: p = 3.00 × 10−57). C, Spatial autocorrelation function of NE fluorescence: temporal correlation of patches (100 μm2) of local NE fluorescence to other patches as a function of distance. Spatial correlations are deflated compared with B due to smaller area of correlated regions and due to inclusion of regions with lower GRABNE sensor expression. D, E, Example traces of NE synchrony time series (local NE:global NE sliding correlation with a 30 s window) over (D) 5 min for 28 local NE regions (average in black, example synchrony trace from 1 local NE field in blue; E) 1 min corresponding to shaded area of D. Transient dips in correlation are observed when the local and global NE fluorescence become decoupled. F, Correlation between synchrony traces of local NE fields versus the distance between local NE fields. G, Histogram of the lengths of low synchrony periods (defined as times when the sliding correlation between local and global NE is lower than the mean correlation between local and global NE).
Figure 3.
Figure 3.
Local NE predicts cellular Ca2+ dynamics A, Schematic of variables used in GLM. Single neuron Ca2+, jRGECO1a fluorescence of one neuron (response variable); global Ca2+, jRGECO1a fluorescence of all other cells in the field of view (FOV); local NE, the GRAB-NE2h fluorescence in a radius of 15 μm around the target neuron (but not including the neuron pixels); global NE, the GRAB-NE2h fluorescence in the FOV (but not including the chosen local NE pixels). B, Example time series of all inputs and response variables for GLM. NE synchrony is the sliding correlation with a 30 s window between local NE and global NE. NE synchrony is used to select time points for modeling (separate models are fitted for high and low synchrony periods). C, GLMs were individually fitted to N = 326 ROI Ca2+ fluorescence separately for periods of high and low synchrony (as in Fig. 2E). During high synchrony, the results demonstrate significant separate correlation of local NE, global NE, global Ca2+, as well as local:global NE interaction. D, Global NE and local:global NE interaction terms were reduced to a nonsignificance during low synchrony relative to high synchrony periods. E, Schematic of repeated model fitting at expanding radii for the local NE field (5–100 μm) to determine spatial extent of local NE-cell Ca2+ relationship. F, Beta coefficient distribution (n = 326 cells) as a function of expanding radii demonstrating highest peak correlation at 25 μm for the low synchrony condition.
Figure 4.
Figure 4.
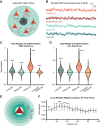
NE reuptake inhibition disrupts local NE structure. A, Desipramine works by blocking the NE transporter, leading to the global accumulation of extrasynaptic NE. B, Representative examples of local NE during either NE transporter inhibition by desipramine (top, blue) or saline (bottom, magenta). Desipramine condition is shown both prior to and after detrending. The detrended time series are used to define spatiotemporal correlations in subsequent analyses. C, Desipramine and saline spatial autocorrelation function of NE fluorescence calculated as the temporal correlation of patches (10 pixels) of local NE fluorescence to other patches as a function of distance. D, GLMs were individually fitted to N = 310 ROI Ca2+ fluorescence traces for the desipramine condition (as in Fig. 3A–D), demonstrating significantly decreased beta weights for local NE (two-sample t test: t(634) = 2.50; SD = 0.09; p = 0.013), but not global NE for desipramine compared with saline. E, Cumulative probability distributions (CDF) for the correlation of local NE fields to each other (top) and local NE fields to the global NE field (bottom) for desipramine and saline. LME models accounting for repeated observations from the same mouse and cell show a significant fixed effect of desipramine (local NE/global NE: fixed effect of drug, 0.11 ± SE: 0.04; t(634) = 2.6; p = 0.010; local NE/local NE: fixed effect of drug, 0.10 ± SE: 0.05; t(8,274) = 2.10; p = 0.039).
Figure 5.
Figure 5.
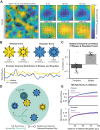
Optic flow fields reveal spatial organization of local NE. A, Optic flow vector fields are applied to NE fluorescence across the field of view. The spatial gradient of NE spread is used to define critical points at different time points. We observe that the same location can go from being a region of reuptake (expanding and contract region of low NE concentration) to a region of release (expanding and contracting region of high NE concentration). B, Schematic depiction of a putative release and reuptake site (top) and representative example output (bottom) from optic flow analysis of a two-photon imaging session demonstrating the number of release and reuptake sites at each point in time. C, Release and reuptake sites are spatially correlated (1-sample t test: t(24) = 18.95; SD = 0.18; p = 6.07 × 10−16) and temporally anticorrelated (1-sample t test: t(24) = −3.97; SD = 0.33; p = 5.632 × 10−4) across 5 min imaging sessions (n = 24). D, Schematic depiction of how NE synchrony (sliding correlation of local and global NE in 30 s windows) is related to distance to release. Distance to release is computed separately for each local NE field and is the distance (in microns) to the closest release event to that local field at each time point. E, Logarithmic regression results predicting NE synchrony with distance to release (top) or reuptake (bottom) demonstrate asynchrony close to local NE release/reuptake sites and relatively higher levels of synchrony in the absence of a proximal release/reuptake site. For release, this relationship holds under saline conditions, but not under desipramine conditions. For reuptake, this relationship is not affected by pharmacological manipulation. Models were fitted for the NE synchrony time series of n = 326 local NE fields. Coefficients were significant to the α = 0.05 significance level in 70% of models for saline (release), 63% of models for saline (reuptake), 60% of models for desipramine (release), and 73% of models for desipramine (reuptake). The average of all models is shown.

Update of

Similar articles

Cited by

References

    1. Agster KL, Mejias-Aponte CA, Clark BD, Waterhouse BD (2013) Evidence for a regional specificity in the density and distribution of noradrenergic varicosities in rat cortex. J Comp Neurol 521:2195–2207. 10.1002/cne.23270 - DOI - PMC - PubMed
    1. Allen WE, Kauvar IV, Chen MZ, Richman EB, Yang SJ, Chan K, Gradinaru V, Deverman BE, Luo L, Deisseroth K (2017) Global representations of goal-directed behavior in distinct cell types of mouse neocortex. Neuron 94:891–907.e6. 10.1016/j.neuron.2017.04.017 - DOI - PMC - PubMed
    1. Arnsten AFT, Wang MJ, Paspalas CD (2012) Neuromodulation of thought: flexibilities and vulnerabilities in prefrontal cortical network synapses. Neuron 76:223–239. 10.1016/j.neuron.2012.08.038 - DOI - PMC - PubMed
    1. Aston-Jones G, Bloom FE (1981) Activity of norepinephrine-containing locus coeruleus neurons in behaving rats anticipates fluctuations in the sleep-waking cycle. J Neurosci 1:876–886. 10.1523/JNEUROSCI.01-08-00876.1981 - DOI - PMC - PubMed
    1. Aston-Jones G, Cohen JD (2005) An integrative theory of locus coeruleus-norepinephrine function: adaptive gain and optimal performance. Annu Rev Neurosci 28:403–450. 10.1146/annurev.neuro.28.061604.135709 - DOI - PubMed

LinkOut - more resources