. 2024 May 3;15(1):3745.
doi: 10.1038/s41467-024-47945-7.

A human neural crest model reveals the developmental impact of neuroblastoma-associated chromosomal aberrations

Affiliations

A human neural crest model reveals the developmental impact of neuroblastoma-associated chromosomal aberrations

Ingrid M Saldana-Guerrero et al. Nat Commun. .

Abstract

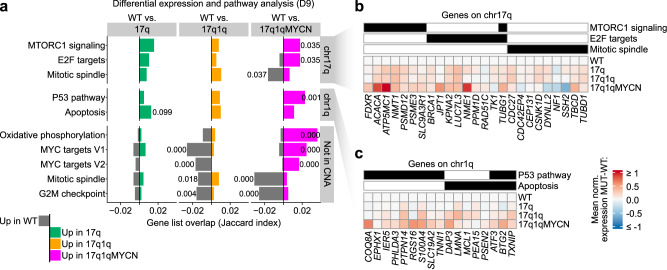
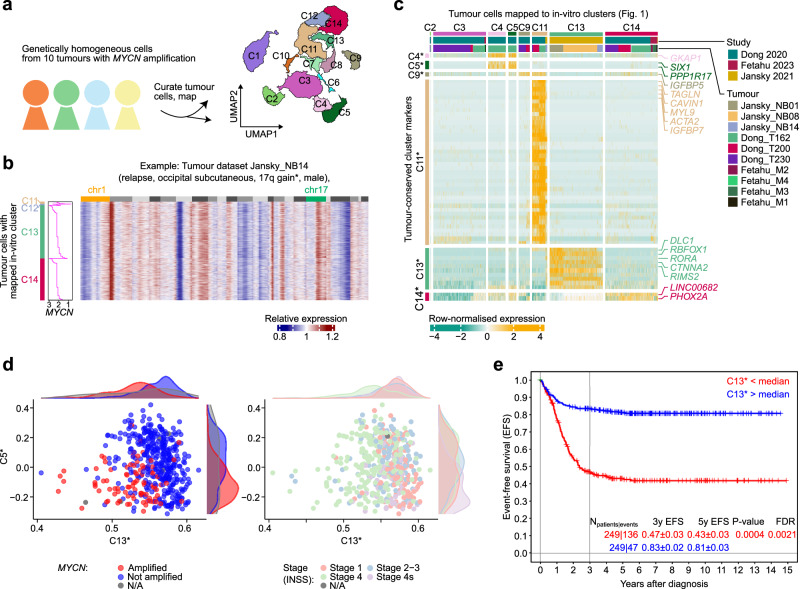
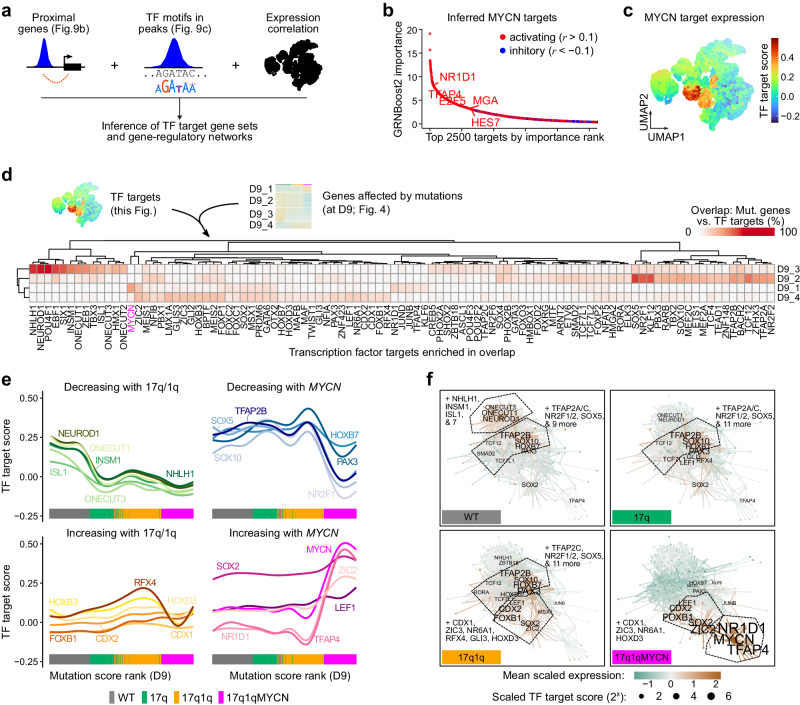
Early childhood tumours arise from transformed embryonic cells, which often carry large copy number alterations (CNA). However, it remains unclear how CNAs contribute to embryonic tumourigenesis due to a lack of suitable models. Here we employ female human embryonic stem cell (hESC) differentiation and single-cell transcriptome and epigenome analysis to assess the effects of chromosome 17q/1q gains, which are prevalent in the embryonal tumour neuroblastoma (NB). We show that CNAs impair the specification of trunk neural crest (NC) cells and their sympathoadrenal derivatives, the putative cells-of-origin of NB. This effect is exacerbated upon overexpression of MYCN, whose amplification co-occurs with CNAs in NB. Moreover, CNAs potentiate the pro-tumourigenic effects of MYCN and mutant NC cells resemble NB cells in tumours. These changes correlate with a stepwise aberration of developmental transcription factor networks. Together, our results sketch a mechanistic framework for the CNA-driven initiation of embryonal tumours.


Conflict of interest statement

P.W.A. is a member of the Scientific Advisory Board of TreeFrog Therapeutics and receives royalties from the Wistar Institute for antibody sales. All other authors declare no competing interests.

Figures

Fig. 1
Fig. 1. In-vitro culture efficiently generates human trunk NC cells and their sympathoadrenal derivatives from hESCs.
a Diagram depicting (top) the extrinsically supplemented signals employed to direct hESCs toward trunk NC cells and their downstream derivatives, sample harvesting time points for scRNA-seq analysis (the colours indicated in this schematic are used throughout the manuscript to refer to the respective days), and immunofluorescence analysis (bottom) of PERIPHERIN protein expression illustrating the generation of sympathetic neurons at D19. Cell nuclei were counterstained using Hoechst 33342. All experiments were repeated at least three times with similar results. b UMAP of scRNA-seq data from wild-type hESCs collected at 9 stages (indicated by different colours) of differentiation to trunk neural crest and sympathoadrenal derivatives. Cells were divided into 14 distinct clusters as indicated by the contours. c Heatmap of gene markers for each cluster in (b). Selected genes have been highlighted and UMAPs indicate the expression level of canonical markers for stem (POU5F1), neural crest (SOX10), mesenchymal (FN1), and sympathetic (PHOX2B) cells. All marker genes are reported in Supplementary Data 2. d UMAP as in (b), labelled by their closest matching cell type from the human embryonic adrenal gland reference via label transfer. Cells in grey could not be verified with markers (Supplementary Fig. 2i) or could not be assigned to a single type. e Cells from panel d coloured by the strength of their SCP marker signature (Seurat module score) in red. The score distinguishes a cluster of early SCP-like/trunk NC (low score) and a late cluster with more mature SCP-like cells (high score). f Same as above but visualising simultaneously SYM (orange) and MES (teal) marker signature. Cells with overlapping marker signatures appear in grey tones, with the highest mixture in C12. An early diverging cluster of sensory neuron-like cells has a weak match to the SYM signature. A pseudotime trajectory for the MES-SYM transition in clusters C11-C14 can be found in Supplementary Fig. 3. Source data are provided as a Source Data file. hESC, human embryonic stem cells; D0/3/6/9/10/12/14/19/28, day 0/3/6/9/10/12/14/19/28; UMAP Uniform Manifold Approximation and Projection, C1-C14 cell clusters, SCP Schwann cell precursor, SYM sympathoblast, MES mesenchymal.
Fig. 2
Fig. 2. Copy number alterations and overexpression of MYCN impair the specification of trunk NC derivatives.
a Scheme depicting the different hESC genetic backgrounds employed, the time points of sample collection, and the timing of DOX-induced MYCN overexpression during trunk NC differentiation. b scRNA-seq data from mutant cells (17q, 17q1q, 17q1qMYCN at D9, D14, and D19; coloured by stage) were mapped to the WT reference (cp. Fig. 1; undifferentiated hESC cluster C0 was excluded for simplicity). Glasswork UMAP plots depicting the destination clusters of mapped cells. Fewer 17q1q and 17q1qMYCN cells mapped to late stages (highlighted by arrows). c Alluvial plots comparing the stage at which each mutant cell was harvested versus its transcriptionally closest stage in the WT reference (based on label transfer as in b). In each subplot, the top bar indicates the proportion of cells collected at each stage (D9, D14, D19). The bottom bar indicates the distribution of matches for the same cells in WT, and streams indicate which subpopulations flow into cognate or non-cognate WT stages. The plots suggest that cells from 17q1q/17q1qMYCN mapped to earlier stages compared to WT. d Glasswork UMAPs of mapped 17q, 17q1q, and 17q1qMYCN cells (as in b) coloured by closest-matching cell type in an adrenal gland reference. The category “other” comprises other cell types in the reference dataset and mappings that could not be validated by cell type markers (Supplementary Fig. 2i). e Percentage of cells mapped to each cell type in (d), split by cell line. f Violin plots indicating the strength of the SCP/SYM/MES (left to right) signature (Seurat module score) for cells mapped to the respective cell type, split by cell line. g Plot indicating the change in mean expression (colour) and the percentage of cells expressing the gene (size) for each gene in the signatures from panel e relative to WT. WT squares (size = 1, white) are shown for reference. h Flow cytometric analysis of trunk NC markers HOXC9 and SOX10 of WT, 17q, 17q1q, and 17q1qMYCN at D9. All experiments were repeated at least three times with similar results. Source data are provided as a Source Data file. WT wild-type H7 hESCs; D0/6/3/9/10/12/14/19/28, day 0/6/3/9/10/12/14/19/28; UMAP Uniform Manifold Approximation and Projection, SCP Schwann cell precursor, SYM sympathoblast, MES mesenchymal.
Fig. 3
Fig. 3. Copy number alterations and MYCN overexpression influence cancer-associated pathways.
a We performed differential expression analysis between WT and mutant cells at D9 (two-sided tests using DESeq2 and aggregated pseudobulk counts per replicate; P values were corrected for multiple hypothesis testing using the Benjamini-Hochberg method; Padj ≤ 0.05, |log2FoldChange| > 0.25) and summarised differentially expressed genes (DEG) using pathway enrichment analysis. Enrichment was determined by hypergeometric tests (hypeR, background: all detected genes in our scRNA-seq dataset) using pathways from MSigDB. The overlap between up- and down-regulated DEGs with the pathway genes is indicated as a positive (green/orange/magenta colour bars) or negative (grey colour) number, respectively. We additionally distinguished between DEGs located on chromosome arms chr17q, chr1q, or anywhere else in the genome to analyse potential direct and indirect effects of CNAs (split from top to bottom). All adjusted P values for enriched terms are shown (Padj ≤ 0.1; P values were adjusted for multiple hypothesis testing using the Benjamini-Hochberg method). Selected pathways are shown in the figure and all DEGs and pathway enrichments are available in Supplementary Data 6 and 7. DEGs located on chr17q (b) and chr1q (c) from the enriched pathways in (a). The heatmap indicates the mean normalised expression difference between each indicated mutant cell line and WT (at D9). The annotation bars on top of the heatmaps indicate membership (black colour) of genes in the selected pathways (MSigDB hallmark database). Source data are provided as a Source Data file. WT, wild-type H7 hESCs; MUT, a mutant hESC line (17q, 17q1q, or 17q1qMYCN); D9, day 9.
Fig. 4
Fig. 4. Neuroblastoma-like genetic aberrations cumulatively distort trunk NC differentiation.
a Top: UMAP of scRNA-seq data from WT and mutant hESCs (indicated by colour) throughout differentiation. Bottom: the same dataset coloured by closest-matching cell type in an adrenal gland reference. The category “other” comprises other cell types in the reference dataset and mappings that could not be validated by cell type markers (Supplementary Fig. 2i). b Illustration (top) of the calculation of mutation scores m as average score of each cell’s neighbours (k-nearest neighbour average). In this calculation, each neighbour weighs in by its cell line (0 = WT, 1/3 = 17q, 2/3 = 17q1q, 1 = 17q1qMYCN) such that the mutation score allows ordering cells from WT to MYCN mutation. Only cells from D9, D14, and D19 were used, for which data from all conditions were available. The actual scores are shown overlaid on the UMAP from panel a (bottom). c Heatmap showing the expression of the top genes correlated with the mutation score (from b) across all cells from D9. Genes have been divided into four groups by hierarchical clustering, and selected TFs, receptors, and ligands are highlighted in different colours. All correlated genes are reported in Supplementary Data 9. Genes located on chr17q or chr1q are indicated. Source data are provided as a Source Data file. WT, wild-type H7 hESCs; D9/14/19, day 9/14/19; UMAP Uniform Manifold Approximation and Projection, m mutation score, TF transcription factor, SCP Schwann cell precursor, SYM sympathoblast, MES mesenchymal.
Fig. 5
Fig. 5. Impaired trunk NC specification correlates with acquisition of tumourigenic hallmarks.
a Representative brightfield images of D14 cultures following differentiation of hESCs with the indicated genotypes. All experiments were repeated at least three times with similar results. b Flow cytometric analysis of cell cycle in D9 cultures of each cell line. Top: Representative FACS plots. Bottom: Percentage of cells in each cell cycle stage. G1 (17q vs. 17qMYCN, p = 0.0266 = *; 17q1q vs. 17q1qMYCN, p = 0.0153 = *), S (17q vs. 17qMYCN, p = 0.0233 = *; 17q1q vs. 17q1qMYCN, p = 0.0073 = **). Only comparisons examining the effect of MYCN overexpression in different backgrounds are shown. c Immunofluorescence analysis of the cell proliferation marker KI-67 (green) in D14 cultures of each cell line. Cell nuclei were counterstained using Hoechst 33342 (blue). Left: Representative images. Right: Percentage of KI-67-positive cells. 17q vs. 17qMYCN, p = 0.0078 = **; 17q1q vs. 17q1qMYCN, p = 0.0001 = ***. d Low-density plating of D9 cultures of each cell line (n = 3 biological replicates). Left: Representative brightfield images after 84 h. Right: Number of colonies counted after 5 days. 17q1q vs. 17q1qMYCN, p = 0.0109 = *. bd Bar plots showing the mean of n = 3 biological replicates (error bars = SD). Statistical analysis was performed using ordinary two-way (b, c) or one-way (d) ANOVA with Tukey correction. Only comparisons examining the effect of MYCN overexpression in different backgrounds are shown. e Phylogenetic tree indicating the genetic relationship and distance (number of SNVs detected by whole-exome sequencing) between different hESC lines before (D0) and after differentiation (D19). Node shape indicates samples without a MYCN overexpression cassette (unfilled circles), with an inactive cassette (filled circles), and with an activated (by addition of DOX from D5 onwards) cassette (filled squares). The colours match those used elsewhere in the paper, without specific meaning. Short distances (<10 mutations) between differentiated cells and the shared ancestor with the matching D0 samples suggest that few additional mutations occurred during differentiation. Supplementary Data 4 and 5 report SNVs/CNAs identified in our analyses. Source data are provided as a Source Data file. D0/5/14/19, day 0/5/14/19; WT, wild-type H7 hESCs, SD standard deviation, SNV single-nucleotide variant, CNA copy number alteration.
Fig. 6
Fig. 6. hESC-derived trunk NC cells with CNAs form tumours in mice upon MYCN overexpression.
a Left: Representative images of subcutaneous xenografts of trunk NC cells derived from the indicated cell lines in the presence (17q1qMYCN) and absence (WT, 17q1q) of DOX treatment. Right: Graph showing tumour growth per mouse corresponding to xenografts of indicated cell lines (n = 6 animals per cell line). b Left: Representative MRI sections of mice at week 5 following xenografting of indicated cell lines in the adrenal gland and DOX treatment regimens. The white lines indicate the tumour perimeter. Right: Graph showing survival of the recipient animals after xenografting (n = 3 animals per cell line). c Summary of mouse xenograft experiments. Source data are provided as a Source Data file. DOX doxycycline, MRI magnetic resonance imaging.
Fig. 7
Fig. 7. Comparison to hESC-based trunk NC differentiation resolves structured heterogeneity across neuroblastoma tumours.
a We curated tumour cells from 10 MYCN-amplified NB samples,, from three studies and mapped them onto our WT in-vitro reference (cp. Fig. 1). Mapping is represented as cells in each cluster of the reference (depicted as contours). b Heatmap depicting relative gene expression in dataset Jansky_NB14. Values are inferCNV copy number estimations per gene, relative to haematopoietic cells ordered by genomic position and chromosome (1–22). Cells (one per row) are ordered by the respective cluster that they were mapped to (C11 to C14) and therein by MYCN expression levels (depth-normalised sliding window average, width = 20 cells). Mappings of other datasets are shown in Supplementary Fig. 11. c Heatmap showing markers from gene expression signatures C4*, C5*, C9*, C13*, and C14* (rows, top to bottom) in cells from 10 tumour datasets that were mapped to our in-vitro reference (cp. a). Each signature is the intersection of the cluster markers in our reference (as in Fig. 1) and differentially expressed genes between the respective tumour cells. Markers for tumour cells mapped to C2 and C3 showed no overlap with in-vitro cluster markers; hence, only mapped cells are shown. All genes identified in this analysis are reported in Supplementary Data 10. d Scatterplots evaluating the strength of signatures C5* and C13* (from c; calculated using GSVA) in bulk RNA-seq data from SEQC,. Each dot indicates one tumour dataset coloured by MYCN amplification status (left) or clinical stage (right). The density of points (kernel density estimate) in each group is indicated in the margins. e Survival analysis for data from the SEQC cohort stratified by strength of the C13* signature. Groups were split by the median. Cox regression adjusted for age-group (<18, 18–60, or >60 months), INSS stage 4 (yes/no), and MYCN amplification (yes/no). n = 249 patients per group, or 136 [C13* low] and 47 [C13* high] events. All results are reported in Supplementary Data 11. Source data are provided as a Source Data file. UMAP Uniform Manifold Approximation and Projection, EFS event-free survival, INSS International Neuroblastoma Staging System, FDR false discovery rate.
Fig. 8
Fig. 8. Copy number alterations and MYCN overexpression disrupt chromatin reconfiguration during trunk NC differentiation.
a ATAC-seq read coverage for WT cells at three example loci. The area reports the normalised read count aggregated per genomic bin (width = 500 bp). Multiple semi-transparent plots are overlaid for each replicate. Genes within each locus are shown on top with thin/thick lines indicating introns/exons. The arrows next to gene names indicate the direction of transcription. Selected peaks have been highlighted manually (dashed orange lines). b ATAC-seq read coverage of WT and mutant cells at D19 near the PHOX2B locus. Plots as in (a). c Principal component analysis of all ATAC-seq datasets, split by condition. Each data point represents one ATAC-seq sample with the shape indicating the stage at which the sample was collected. The geometric means of all data of the same stages are connected by arrows to visualise the stepwise chromatin changes. d Euler diagram visualising the overlap of differentially accessible regions in mutant hESC-derived trunk NC derivatives compared to WT (DEseq2; Padj ≤ 0.005, |log2FoldChange| ≥ log2(1.5)). Numbers indicate the total number of regions per cell line aggregated over all stages. Source data are provided as a Source Data file. D0/3/9/14/19, day 0/3/9/14/19; WT, wild-type H7 hESCs.
Fig. 9
Fig. 9. Differentiation of wild-type and mutant hESCs is associated with changes in distinct chromatin modules.
a Heatmaps showing normalised read counts for all DARs (columns) in any pairwise comparison of two stages or conditions (DEseq2; two-sided tests, P values adjusted for multiple hypothesis testing using the Benjamini-Hochberg method; Padj ≤ 0.005, |log2FoldChange| ≥ log2(1.5); ntotal = 45,583). Regions have been divided into nine non-overlapping modules (R1–R9) by hierarchical clustering. Three annotation columns are shown to the right indicating regions called down- (blue) and up-regulated (red) in each condition. All DARs are reported in Supplementary Data 12 and 13. b Comparisons of regions belonging to the nine chromatin modules (from a) and proximal cluster markers defined in our scRNA-seq analysis (cp. Fig. 1). An enrichment analysis was performed using hypergeometric tests (hypeR; background: all genes associated with at least one ATAC-seq peak) and the size and transparency of circles indicate the odds ratio and P value, respectively. Significant results are indicated with filled circles (P values adjusted for multiple hypothesis testing using the Benjamini-Hochberg method; Padj ≤ 0.005). All results are shown in the figure, and reported in Supplementary Data 14. c Enrichment analysis for overlaps between chromatin modules and known TF motifs (HOCOMOCO database, v11). Statistical tests and plots are as in (b), with the exception that only overlaps with Padj ≤ 0.0000001 and |log2FoldChange| ≥ log2(2) were marked as significant (background: all peaks with at least one motif match). The top results per module are shown and all results are reported in Supplementary Data 14. d Enrichment analysis of overlaps between regions belonging to the nine chromatin modules and super-enhancers specific to certain NB epigenetic subtypes,, (background: all peaks with at least one overlapping region annotated in the super-enhancer analyses). Statistical tests and display as in (b). Source data are provided as a Source Data file. D0/9/19, day 0/9/19; WT, wild-type H7 hESCs; MUT a mutant hESC line (17q, 17q1q, or 17q1qMYCN); DAR, differentially accessible region; R1-R9, chromatin region modules; n.s., not significant; TF, transcription factor; NB, neuroblastoma; ADR, adrenergic; MES, mesenchymal; MNA-HR, not MYCN-amplified high-risk; MNA-LR, not MYCN-amplified low-risk.
Fig. 10
Fig. 10. Copy number changes facilitate MYCN-mediated blockage of differentiation via developmental transcription factor networks.
a To define putative target genes of TFs, we linked TF motif matches in ATAC-seq peaks with proximal genes and used GRNboost2 to identify highly correlated TF-to-target gene candidates based on our scRNA-seq data. b Top-2500 predicted targets of MYCN. Putative targets without support in our ATAC-seq data (motif in ≥1 peak near the gene) have been removed. The Pearson correlation coefficient (r) between each TF and target gene determined the direction of the putative interaction (r > 0.1 = activating, r < −0.1 = inhibitory, others = marginal). The top-5 TFs have been highlighted. All results are reported in Supplementary Data 15. c Average expression (Seurat module score) of the MYCN target genes (activated targets from b) in our integrated scRNA-seq dataset (cp. Fig. 4a). d Heatmap displaying the percentage of gene sets D9_1 to D9_4 (correlated with mutation score, cp. Fig. 4b, c) overlapping targets of the indicated TFs. TFs with significant overlaps in at least one comparison are shown (hypergeometric test, hypeR; P values adjusted for multiple hypothesis testing using the Benjamini-Hochberg method; Padj ≤ 0.05, |log2FoldChange| ≥ log2(4), frequency ≥5%). All results are also reported in Supplementary Data 16. e Smoothed line plots evaluating target gene expression (Seurat module score) with increasing mutation scores (from Fig. 4b, c). We curated selected TFs from (d) into groups of TFs losing or gaining activity. The cell line of each data point is indicated at the bottom. f Network diagrams visualising putative TF-to-target relations for enriched TF targets (cp. ce). Each node represents a TF or target gene, and each edge is a TF-to-target link. We made these networks specific to each condition by using colour to indicate the mean scaled expression at D9 (edges coloured by source TF) and node size to indicate the mean scaled TTF target score of each TF. Only labels of TFs with positive scaled expression are shown and selected groups of TFs have been merged for visualisation. A diagram with all node labels is shown in Supplementary Fig. 13c. Source data are provided as a Source Data file. D9, day 9; TF, transcription factor; WT, wild-type H7 hESCs; r, Pearson correlation coefficient.

References

    1. Marshall GM, et al. The prenatal origins of cancer. Nat. Rev. Cancer. 2014;14:277–289. doi: 10.1038/nrc3679. - DOI - PMC - PubMed
    1. Pritchard-Jones K. Genetics of childhood cancer. Br. Med. Bull. 1996;52:704–723. doi: 10.1093/oxfordjournals.bmb.a011578. - DOI - PubMed
    1. Scotting PJ, Walker DA, Perilongo G. Childhood solid tumours: a developmental disorder. Nat. Rev. Cancer. 2005;5:481–488. doi: 10.1038/nrc1633. - DOI - PubMed
    1. Maris JM, Denny CT. Focus on embryonal malignancies. Cancer Cell. 2002;2:447–450. doi: 10.1016/S1535-6108(02)00206-4. - DOI - PubMed
    1. Gröbner SN, et al. The landscape of genomic alterations across childhood cancers. Nature. 2018;555:321–327. doi: 10.1038/nature25480. - DOI - PubMed

Publication types

Substances

Grants and funding