. 2024 May 3;15(1):3749.
doi: 10.1038/s41467-024-47981-3.

CD74 supports accumulation and function of regulatory T cells in tumors

Affiliations

CD74 supports accumulation and function of regulatory T cells in tumors

Elisa Bonnin et al. Nat Commun. .

Abstract

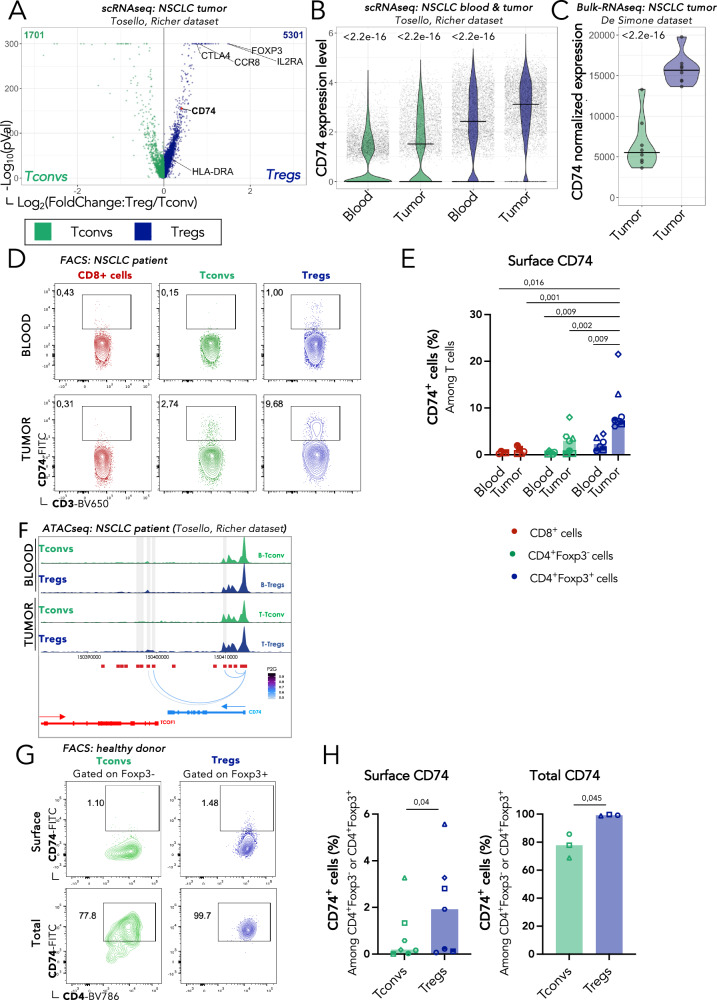
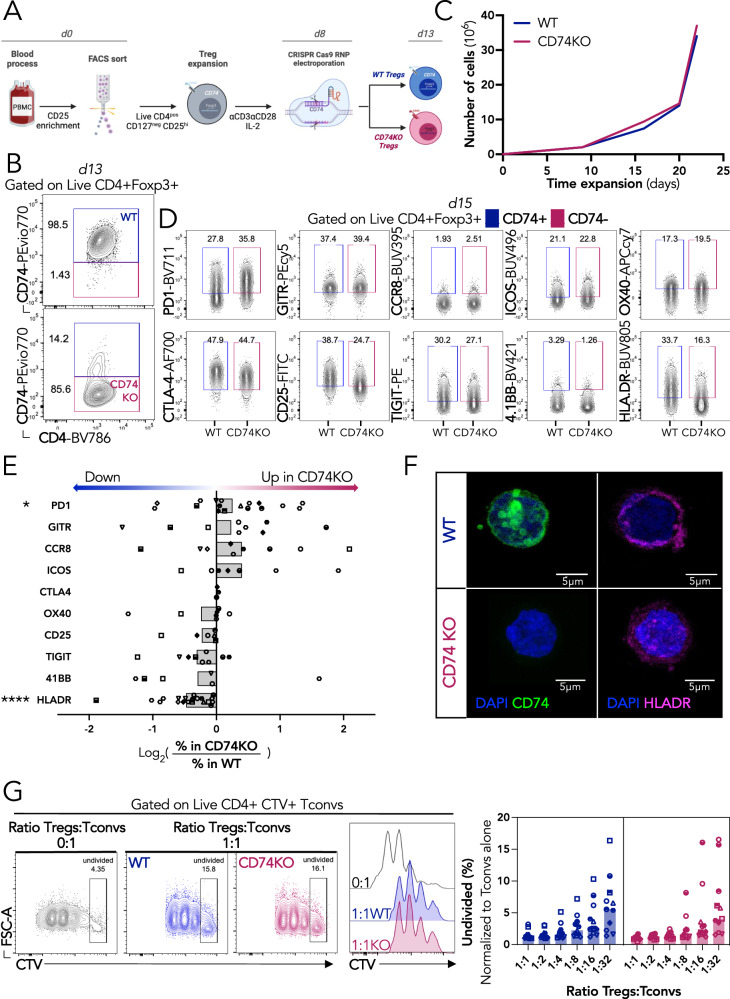
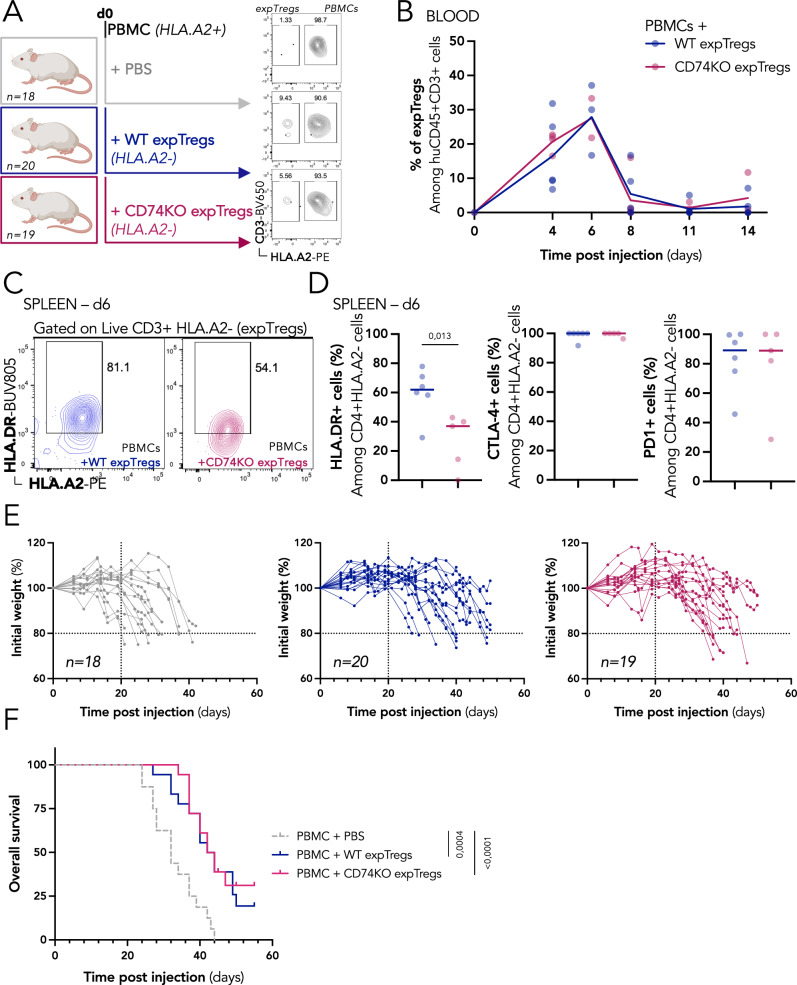
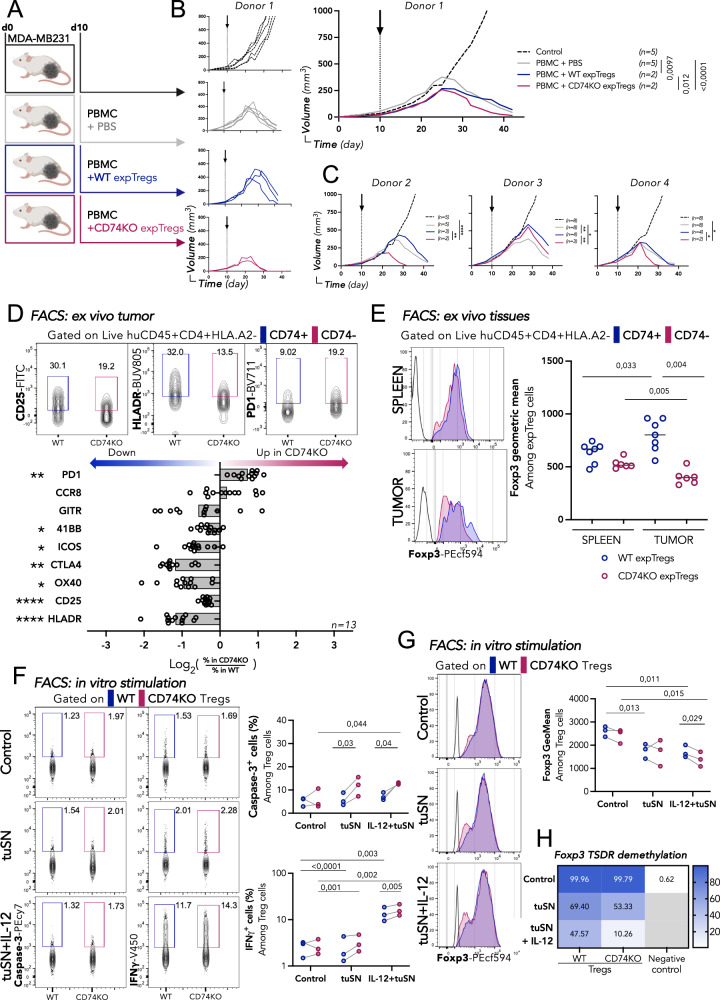
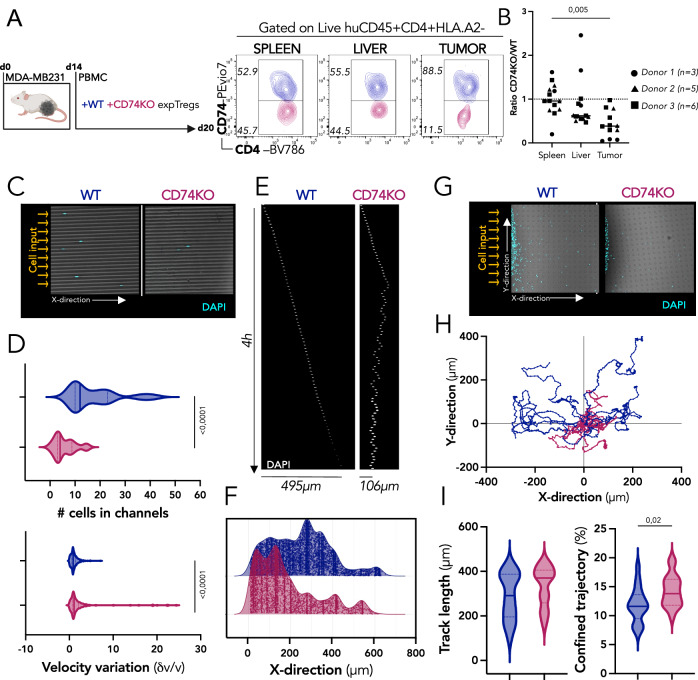
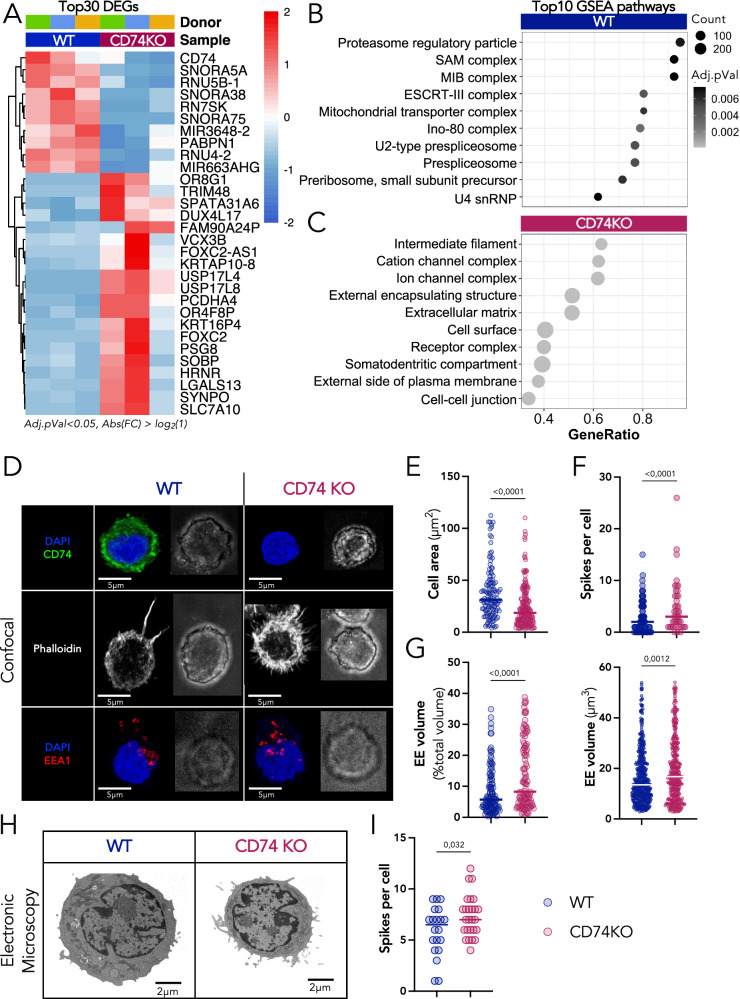
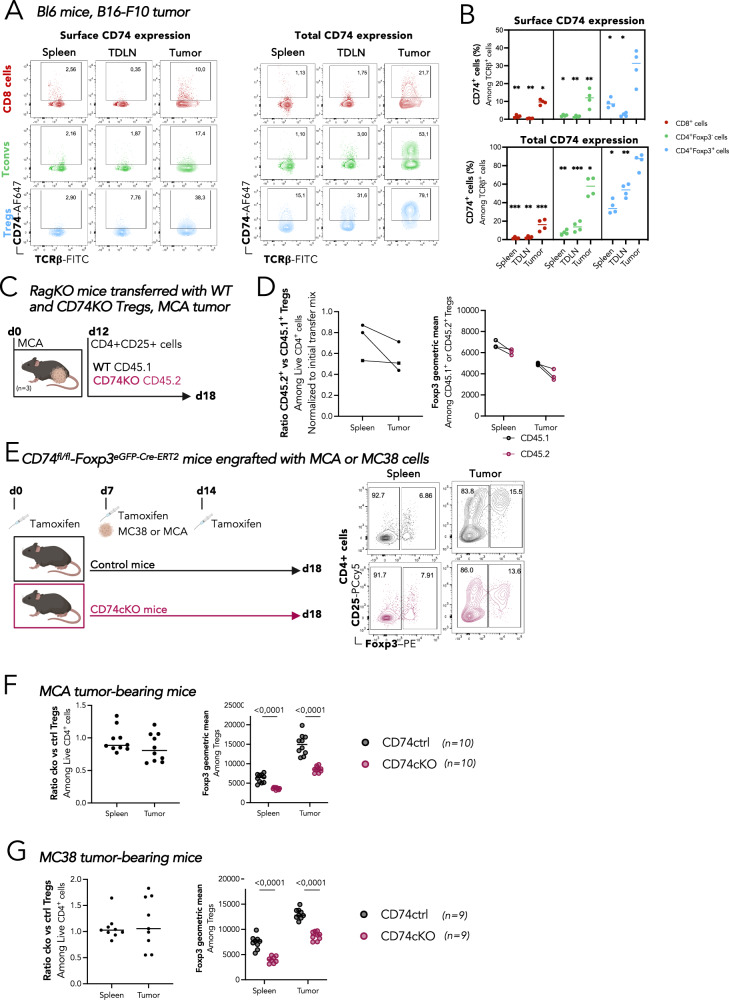
Regulatory T cells (Tregs) are plastic cells playing a pivotal role in the maintenance of immune homeostasis. Tregs actively adapt to the microenvironment where they reside; as a consequence, their molecular and functional profiles differ among tissues and pathologies. In tumors, the features acquired by Tregs remains poorly characterized. Here, we observe that human tumor-infiltrating Tregs selectively overexpress CD74, the MHC class II invariant chain. CD74 has been previously described as a regulator of antigen-presenting cell biology, however its function in Tregs remains unknown. CD74 genetic deletion in human primary Tregs reveals that CD74KO Tregs exhibit major defects in the organization of their actin cytoskeleton and intracellular organelles. Additionally, intratumoral CD74KO Tregs show a decreased activation, a drop in Foxp3 expression, a low accumulation in the tumor, and consistently, they are associated with accelerated tumor rejection in preclinical models in female mice. These observations are unique to tumor conditions as, at steady state, CD74KO-Treg phenotype, survival, and suppressive capacity are unaffected in vitro and in vivo. CD74 therefore emerges as a specific regulator of tumor-infiltrating Tregs and as a target to interfere with Treg anti-tumor activity.


Conflict of interest statement

E.P. is co-founder and consultant for Egle Therapeutics and is share-holders at Mnemo Therapeutics. F.N. and S.L. are employees of Egle Therapeutics. J.T.B. is consultant for Egle Therapeutics. P.E.B. is consultant for Mnemo Therapeutics. The remaining authors declare no competing interests.

Figures

Fig. 1
Fig. 1. CD74 is differentially expressed at the membrane of tumTregs compared with tumTconvs, peripheral Tregs and Tconvs.
A, B Single-cell RNA sequencing (scRNAseq) of CD4+ T cells from blood and tumor of 5 non-small cell lung cancer (NSCLC) patients (from: Tosello, Richer et al., under review, dataset available at EGAS50000000293). A Volcano plot (P value versus fold change) of the gene expression profile of Tregs and Tconvs. Genes highlighted in blue are overexpressed by tumTregs and highlighted in green by tumTconvs. B Violin plots of CD74 expression levels in Tregs and Tconvs from blood-tumor paired samples. C Violin plots of CD74 normalized expression from bulk RNA sequencing data (bulk-RNAseq) from sorted tumor CD4+ Tconvs and Tregs from NSCLC patients (from: De Simone et al. GEO access: GSE40419, design of 87 surgical samples). D, E FACS analysis of CD74 expression in CD8+ cells (red), Tconvs (green), and Tregs (blue) from blood and tumor samples from NSCLC patients (n = 7). Representative dotplots (D) and percentages (E) of cells expressing surface CD74 (gating strategy in Fig. S1C). F Genome track showing peak accessibility of CD74 human gene loci and peak to genes links in Tconvs (green) and Tregs (blue) from single-cell ATACseq analysis of blood and tumor samples from two NSCLC patients (from: Tosello, Richer et al., under review, dataset available at EGAS50000000294). Surface and total FACS analysis of CD74 expression in Tregs and Tconvs from healthy donor (HD) PBMCs. Representative dotplots (G) and percentages (H) of surface (left, n = 7) and total (right, n = 3) expression of CD74 in Tregs (blue) and Tconvs (green). Statistical analyses are performed using unpaired t-test for tumTregs (B, C) or paired t-test between donor (E, H). p values are shown on the graphs. Source data are provided as a Source Data file.
Fig. 2
Fig. 2. CD74 is not required for Treg survival, phenotype, and suppressive capacity in vitro.
A FACS-sorted Tregs are expanded for 8 days and electroporated with two CRISPR-Cas9 RNPs targeting CD74 at exon 5 and exon 6 (CD74KO) or with a control RNP (WT). Electroporated Tregs are expanded and activated for further characterization. B Representative dotplots of CD74 intracellular expression 5 days after electroporation (d13) for CRISPR-Cas9 deletion (n = 35 different donors with paired WT and CD74KO Tregs, gating strategy in Fig. S2A). C Proliferation curve, based on cell count, during expansion of WT and CD74KO Tregs starting after the electroporation (representative curve of one donor out of n = 33 different donors with paired WT and CD74KO Tregs). D, E WT and CD74KO Tregs are stained for Treg-activation markers 7 days after electroporation (d15) and analyzed by FACS to evaluate phenotypic changes. D Representative dotplots of Treg-markers expression in concatenated WT and CD74KO Tregs from the same donor (concatenation on the similar number of pure Tregs, WT, and CD74KO Tregs represent each 50%). E Ratio of the percentage of positive cells for each marker in CD74KO vs WT Tregs (D, E n represents different donors, n = 3 for CTLA-4, n = 6 for 4-1BB and CD25, n = 7 for OX40 and ICOS, n = 9 for TIGIT, GITR and CRR8, n = 17 for PD1). F Confocal images of a z-stack projection of WT and CD74KO Tregs stained for DAPI (blue), CD74 (green), and HLA-DR (magenta). Representative images of staining performed on 3 donors with paired WT and CD74KO Tregs. G Suppressive capacity of WT and CD74KO Tregs is assessed by co-culture with CTV-stained Tconvs at different ratios of WT or CD74KO Tregs. Dotplots and histograms of CTV staining representing the proliferation of Tconvs alone (gray), with WT Tregs (blue) or with CD74KO Tregs (red); and percentage of undivided Tconvs with different concentrations of WT Tregs (blue) or CD74KO Tregs (red) (n = 11, different donors with paired WT or CD74KO Tregs). Statistical analyses are performed using a paired t-test; with p values shown as asterisk to maintain readability, p = 0,027 for PD1 (E). Source data are provided as a Source Data file. A was created with BioRender.com.
Fig. 3
Fig. 3. CD74-deficient Tregs conserve their suppressive function in vivo in a xeno-GvHD model.
A To induce xeno-GvHD, PBMCs (HLA.A2+) are injected intravenously in immunodeficient NSG mice alone (gray, n = 18) or together with WT (blue, n = 20), or CD74KO (red, n = 19) expanded Tregs (expTregs, HLA.A2-). Representative dotplots of PBMC-expTreg proportion among huCD45 + CD3+ cells. B Detection of WT (blue, n = 5) and CD74KO (red, n = 5) expTregs in the blood of mice injected with PBMCs and expTregs at early timepoints, percentage of HLA.A2- cells among huCD45 + CD3+ cells by FACS. C, D Splenocytes are stained for activation markers of Tregs 6 days after cell injection. Representative dotplots of HLA.DR surface expression in WT and CD74KO expTregs (gating strategy in Fig. S3A). C and quantification of cells expressing HLA.DR, CTLA-4, and PD1 in WT or CD74KO expTregs from n = 6 or n = 5 mice, respectively (D). E Individual weight-loss curves for the three groups of mice, calculation based on the initial weight of mice at the day of T-cell injection. F Survival curves for the same 3 groups of mice. Statistical analyses are performed using an unpaired t-test (D); or using a Mantel-Cox test (F); p values are shown on the graphs. Source data are provided as a Source Data file. A was created with BioRender.com.
Fig. 4
Fig. 4. CD74 promotes activation and accumulation of Tregs specifically in the tumor.
A MDA-MB231 tumor cells are engrafted subcutaneously in the flank of immunodeficient NSG mice. 10 days later (when tumors are palpable), HLA.A2+ PBMCs are injected intravenously alone (gray) or together with WT (blue), or CD74KO (red) in vitro expanded HLA.A2- Tregs (expTregs), a group of mice is not injected as a control (black). B Individual (left) and median (right) tumor-growth curves for each group of mice injected with one representative donor of expTregs. C Median of tumor-growth curves with 3 additional donors. D, E 6 days after T-cell injection, splenocytes, and tumor-derived cells are stained for activation markers of Tregs. D Representative dotplots of CD25, HLA-DR and PD1 surface expression in concatenated samples of WT (n = 7) and CD74KO (n = 6) tumor expTregs (top), (gating strategy in Fig. S4B), and quantification of the markers in expTregs, represented as the ratio among CD74KO versus WT expTregs (bottom). E Representative histograms (left) and quantification (right) of Foxp3 level in WT (blue) (n = 7) or CD74KO (red) (n = 6) expTregs from spleens and tumors recovered 6 days after T-cell transfer. FH CD74KO and WT Tregs (n = 3 donors) were cultured with αCD3αCD28-coated beads and IL-2 (1000 IU/mL) for 72 h (control), and further cultured with MDA-MB231 derived supernatant (tuSN) alone, or together with IL-12 (20 ng/mL) for 24 h before analysis. F Representative dotplots (left) and quantification (right) of Caspase−3 and IFNγ expression in WT or CD74KO expanded Tregs. G Representative histograms (left) and quantification (right) of Foxp3 level in WT or CD74KO expanded Tregs. H Percentage of Foxp3 TSDR DNA methylation in WT or CD74KO expanded Tregs, and CD4+ cells (negative control). Statistical analyses are performed using an unpaired t-test (BE) and paired multiple t-test (F, G). p values are shown on the graphs except when asterisk maintain readability with p Value <*:0,1; **:0,01; ***:0,001; ****:0,0001 (C, D). For D, exact p values are: PD1 (0,021), CCR8 (0,69), GITR (0,11), 4-1BB (0,04), ICOS (0,01), CTLA4 (0,0013) and OX40 (0,009). Source data and exact p values (C) are provided as a Source Data file. A was created with BioRender.com.
Fig. 5
Fig. 5. CD74 stabilizes Treg motility by modulating cell speed and maintaining a diffused migration.
A MDA-MB231 tumor cells are engrafted subcutaneously in the flank of immunodeficient NSG mice, and 14 days later, PBMCs, CFSE+ WT expTregs, and CTV+ CD74KO expTregs are injected intravenously. Six days later, spleens, livers, and tumors are analyzed by FACS. The representative dotplots for each tissue display the proportion of WT cells (blue) and CD74KO cells (red) among total expTregs (gating strategy in Fig. S4B). B Ratio of numbers of CD74KO versus WT cells among expTregs in spleen, liver, and tumor. CI FACS-sorted Tregs from 3 donors are expanded for 7 days and electroporated with two CRISPR-Cas9 RNPs targeting CD74 (CD74KO) or one control RNP (WT). Electroporated cells are expanded and activated for 14 days and WT and CD74KO Tregs are loaded into microchannel or micropillar gels. C Examples of images on a 10× objective of microchannels loaded with DAPI-stained WT and CD74KO Tregs. D Quantification of the number of cells entering microchannels (top) and variation in speed (bottom) of WT and CD74KO Tregs. E Sequential images of cell displacement in a channel (one row for each frame, t = 3 min). F Cell density in the microchannels, calculated by the further distance reached by every cell. G Examples of images on a 10x objective of micropillar gels loaded with DAPI-stained WT and CD74KO Tregs. H Trajectory of the top16 longest trajectory of WT (blue) and CD74KO (red) Tregs. I Quantification of the trajectory length of Tregs (left) and percentage of time spent in confined displacement of each cell (right). B Statistical analyses are performed using a paired t-test and p value is shown on the graph. CI Pooled data of the 3 donors, statistical analyses are performed using an unpaired t-test and p values are shown on the graphs. Source data are provided as a Source Data file. A was created with BioRender.com.
Fig. 6
Fig. 6. CD74 contribution to the transcriptome and cellular morphogenesis of Tregs.
AC FACS-sorted Tregs from 3 donors are expanded for 7 days and electroporated with two CRISPR-Cas9 RNPs targeting CD74 (CD74KO) or one control RNP (WT). Electroporated cells are expanded for 14 days and the RNA from WT and CD74KO Tregs are harvested to perform a bulk-RNA sequencing A Supervised clustering heatmap showing the expression of the 30 most differentially expressed genes for each donor of Tregs, CD74KO versus WT condition. B, C GSEA was performed to assess the specific enrichment of cellular-components in CD74KO compared to WT Treg samples. Bubble plots display the top-10 enriched terms of WT Tregs (B) and CD74KO Tregs (C). The gene list of the differential expressed genes was loaded into the function: gseGO, from the clusterProfiler package. D Confocal images showing the localization of DAPI (blue), CD74 (green), Phalloidin (gray), EEA1 (red) in a z-stack projection of distinct WT and CD74KO Tregs and the corresponding bright-field image. E Measure of the inner-membrane surface based on a z-stack projection with the phalloidin staining. F Count of the number of spikes per cell based on the phalloidin staining. G Percentage of volume occupied by early endosomes in the cell and total volume of early endosomes, analyzed with the EEA1 staining for early-endosome volume and the phalloidin staining for cell volume. H, I WT and CD74KO Tregs from 3 donors are obtained as described previously, cells are fixed to coverslips and analyzed under an electronic microscope. H Representative images for WT and CD74KO Tregs. I Count of the number of protuberances observed on WT and CD74KO Tregs. B The p value cutoff was at 0.05 and no adjustment method was applied. EI Pooled data of 3 donors with paired WT and CD74KO Tregs. For every donor, 5 images were captured with a number of cells varying from 10 to 50 cells per image. The analysis was done by doing a mask of every cell based on the Phalloidin staining. Statistical analyses are performed using an unpaired t-test; p values are shown on the graphs and horizontal lines represent median (EI). Source data are provided as a Source Data file.
Fig. 7
Fig. 7. CD74 favors infiltration into tumors and maintain Foxp3 level in mouse Tregs.
A, B C57BL/6 mice (n = 4) were engrafted with 0.5 × 10⁶ B16-melanoma cells, and 3 weeks later, spleens, tumor-draining lymph nodes and tumors were analyzed by FACS. Representative FACS dotplots among live TCRβ+ cells (A) and quantification (B) of % of cells expressing CD74 at the surface (A left, B top) or total (A right, B bottom) in TCRβ + CD8 + T cells (red), TCRβ + CD4+ Foxp3- Tconvs (green) and Foxp3+ Tregs (blue). C, D RagKO mice (n = 3) were engrafted with 0,5 × 106MCA cells, and 12 days later, a mix of CD4 + CD25+ enriched splenocytes from CD45.1 WT and CD45.2 CD74KO mice was injected i.v. Six days later, spleens and tumors were analyzed by FACS (C) On the left, graph shows the CD45.2+/CD45.1+ Treg cell ratio in spleen or tumor, normalized to the CD45.2+/CD45.1+ Treg cell ratio of the initial transfer mix. On the right, graph shows the geometric mean of Foxp3 among CD45.2+ and CD45.1+ Tregs in spleens and tumors (D). E CD74ctrl or CD74cKO mice were treated with tamoxifen (on day 0, 7, and 14), grafted with murine tumor (MCA or MC38) on day 7 and tissues were analyzed on day 18 by flow cytometry. Ratio of the numbers of Tregs in CD74cKO mice versus the mean of the numbers of Tregs in CD74ctrl mice in spleen and tumor (left); and quantification of Foxp3 level (right) among Tregs in MCA-bearing mice (F) and in MC38-bearing mice (G). Statistical analyses are performed using a paired t-test with tumor-Treg value; p values are shown as asterisk to maintain readability with p value <*:0,1; **:0,01; ***:0,001; ****:0,0001 (B); and a paired t-test comparing control to KO condition with p values shown on the graphs (DG); horizontal lines represent median (BG). Source data and exact p values (B) are provided as a Source Data file. C, E were created with BioRender.com.

References

    1. Jones PP, Murphy DB, Hewgill D, McDevitt HO. Detection of a common polypeptide chain in I-A and I-E sub-region immunoprecipitates. Mol. Immunol. 1979;16:51–60. doi: 10.1016/0161-5890(79)90027-0. - DOI - PubMed
    1. Szaszák M, et al. Identification of the invariant chain (CD74) as an angiotensin AGTR1-interacting protein. J. Endocrinol. 2008;199:165–176. doi: 10.1677/JOE-08-0190. - DOI - PubMed
    1. McCormick PJ, Martina JA, Bonifacino JS. Involvement of clathrin and AP−2 in the trafficking of MHC class II molecules to antigen-processing compartments. Proc. Natl Acad. Sci. USA. 2005;102:7910–7915. doi: 10.1073/pnas.0502206102. - DOI - PMC - PubMed
    1. Gil-yarom N, et al. CD74 is a novel transcription regulator. Proc. Natl Acad. Sci. USA. 2017;114:1–6. doi: 10.1073/pnas.1612195114. - DOI - PMC - PubMed
    1. Faure-André G, et al. Regulation of dendritic cell migration by CD74, the MHC class II-associated invariant chain. Science. 2008;322:1705–1710. doi: 10.1126/science.1159894. - DOI - PubMed

Publication types

MeSH terms

Substances