. 2024 May 3;15(1):3734.
doi: 10.1038/s41467-024-47219-2.

Primordial germ cell DNA demethylation and development require DNA translesion synthesis

Affiliations

Primordial germ cell DNA demethylation and development require DNA translesion synthesis

Pranay Shah et al. Nat Commun. .

Abstract

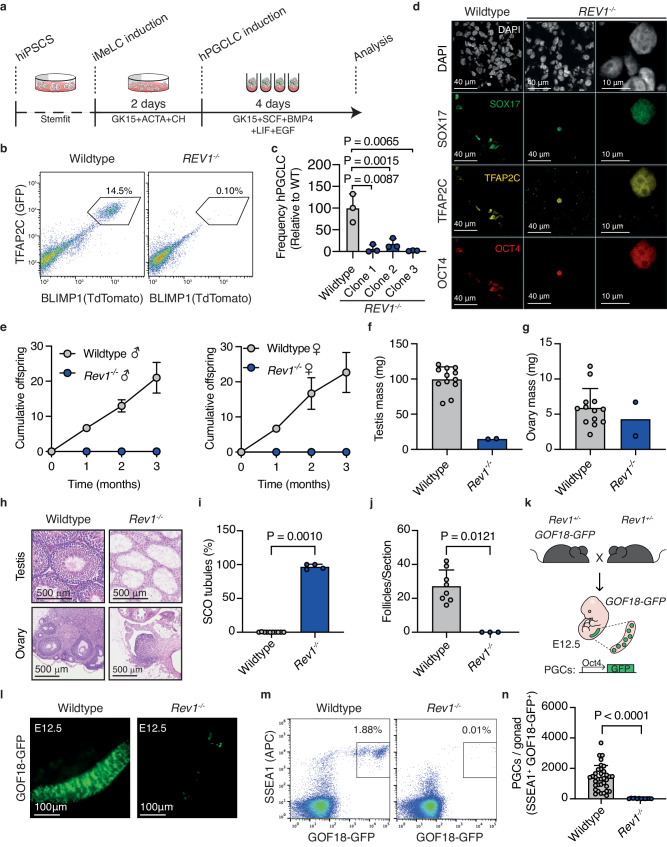
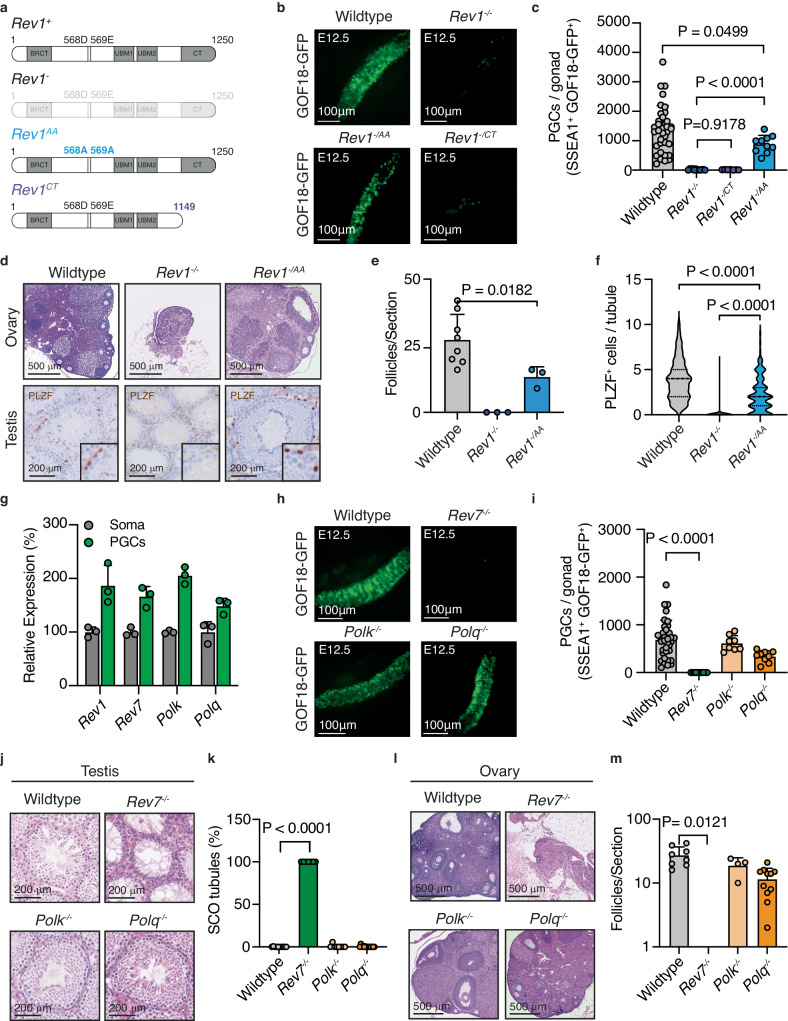
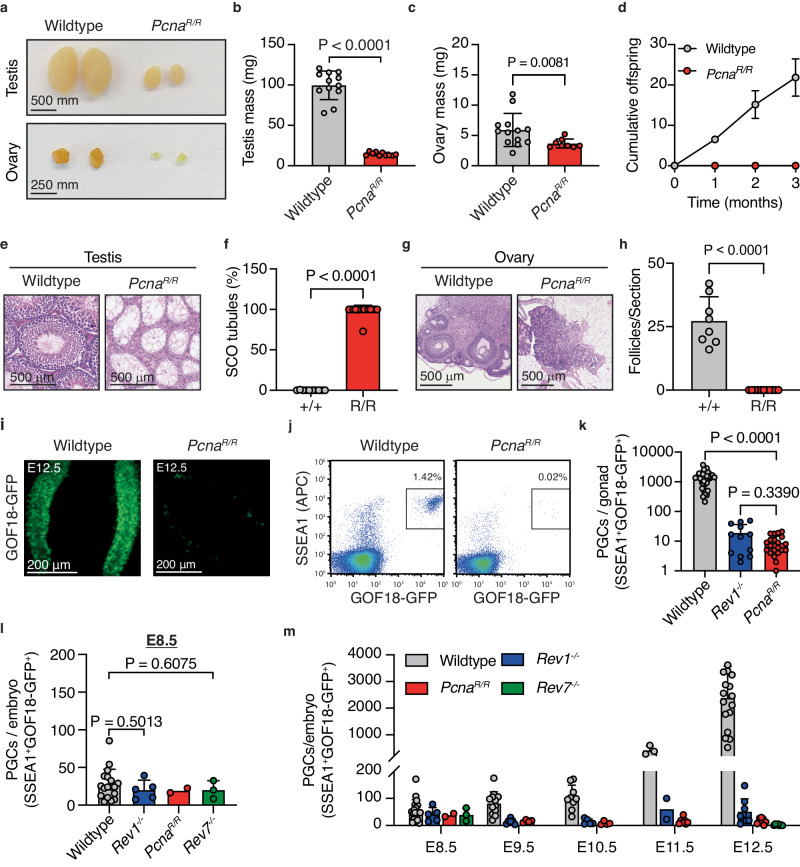
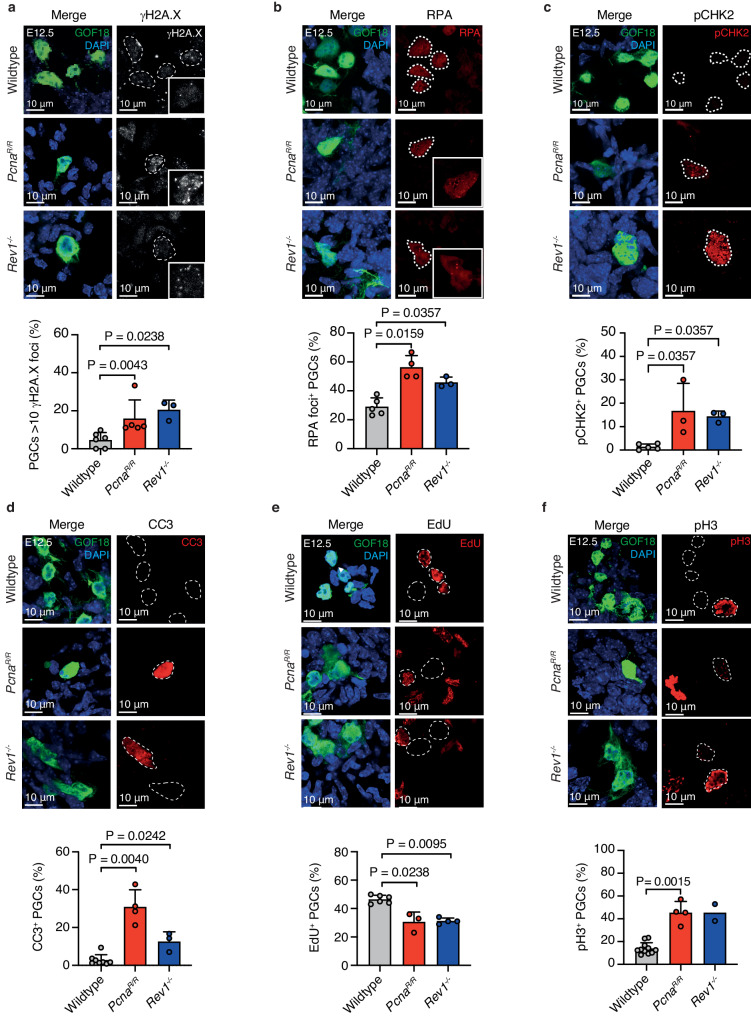
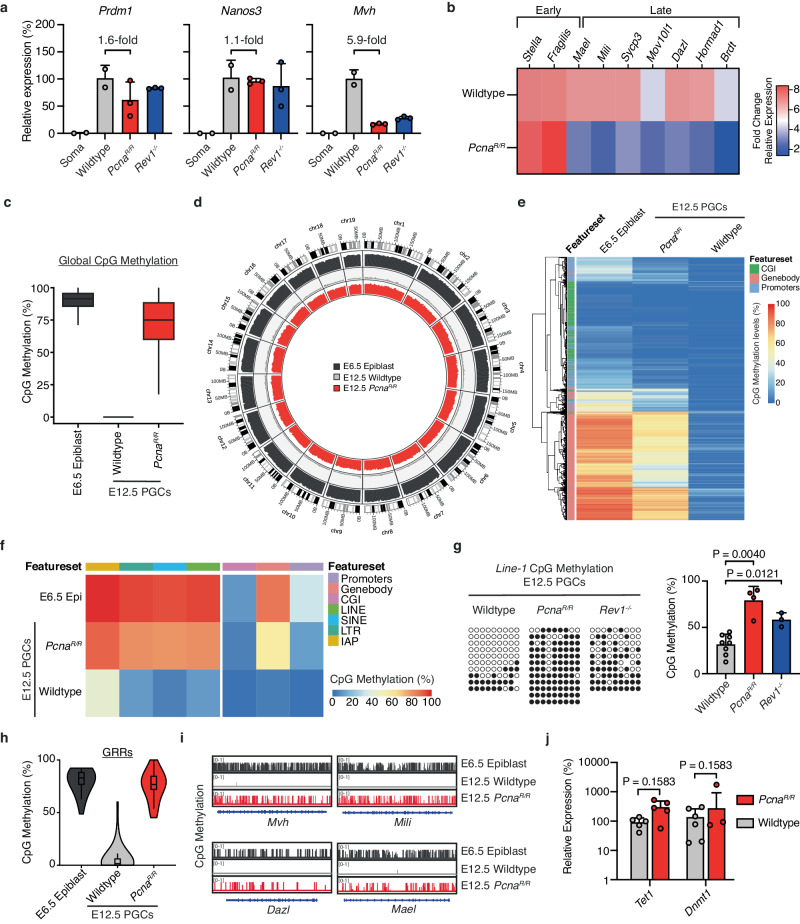
Mutations in DNA damage response (DDR) factors are associated with human infertility, which affects up to 15% of the population. The DDR is required during germ cell development and meiosis. One pathway implicated in human fertility is DNA translesion synthesis (TLS), which allows replication impediments to be bypassed. We find that TLS is essential for pre-meiotic germ cell development in the embryo. Loss of the central TLS component, REV1, significantly inhibits the induction of human PGC-like cells (hPGCLCs). This is recapitulated in mice, where deficiencies in TLS initiation (Rev1-/- or PcnaK164R/K164R) or extension (Rev7 -/-) result in a > 150-fold reduction in the number of primordial germ cells (PGCs) and complete sterility. In contrast, the absence of TLS does not impact the growth, function, or homeostasis of somatic tissues. Surprisingly, we find a complete failure in both activation of the germ cell transcriptional program and in DNA demethylation, a critical step in germline epigenetic reprogramming. Our findings show that for normal fertility, DNA repair is required not only for meiotic recombination but for progression through the earliest stages of germ cell development in mammals.


Conflict of interest statement

S.J.C., A.A. and W.R. are employees of Altos Labs. W.R. is a consultant and shareholder at Biomodal. The remaining authors declare no competing interests.

Figures

Fig. 1
Fig. 1. REV1-deficiency leads to defects in hPGCLC induction and infertility in mice.
a Schematic of the hPGCLC differentiation protocol adapted from. b Representative flow cytometry plots and (c) quantification of hPGCLC frequency at day 4 from three independent wildtype or REV1-/- clones differentiated three times. (Data represent mean and s.d. P values were calculated by a two-tailed Mann–Whitney U-test). d Representative images of wildtype and REV1-/- aggregates immunostained for SOX17, TFAP2C and OCT4. e Offspring when male (left) and female (right) wildtype or Rev1-/- mice were mated with wildtype mates of the opposite sex (n = 6 mice per genotype, 3 per sex. Data represent mean and s.d. P values were calculated by a two-tailed Mann–Whitney U-test). f Quantification of testis mass of 8−12-week-old wildtype and Rev1-/- mice (n = 12, 2, left to right. Data represent mean and s.d. P values were calculated by a two-tailed Mann–Whitney U-test). g Quantification of ovary mass from 8−12-week-old wildtype and Rev1-/- mice (n = 13, 2, left to right. Data represent mean and s.d. P values were calculated by a two-tailed Mann–Whitney U-test). h H&E-stained ovaries and testes seminiferous tubules from 8−12-week-old wildtype and Rev1-/- mice. i Quantification of SCO tubules per section of testis of 8−12-week-old wildtype and Rev1-/- mice (n = 10 and 4 animals, left to right. Data represent mean and s.d. P values were calculated by a two-tailed Mann–Whitney U-test). j Quantification of follicles per section of ovary from 8−12-week-old wildtype and Rev1-/- mice (n = 8 and 3 animals, left to right). Data represent mean and s.d. P values were calculated by a two-tailed Mann–Whitney U-test. k Schematic for generation of Rev1-/- embryos harboring the GOF18-GFP reporter. l GFP fluorescence images of gonads from wildtype and Rev1-/- E12.5 embryos. m Representative flow cytometry plots and (n) quantification of PGCs by flow cytometry from wildtype and Rev1-/- E12.5 embryos (n = 35 and 12, left to right. Data represent mean and s.d. P values were calculated by a two-tailed Mann–Whitney U-test).
Fig. 2
Fig. 2. REV7 is required for PGC development in mice.
a Schematic of wildtype (Rev1+), null (Rev1-), catalytically inactive REV1 (Rev1AA) and C-terminally truncated REV1 (Rev1CT) alleles. b GFP fluorescence images of gonads from wildtype, Rev1-/-, Rev1-/AA and Rev1-/CT E12.5 embryos. c Quantification of PGCs by flow cytometry from wildtype, Rev1-/-, Rev1-/AA and Rev1-/CT embryos at E12.5 (n = 35, 12, 10 and 7, left to right. Data represent mean and s.d. P values were calculated by a two-tailed Mann–Whitney U-test). d H&E-stained ovaries and PLZF-stained testes and quantification (e) of follicles per section of ovary (Data represent mean and s.d. P values were calculated by a two-tailed Mann–Whitney U-test). or (f) frequency of PLZF+ cells per seminiferous tubule of 8−12-week-old wildtype, Rev1-/- and Rev1-/AA mice (the data shown represent the median and interquartile range; n = 150 tubules per genotype, 50 per genotype, P values were calculated by a two-tailed Mann–Whitney U-test). g Droplet digital PCR (ddPCR) gene expression analysis of Rev1, Rev7, Polk and Polq in FACS-purified PGCs and surrounding somatic cells (SSEA1-GOF18-GFP) from E10.5 embryos (n = 3 independent embryos. Data represent mean and s.d. P values were calculated by a two-tailed Mann–Whitney U-test). h GFP fluorescence images of gonads from wildtype, Rev7-/-, Polk-/- and Polq-/- E12.5 embryos. i Quantification of PGCs from wildtype, Rev7-/-, Polk-/- and Polq-/- E12.5 embryos by flow cytometry (n = 35, 14, 8 and 9, left to right. Data represent mean and s.d. P values were calculated by a two-tailed Mann–Whitney U-test). j H&E-stained testis seminiferous tubules from 8−12-week-old wildtype and mutant mice. k Quantification of SCO tubules per section of testis of 8−12-week-old mice (n = 10, 7, 8 and 14, left to right. Data represent mean and s.d. P values were calculated by a two-tailed Mann–Whitney U-test). l H&E-stained ovaries and (m) quantification of follicles per section of ovary from 8−12-week-old mice (n = 8, 3, 4 and 11, left to right. Data represent mean and s.d. P values were calculated by a two-tailed Mann–Whitney U-test).
Fig. 3
Fig. 3. Embryonic origin of sterility upon PCNA K164 mutation.
a Representative images of testes and ovaries from wildtype and PcnaR/R mice.Quantification of (b) testicular or (c) ovarian mass from 8-12-week-old wildtype and PcnaR/R mice (n = 12, 10, 13 and 8 left to right. Data represent mean and s.d. P values were calculated by a two-tailed Mann–Whitney U-test). d Cumulative number of offspring when wildtype or PcnaR/R mice were mated with wildtype mates of the opposite sex (n = 6 mice per genotype, 3 per sex. Data represent mean and s.d. P values were calculated by a two-tailed Mann–Whitney U-test). e H&E-stained testis seminiferous tubules and (f) quantification of SCO tubules per section of testis of 8−12-week-old wildtype and PcnaR/R (n = 10 and 15, left to right. Data represent mean and s.d. P values were calculated by a two-tailed Mann–Whitney U-test). g H&E-stained ovaries and (h) quantification of follicles per section of ovary from 8−12-week-old wildtype and PcnaR/R mice (n = 8 and 11, left to right. Data represent mean and s.d. P values were calculated by a two-tailed Mann–Whitney U-test). i GFP fluorescence images of gonads from wildtype and PcnaR/R E12.5 embryos. j Representative flow cytometry plots and (k) quantification of PGCs from wildtype, Rev1-/- and PcnaR/R gonads at E12.5 (n = 35, 12 and 21, left to right. Data represent mean and s.d. P values were calculated by a two-tailed Mann–Whitney U-test). l Quantification of PGCs by flow cytometry from wildtype, Rev1-/-, PcnaR/R and Rev7-/- embryos at E8.5 (n = 18, 5, 2 and 3, left to right. Data represent mean and s.d. P values were calculated by a two-tailed Mann–Whitney U-test). m Quantification of PGCs by flow cytometry from E8.5 to E12.5 in wildtype and mutant embryos (wildtype, n = 18, 12, 9, 3 and 17; Rev1−/−, n = 5, 6, 5, 2 and 8; PcnaR/R, n = 2, 4, 4, 7 and 9; Rev7−/−, I = 3, 0, 0, 0 and 7, independent embryos, left to right. Data represent mean and s.d. P values were calculated by a two-tailed Mann–Whitney U-test).
Fig. 4
Fig. 4. Genome instability and cell cycle abnormalities in PcnaR/R and Rev1-/- PGCs.
a Top: Representative images of ɣ-H2A.X foci in the nucleus of PGCs (GOF18-GFP+) at E12.5. Bottom: Frequency of PGCs with >10 ɣ-H2A.X foci per nucleus (n = 6, 5 and 3, left to right. Data represent mean and s.d. P values were calculated by a two-tailed Mann–Whitney U-test). b Top: Representative images of RPA foci in the nucleus of PGCs at E12.5. Bottom: Frequency of PGCs with RPA foci (n = 5, 4 and 3, left to right. Data represent mean and s.d. P values were calculated by a two-tailed Mann–Whitney U-test). c Top: Representative images of E12.5 gonads stained for phosphorylation of CHK2 kinase at residue Thr68 (pCHK2). Bottom: Frequency of PGCs that stain positive for pCHK2 (n = 5, 3 and 3, left to right. Data represent mean and s.d. P values were calculated by a two-tailed Mann–Whitney U-test). d Top: Representative images of E12.5 gonads stained for cleaved-Caspase-3 (CC3) and GFP. Bottom: Frequency of PGCs that stain positive for CC3 (n = 8, 4 and 3, left to right. Data represent mean and s.d. P values were calculated by a two-tailed Mann–Whitney U-test). e Top: Representative images of E12.5 gonads stained for EdU and GFP. Bottom: Frequency of PGCs that stain positive for EdU (n = 3 per genotype. Data represent mean and s.d. P values were calculated by a two-tailed Mann–Whitney U-test). f Top: Representative images of E12.5 gonads stained for phosphorylated-histone-H3 (pH3) and GFP. Bottom: Frequency of PGCs that stain positive for pH3 (n = 11, 4 and 2, left to right. Data represent mean and s.d. P values were calculated by a two-tailed Mann–Whitney U-test).
Fig. 5
Fig. 5. TLS preserves the PGC developmental programme.
a RT-qPCR expression analysis of PGCs from E12.5 embryos (n = 3 embryos per genotype. Data represent mean and s.d. P values were calculated by a two-tailed Mann–Whitney U-test). b RT-qPCR expression analysis of PGCs from E12.5 embryos. (Wildtype n = 6; PcnaR/R n = 7. Except for Hormad1 and Brdt, wildtype n = 3; PcnaR/R n = 5). c Box plot of global DNA CpG methylation levels in E6.5 epiblast cells and E12.5 PGCs. The center displays the median, boxes the interquartile range and whiskers the minimum and maximum of CpG methylation distribution of the genome in 5Kbp genomic windows (n = 513027, 318836, 498368). d Circos-plot representation of DNA methylation levels in E6.5 epiblast and E12.5 wildtype PGCs and E12.5 PcnaR/R PGCs. CpG methylation was averaged in 5 Mbp genomic windows and the average DNA methylation is represented as a histogram track. e Heatmap showing methylation levels for E6.5 epiblast and E12.5 PGCs. f Unclustered methylation heatmap of CpG methylation in E6.5 epiblast and E12.5 PGCs. g Bisulfite sequencing and quantification of the Line-1 element from E12.5 wildtype, PcnaR/R and Rev1-/- embryos (filled:methylated CpG, open:unmethylated CpG. Each point represents one embryo, data represent mean and s.d., P values were calculated by a two-tailed Mann–Whitney U-test). h Violin plots reflecting the DNA methylation levels of GRR gene bodies in E6.5 epiblast cells from wildtype embryos, E12.5 wildtype PGCs and E12.5 PcnaR/R PGCs. The center displays the median, boxes the interquartile range and whiskers the minimum and maximum of percentage methylation calculated over each gene body with each point representing an individual gene (n = 37, 37, 35 left to right). i CpG methylation across selected GRR genes in E6.5 epiblast and E12.5 PGCs. The plots represent the distribution of CpG methylation across genes segmented in 0.1 Kbp genomic windows. j RT-qPCR expression analysis of Tet1 and Dnmt1 in PGCs from E12.5 embryos. (For Tet1, n = 5 for both genotypes. Dnmt1, wildtype n = 6 and PcnaR/R n = 7. Data represent mean and s.d., P values were calculated by a two-tailed Mann–Whitney U-test).

References

    1. Saitou M, Yamaji M. Primordial germ cells in mice. Cold Spring Harb. Perspect. Biol. 2012;4:a008375. doi: 10.1101/cshperspect.a008375. - DOI - PMC - PubMed
    1. Soriano P, Jaenisch R. Retroviruses as probes for mammalian development: allocation of cells to the somatic and germ cell lineages. Cell. 1986;46:19–29. doi: 10.1016/0092-8674(86)90856-1. - DOI - PubMed
    1. Ueno H, Turnbull BB, Weissman IL. Two-step oligoclonal development of male germ cells. Proc. Natl. Acad. Sci. USA. 2009;106:175–180. doi: 10.1073/pnas.0810325105. - DOI - PMC - PubMed
    1. Saitou M, Barton SC, Surani MA. A molecular programme for the specification of germ cell fate in mice. Nature. 2002;418:293–300. doi: 10.1038/nature00927. - DOI - PubMed
    1. Yabuta Y, Kurimoto K, Ohinata Y, Seki Y, Saitou M. Gene expression dynamics during germline specification in mice identified by quantitative single-cell gene expression profiling. Biol. Reprod. 2006;75:705–716. doi: 10.1095/biolreprod.106.053686. - DOI - PubMed

Publication types

Substances