

Deer activity levels and patterns vary along gradients of food availability and anthropogenic development
- PMID: 38702359
- PMCID: PMC11068751
- DOI: 10.1038/s41598-024-60079-6
Deer activity levels and patterns vary along gradients of food availability and anthropogenic development
Abstract
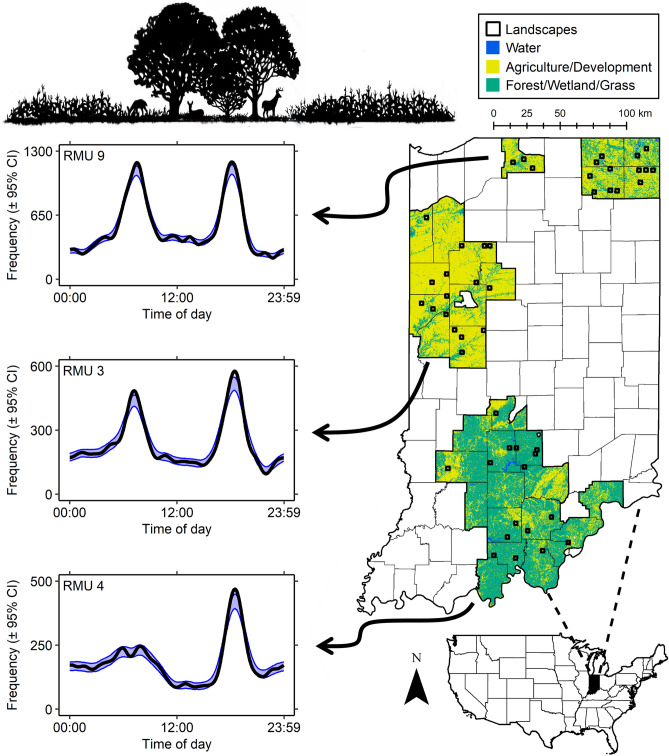
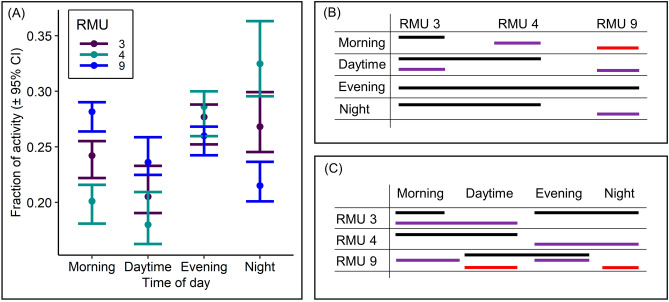
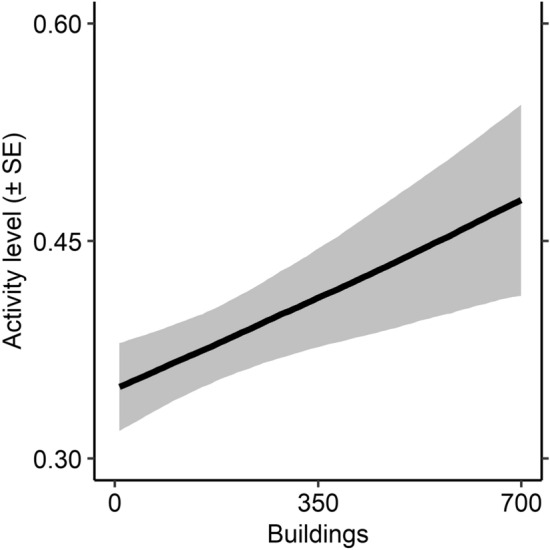
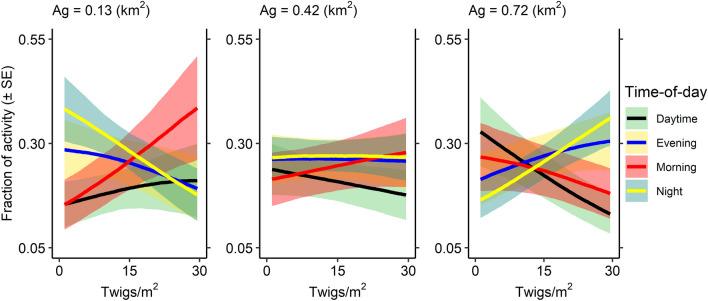
Animal activity reflects behavioral decisions that depend upon environmental context. Prior studies typically estimated activity distributions within few areas, which has limited quantitative assessment of activity changes across environmental gradients. We examined relationships between two response variables, activity level (fraction of each day spent active) and pattern (distribution of activity across a diel cycle) of white-tailed deer (Odocoileus virginianus), with four predictors-deer density, anthropogenic development, and food availability from woody twigs and agriculture. We estimated activity levels and patterns with cameras in 48 different 10.36-km2 landscapes across three larger regions. Activity levels increased with greater building density, likely due to heightened anthropogenic disturbance, but did not vary with food availability. In contrast, activity patterns responded to an interaction between twigs and agriculture, consistent with a functional response in habitat use. When agricultural land was limited, greater woody twig density was associated with reduced activity during night and evening. When agricultural land was plentiful, greater woody twig density was associated with more pronounced activity during night and evening. The region with the highest activity level also experienced the most deer-vehicle collisions. We highlight how studies of spatial variation in activity expand ecological insights on context-dependent constraints that affect wildlife behavior.
© 2024. This is a U.S. Government work and not under copyright protection in the US; foreign copyright protection may apply.
Conflict of interest statement
The authors declare no competing interests.
Figures
References
-
- Vazquez C, Rowcliffe JM, Spoelstra K, Jansen PA. Comparing diel activity patterns of wildlife across latitudes and seasons: Time transformations using day length. Methods Ecol. Evol. 2019;10:2057–2066. doi: 10.1111/2041-210X.13290. - DOI
-
- Metcalfe NB, Fraser NH, Burns MD. Food availability and the nocturnal vs. diurnal foraging trade-off in juvenile salmon. J. Anim. Ecol. 1999;68:371–381. doi: 10.1046/j.1365-2656.1999.00289.x. - DOI
-
- Schmidt K. Variation in daily activity of the free-living Eurasian lynx (Lynx lynx) in Białowieża Primeval Forest. Poland. J. Zool. 1999;249:417–425.
-
- Ross J, Hearn AJ, Johnson PJ, Macdonald DW. Activity patterns and temporal avoidance by prey in response to Sunda clouded leopard predation risk. J. Zool. 2013;290:96–106. doi: 10.1111/jzo.12018. - DOI
-
- Kronfeld-Schor N, Dayan T. Partitioning of time as an ecological resource. Annu. Rev. Ecol. Evol. Syst. 2003;34:153–181. doi: 10.1146/annurev.ecolsys.34.011802.132435. - DOI
Publication types
MeSH terms
LinkOut - more resources
Full Text Sources
