Review
. 2024 Sep;19(9):2712-2738.
doi: 10.1038/s41596-024-00994-0. Epub 2024 May 3.

Generation of 'semi-guided' cortical organoids with complex neural oscillations

Affiliations
Review

Generation of 'semi-guided' cortical organoids with complex neural oscillations

Michael Q Fitzgerald et al. Nat Protoc. 2024 Sep.

Erratum in

Abstract

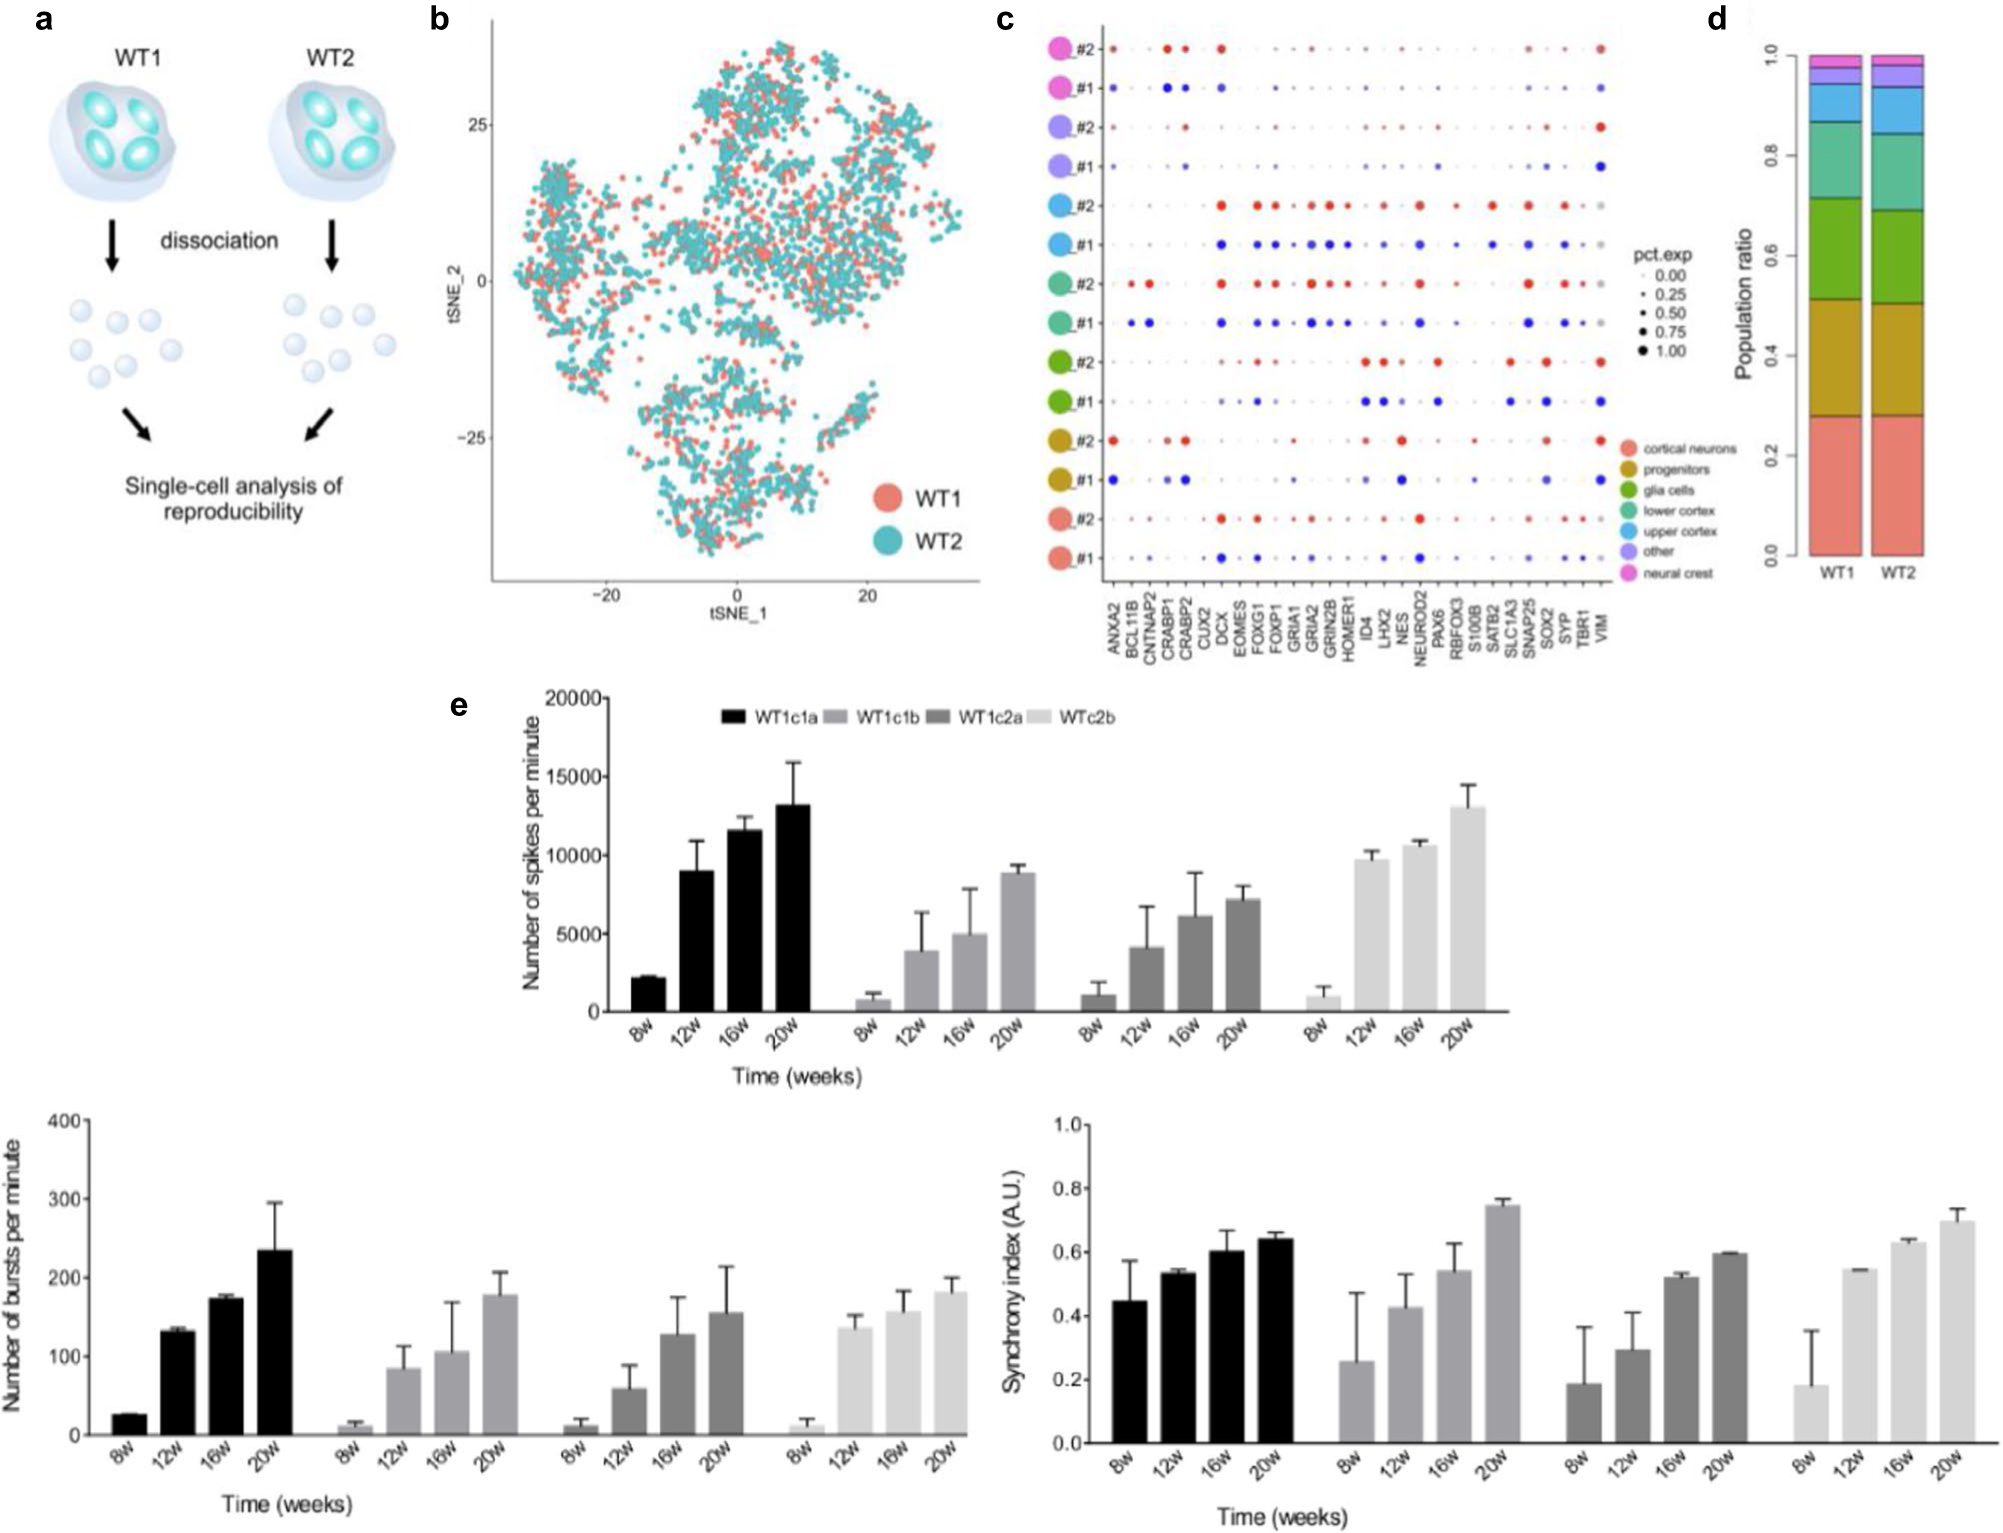
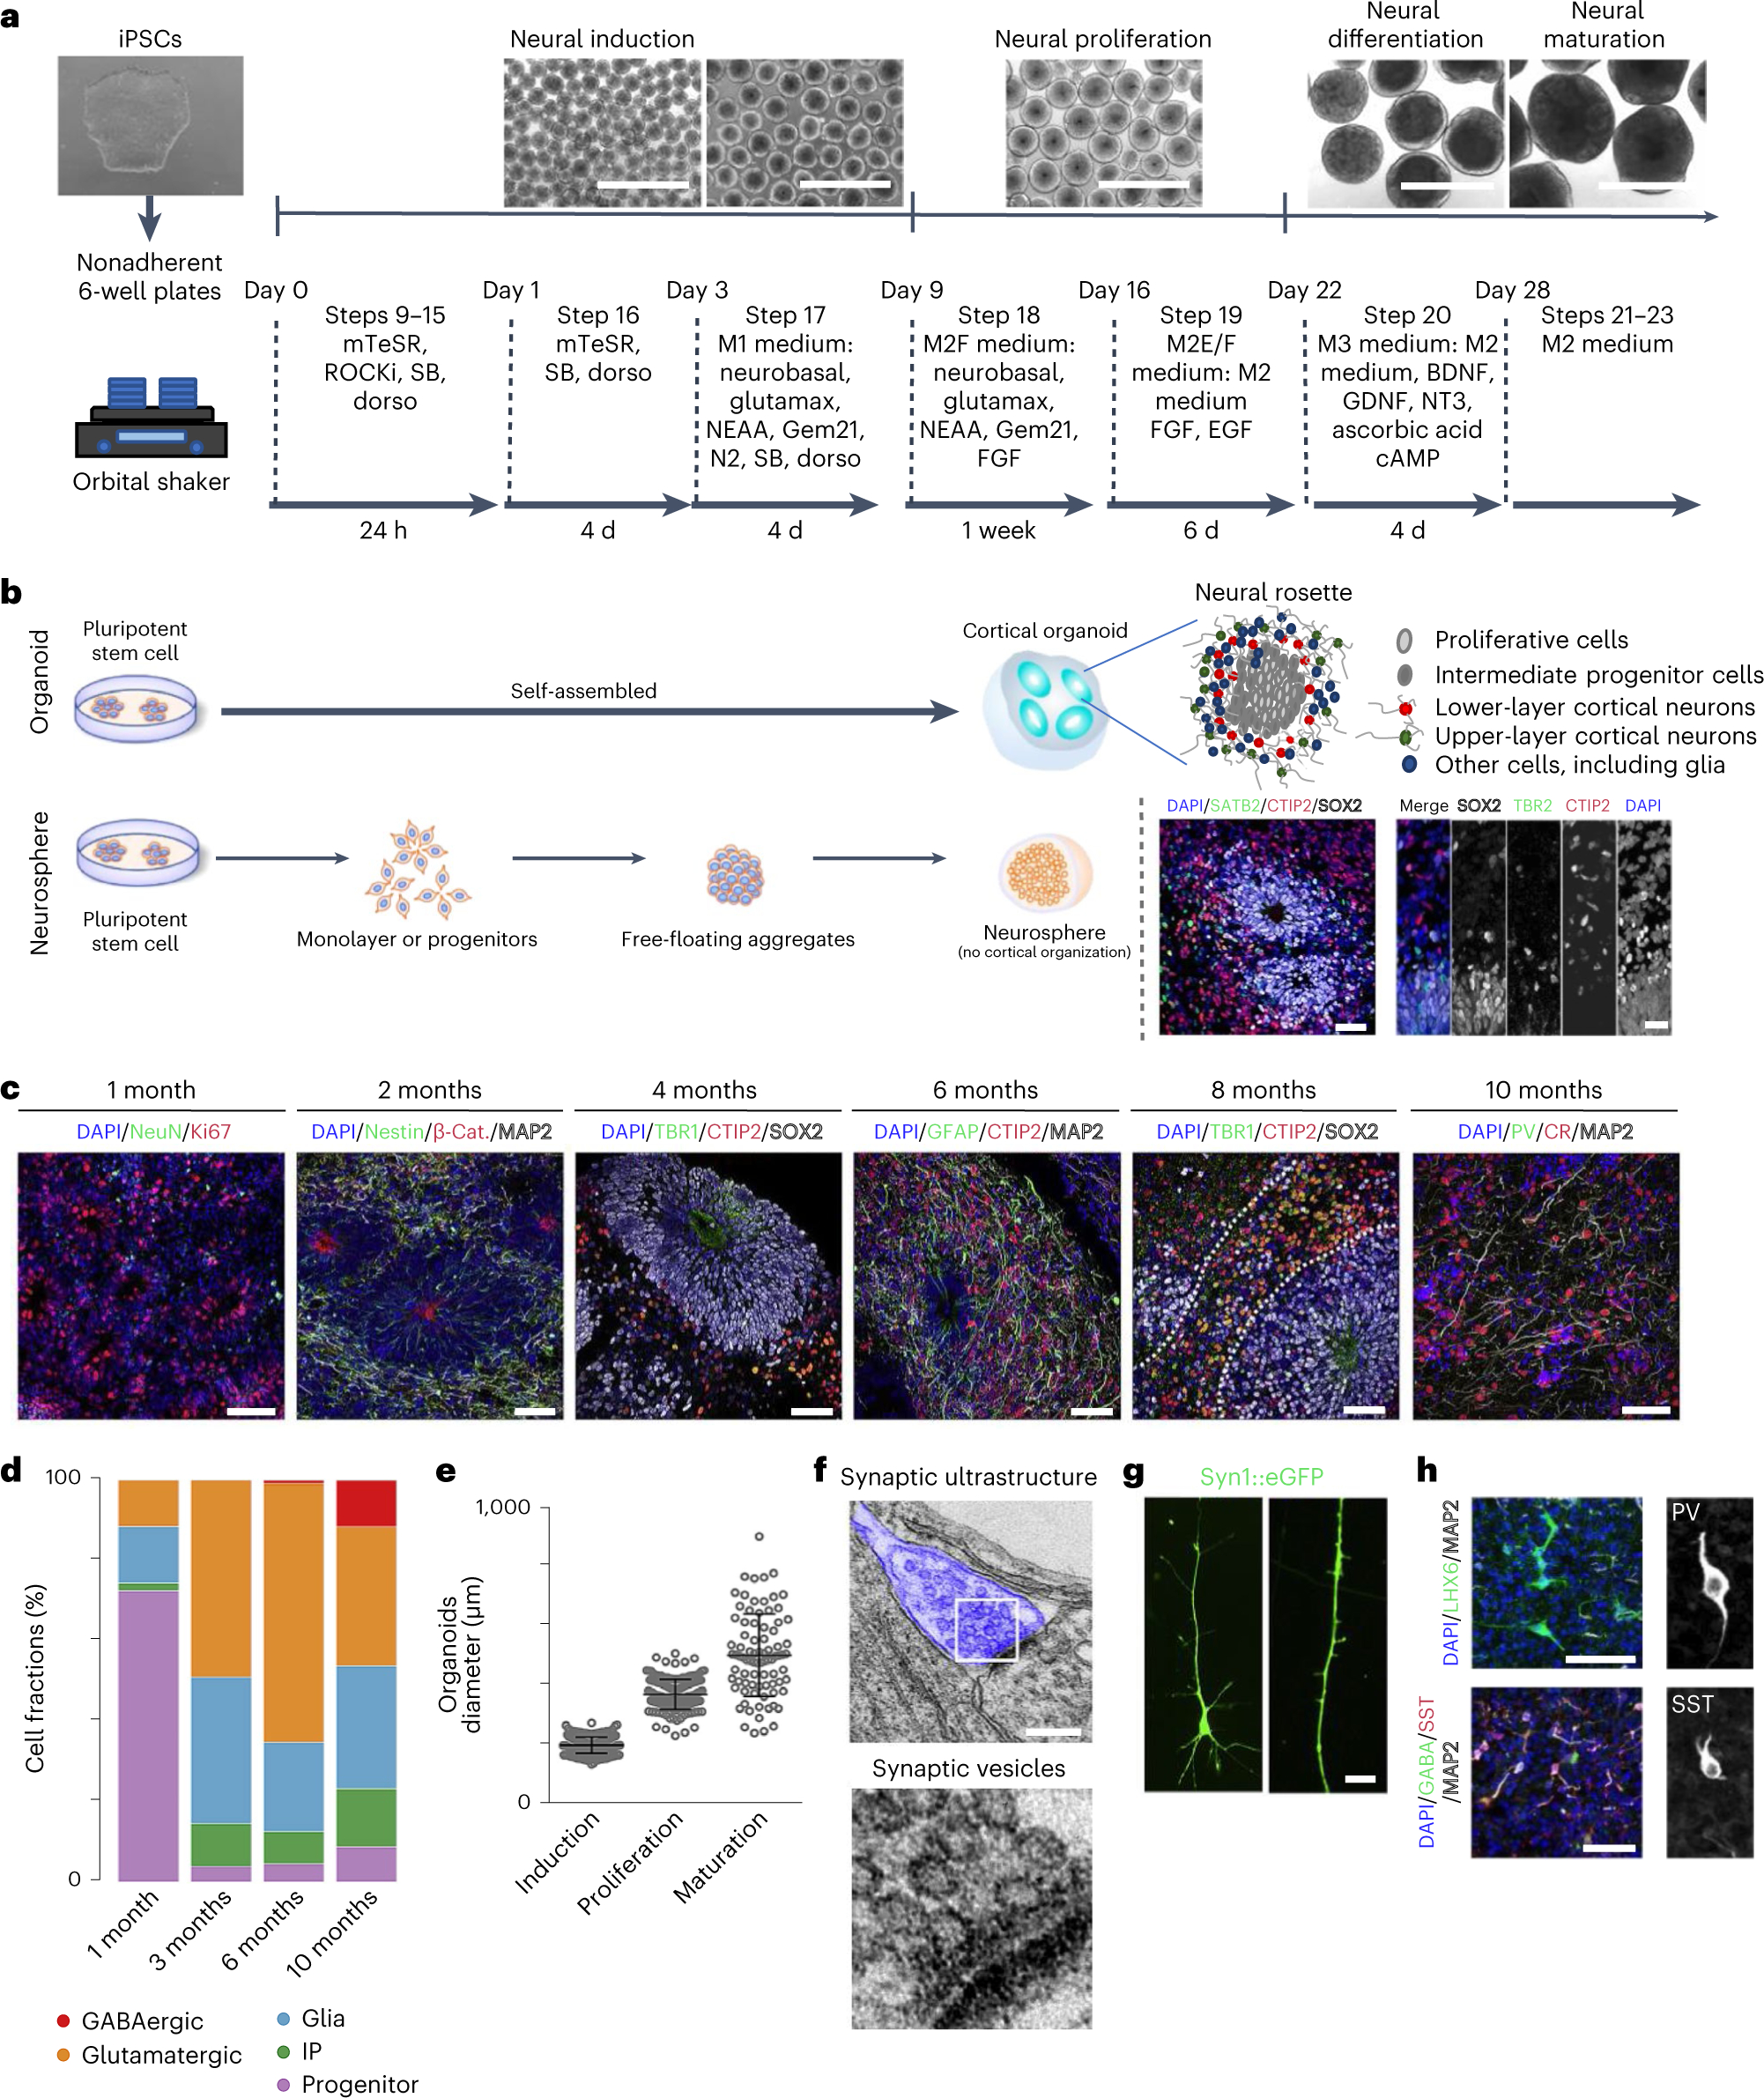
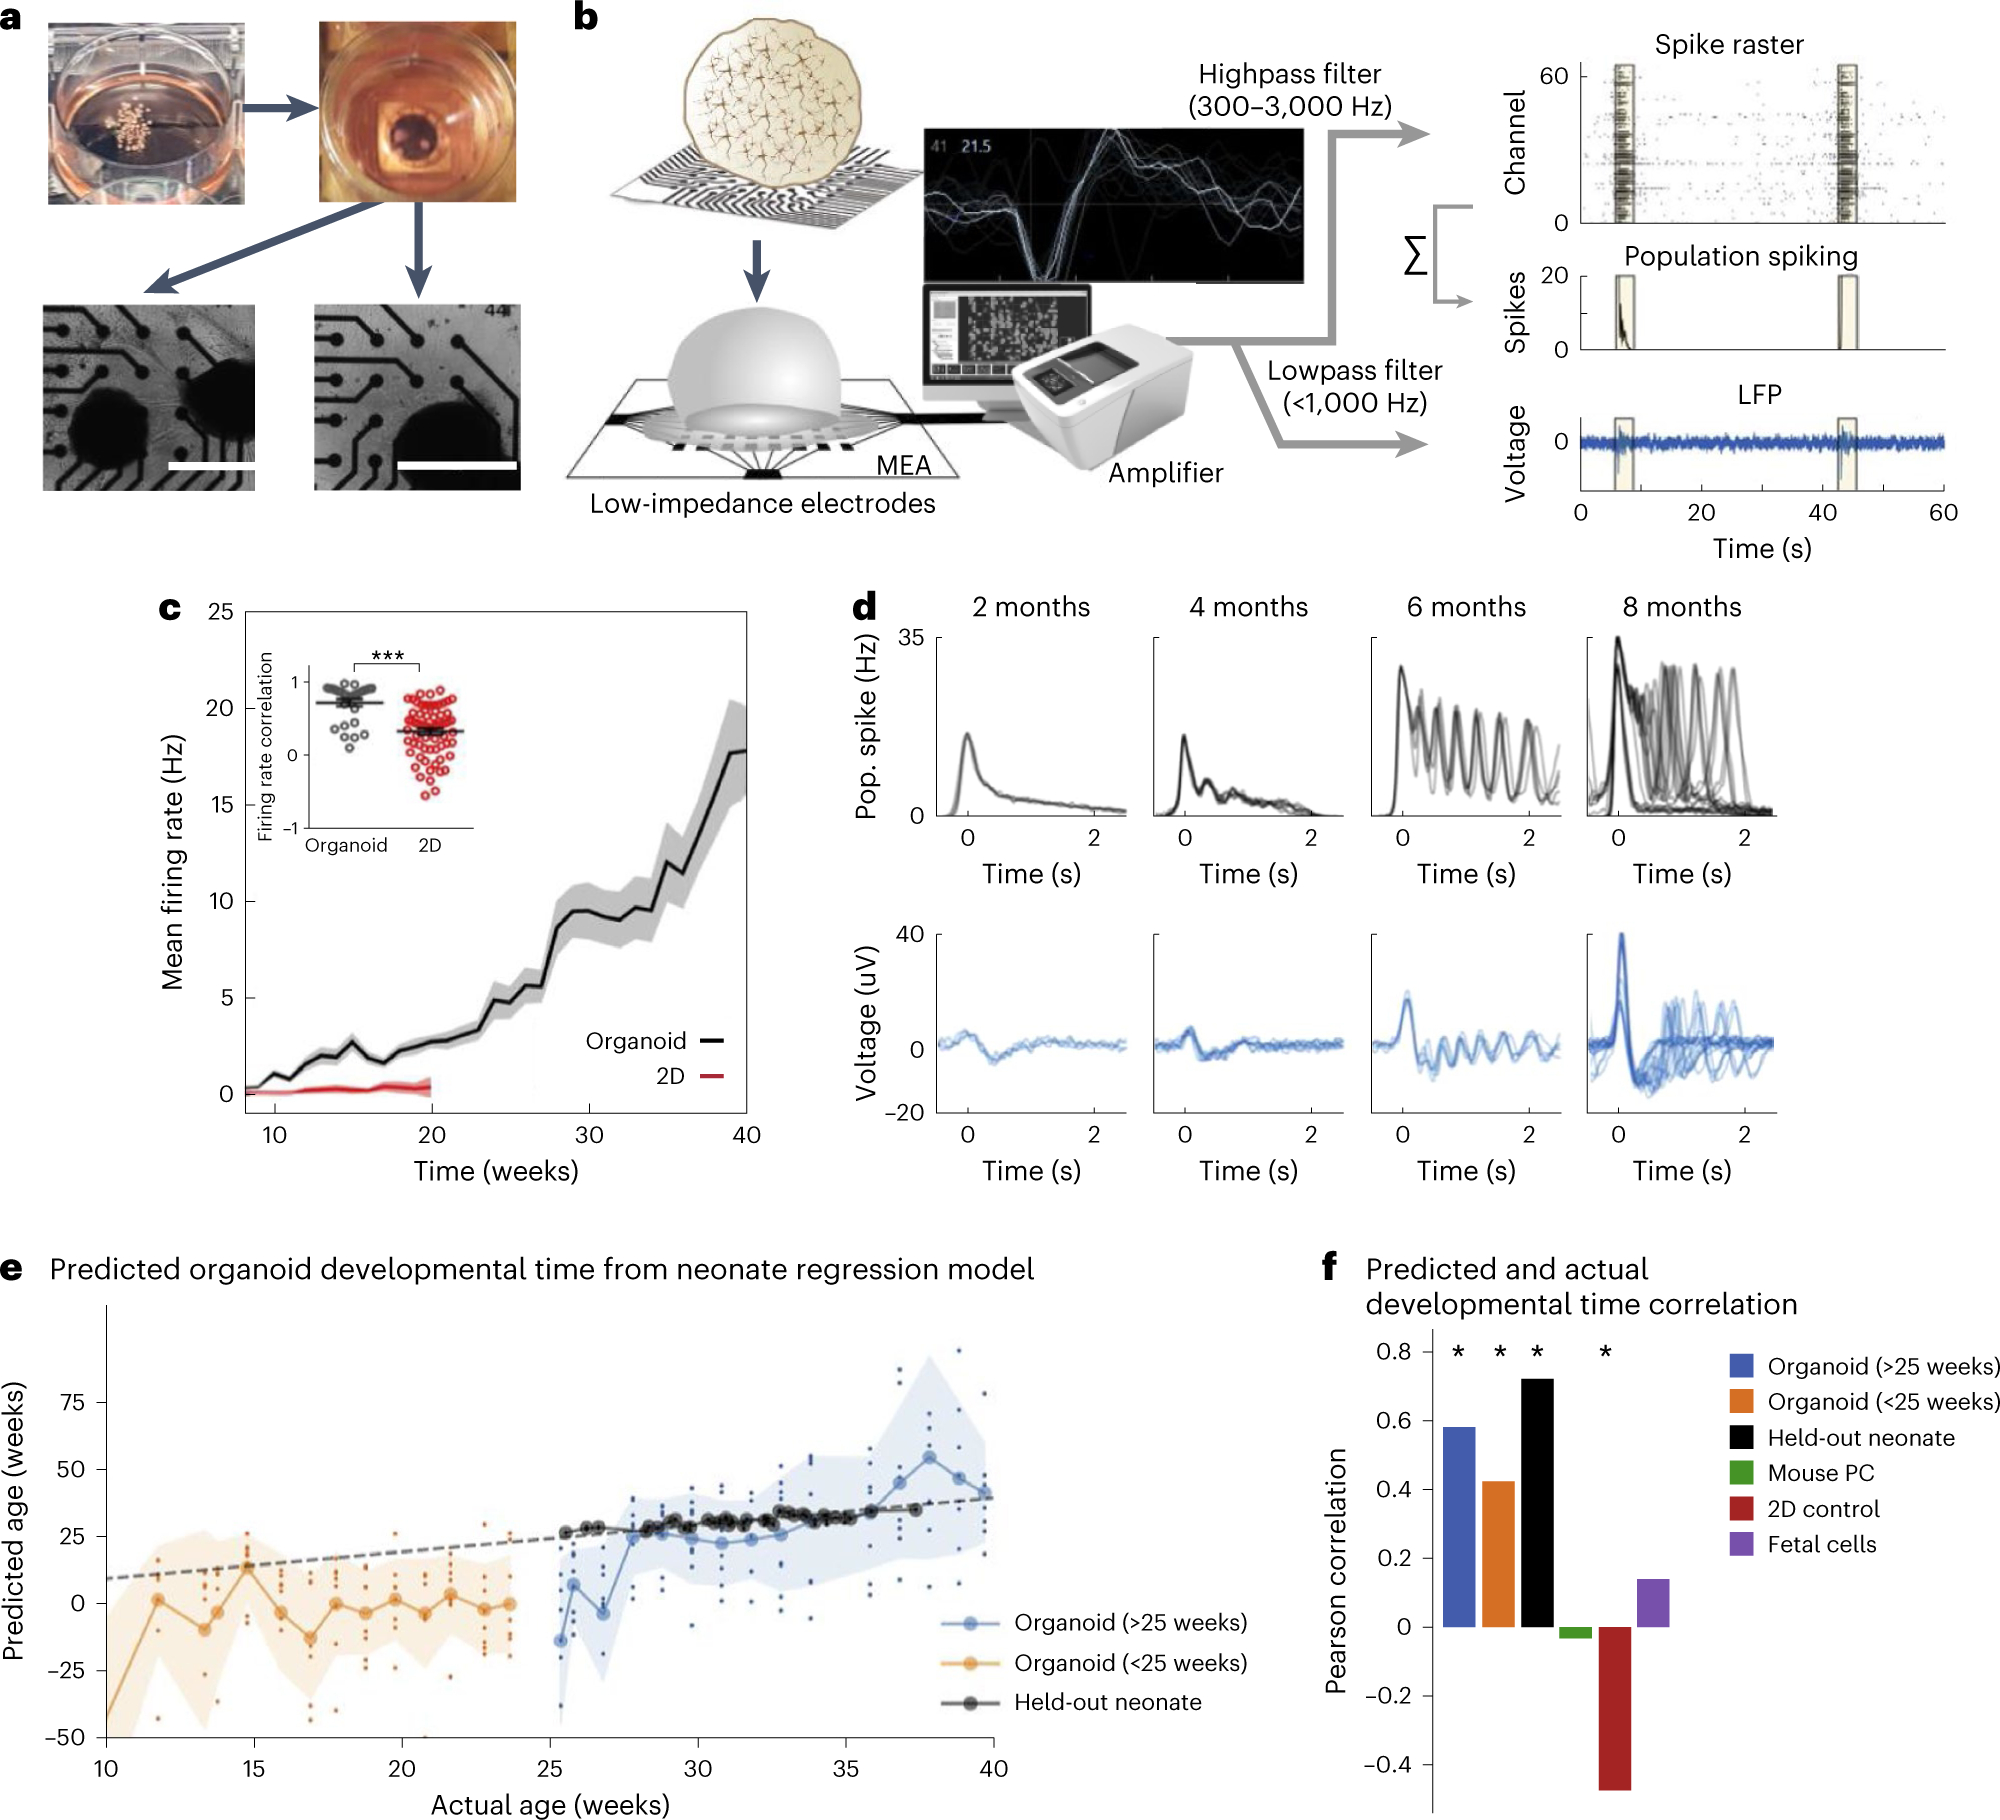
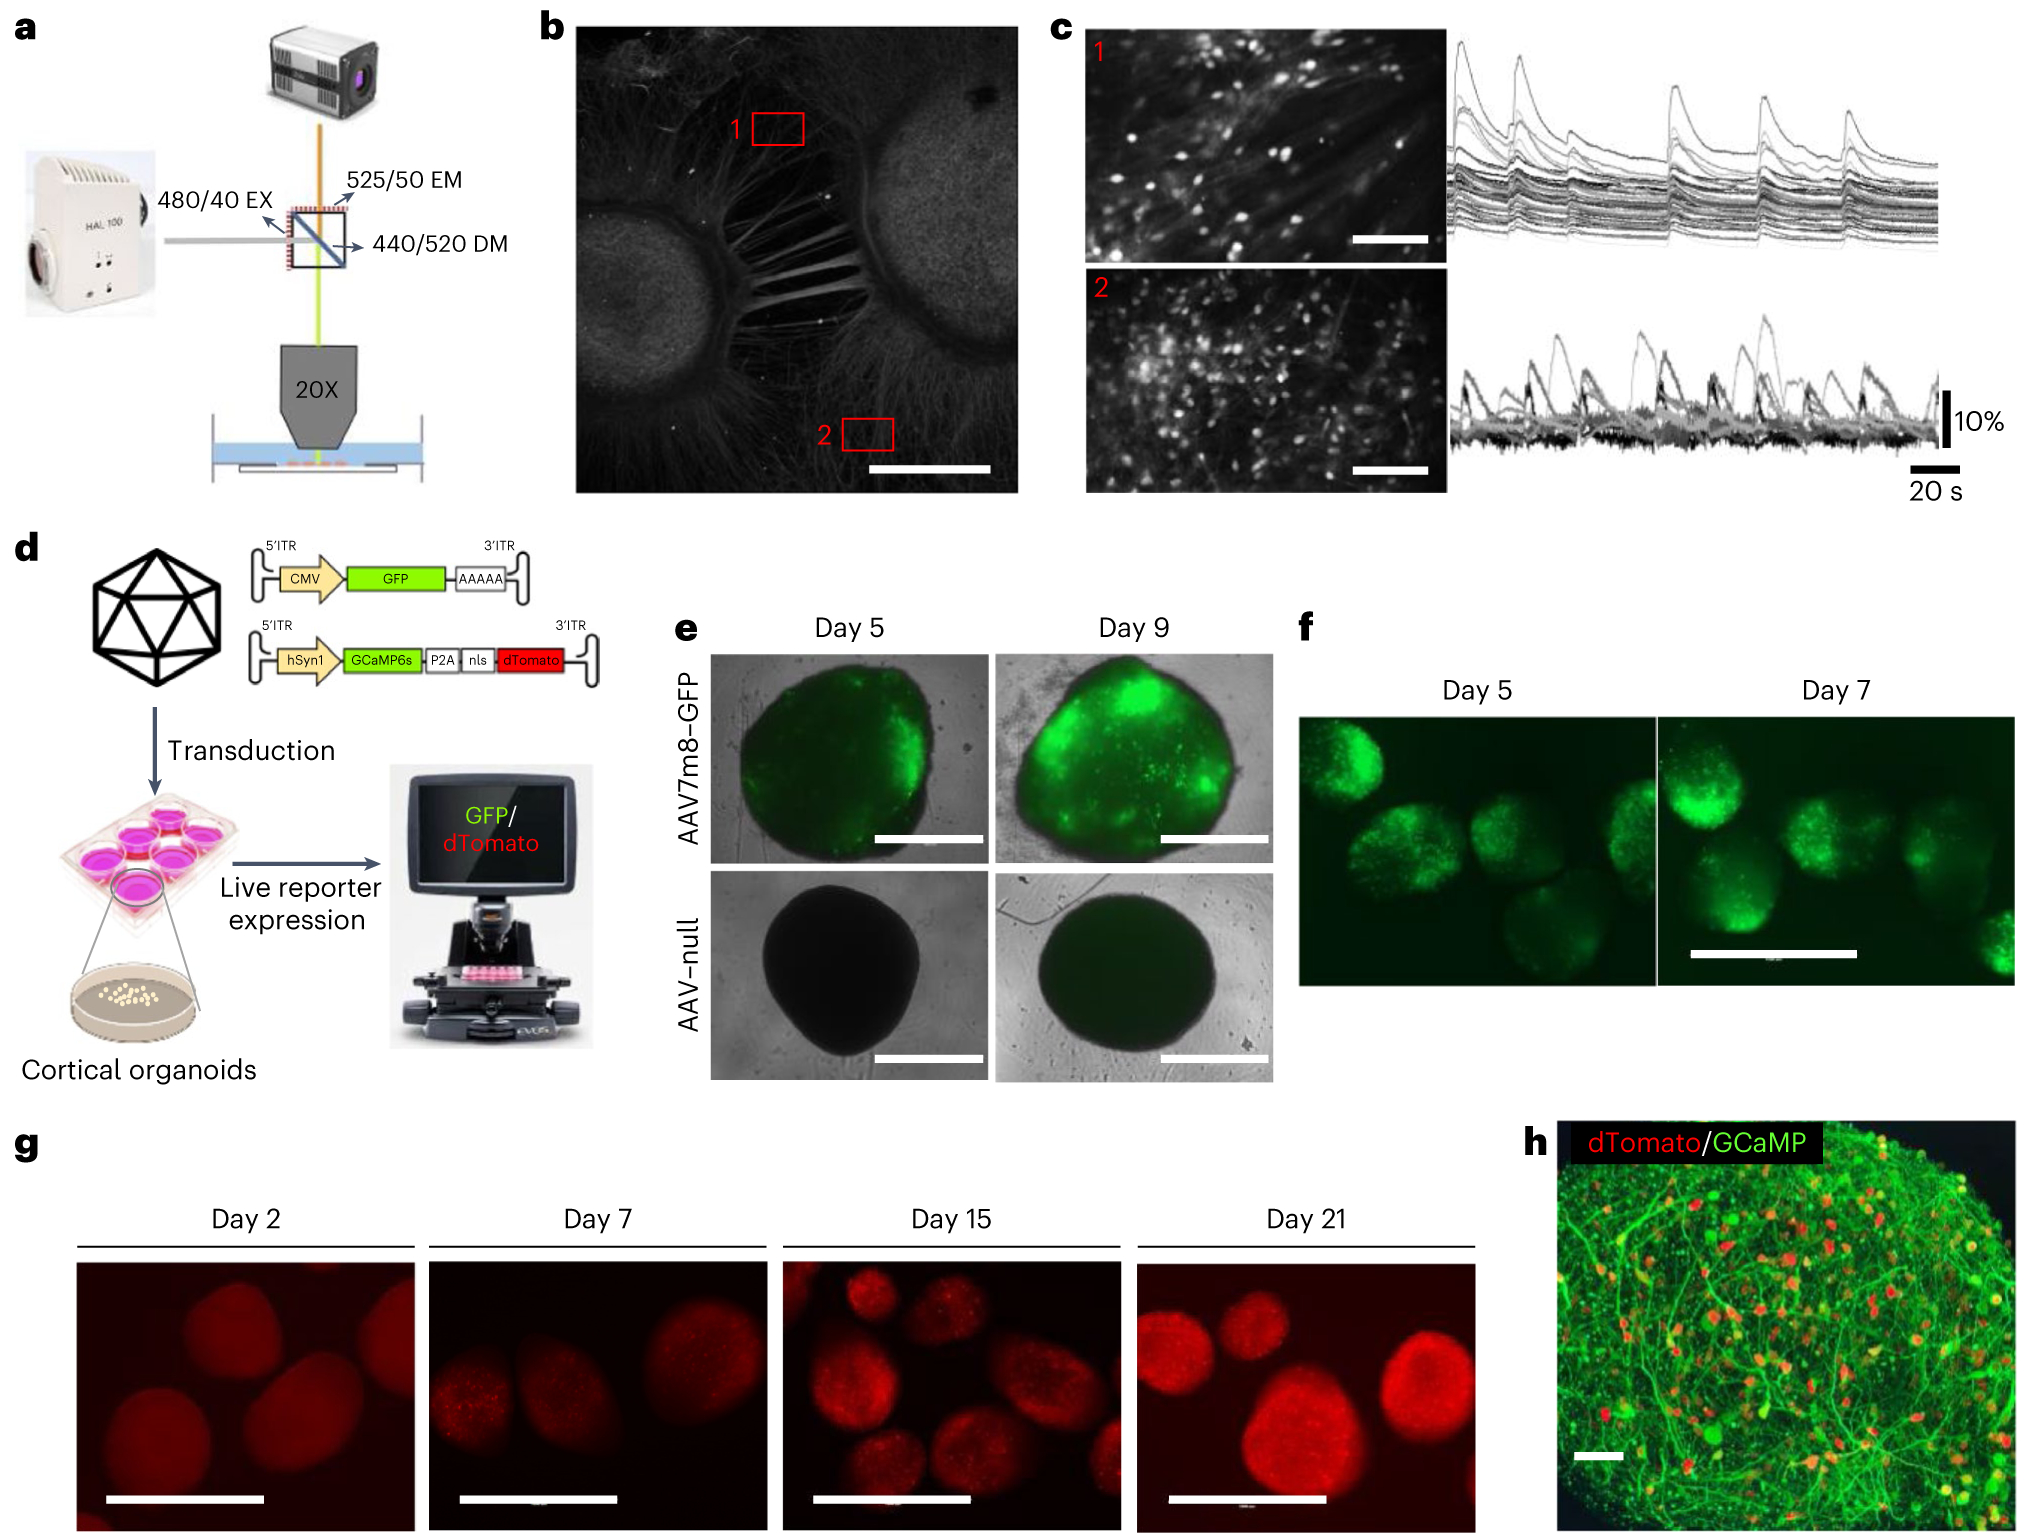
Temporal development of neural electrophysiology follows genetic programming, similar to cellular maturation and organization during development. The emergent properties of this electrophysiological development, namely neural oscillations, can be used to characterize brain development. Recently, we utilized the innate programming encoded in the human genome to generate functionally mature cortical organoids. In brief, stem cells are suspended in culture via continuous shaking and naturally aggregate into embryoid bodies before being exposed to media formulations for neural induction, differentiation and maturation. The specific culture format, media composition and duration of exposure to these media distinguish organoid protocols and determine whether a protocol is guided or unguided toward specific neural fate. The 'semi-guided' protocol presented here has shorter induction and differentiation steps with less-specific patterning molecules than most guided protocols but maintains the use of neurotrophic factors such as brain-derived growth factor and neurotrophin-3, unlike unguided approaches. This approach yields the cell type diversity of unguided approaches while maintaining reproducibility for disease modeling. Importantly, we characterized the electrophysiology of these organoids and found that they recapitulate the maturation of neural oscillations observed in the developing human brain, a feature not shown with other approaches. This protocol represents the potential first steps toward bridging molecular and cellular biology to human cognition, and it has already been used to discover underlying features of human brain development, evolution and neurological conditions. Experienced cell culture technicians can expect the protocol to take 1 month, with extended maturation, electrophysiology recording, and adeno-associated virus transduction procedure options.


Conflict of interest statement

Competing interests

A.R.M. is a cofounder of and has an equity interest in TISMOO, a company dedicated to genetic analysis and brain organoid modeling focusing on therapeutic applications customized for autism spectrum disorder and other neurological disorders with genetic origins. The terms of this arrangement have been reviewed and approved by the University of California San Diego in accordance with its conflict-of-interest policies. A.R.M. is an inventor of several patents related to human functional brain organogenesis, including the protocol described here.

Figures

Extended Data Fig. 1 |
Extended Data Fig. 1 |. Third-party comparison of different brain organoid protocols and the fetal human brain.
(a) Schematic View of the Culture System Generating human cortical organoids (hCOs). Guided protocols originated from Eiraku et al. while non-guided protocols are from Lancaster et al.. Timeline of neural induction, differentiation, and maturation step is shown across protocols. Note that, while we have use the term ‘semi-guided’ here to describe our protocol and distinguish it from other Eiraku et al. -derived directed protocols, all panels in this figure are adapted from ref. , which only utilized the terms ‘guided’ and ‘unguided’ and thus correctly classified our protocol as guided. (b–d) Shared-nearest-neighbors (SNN) graph visualization for differentiation trajectory. (b) Differentiation directions (arrows) were determined by pseudotime. (c) Estimated trajectory backbone from the SNN graph. (d) Comparison of differentiation trajectory among different protocols. (e) The presence of cell types in each organoid protocol and human fetal brain. Cell types with >0.25% of cells are denoted with a plus sign. F, Fiddes et al.; V, Velasco et al.; B, Birey et al.; M, Madhavan et al.; T, Trujillo et al.; X, Xiang et al.; Q, Quadrato et al.; G, Giandomenico et al.. (f) Enrichment of disease-related genes in each organoid protocol. The red boxes indicate data generated from the protocol presented here. Figure adapted with permission from ref. , Elsevier.
Extended Data Fig. 2 |
Extended Data Fig. 2 |. Molecular and functional reproducibility of cortical organoids.
(a) Schematic showing the single-cell approach performed to assess the reproducibility of organoid generation using different iPSC lines (WT1 and WT2). (b) tSNE plot of single-cell mRNA sequencing data from two 6-month-old organoids. (c) Expression of gene markers for various cell types both batches. (d) Population ratio of each cluster by replicate. (e) Consistent and reproducible development of electrical activity in organoids over time across four cell lines, bars represent mean ± s.e.m (n = 8, independent experiments performed in duplicates using two clones of an iPSC line).
Extended Data Fig. 3 |
Extended Data Fig. 3 |. Selection of organoids for plating.
(a) Good-quality 1-month-old organoids with visible spatial arrangement of neural rosette structures. Scale bar, 1,000 μm. Mixed quality organoids, where there is a mixed population of fully differentiated organoids with visible rosette structures and incomplete differentiated organoids—select rosetted organoids only for downstream assays and discard incompletely differentiated organoids. Poor-quality spheroids that did not efficiently neuralize and differentiate into rosetted organoids—discard and start over. (b) Distinguish proper spatial organization and structural development in organoids; orange arrows indicate holes and green arrows indicate rosettes. Scale bar, 1,000 μm. (c) Use of immunohistochemistry to distinguish between good-quality organoids with spatial neural rosette arrangement (smaller circles within the organoid) and incompletely differentiated organoids that contain neurons but lack neural rosette structures and spatial organization. Immunostainings showing nuclei (DAPI), neuron microtubules (MAP2), and proliferating NPCs (Ki67 and Nestin). Scale bar, 50 μm.
Fig. 1 |
Fig. 1 |. Overview of generation of cortical organoids and resulting features.
a, A schematic of the protocol used to generate cortical organoids. Scale bars, 1 cm. b, A schematic comparison of brain organoids versus neurosphere, with graphics of neural rosettes and representative immunostainings showing proliferative cells (SOX2), intermediate progenitor cells (TBR2) and lower layer (CTIP2) and upper layer (SATB2) cortical neurons. Scale bars, 50 μm. c, Representative immunostainings that show nuclei (DAPI), β-catenin ((β-cat) stabilized in inner lumen of rosette), proliferating neural progenitor cells (NPCs) (Ki67 and Nestin), neurons (NeuN), lower cortical layer neurons (TBR1 and CTIP2), upper cortical layer neurons (SATB2), interneurons (CR) and glial cells (GFAP), over time. Scale bars, 50 μm. d, The proportion of progenitor cells, intermediate progenitor (IP) cells, glia, and glutamatergic and GABAergic neurons from scRNAseq (~12,000 cells per library prep) at individual timepoints represented as a bar plot. e, The expected organoid size over the course of development, ~200 μm during induction, 375 μm during proliferation and 500 μm during maturation. Induction is around day 5, proliferation is around day 18, maturation is around day 28. f, Electron microscopy of synaptic ultrastructure (blue), staining from a 4-month-old organoid. Scale bar, 200 nm. g, A representative image of a pyramidal neuron and dendritic structures, observed in 4-month-old neurons using a SYN:EGFP reporter. Scale bar, 5 μm. h, Immunostaining of 10-month cortical organoids for the GABAergic neuronal markers parvalbumin (PV) and somatostatin (SST). Scale bars, 50 μm. Panels bh adapted with permission from ref. , Elsevier.
Fig. 2 |
Fig. 2 |. Electrophysiology overview and characterization.
a, Pictures depicting plating of organoids on an MEA plate. Scale bars, 1 mm. b, A schematic for the electrophysiological signal processing pipeline in organoids. Representative waveform shape of neuronal trace/spike. Raw MEA data are analyzed as population spiking and LFP separately. Yellow highlights indicate synchronous network events. c, Compared with 2D neurons, cortical organoids show elevated and continuously increasing mean firing rate (n = 8 for organoid cultures and n = 12 for 2D neurons ± s.d.). Inset: correlation of the firing rate vector over 12 weeks of differentiation (from 8 to 20) between pairs of cultures showing reduced variability among organoid replicates ± s.d. d, A time series of LFP and population (pop.) spiking during network events in cortical organoid development. Each overlaid trace represents a single event during the same recording session. e, Developmental time as predicted by the model (y axis, age in weeks) follows actual weeks that the organoids (orange and blue) were in culture (x axis), as well as the true age of heldout preterm neonate data points in black. The dashed line represents unity and signifies a perfect prediction. Large circles on solid lines and shaded regions denote mean ± s.d. of prediction, respectively, and dots indicate prediction per sample (n = 8 for organoids at all timepoints). f, Pearson’s correlation coefficient between actual and predicted developmental time for organoid and control datasets, including held-out preterm neonate data, mouse primary culture (PC), 2D iPSC culture, and human fetal brain culture. Positive correlations indicate the model’s ability to capture developmental trajectory. Panels bf adapted with permission from ref. , Elsevier.
Fig. 3 |
Fig. 3 |. Calcium imaging overview and AAV7m8–GCaMP transduction characterization in cortical organoids.
a, The optical setup for one-photon calcium imaging in organoids plated onto imaging plates, with example excitation (EX), emission (EM) and dichroic mirror (DM) specifications. b, A representative image of MAP2-stained cortical organoids and their interconnecting networks on imaging plates. Scale bar, 1,000 μm. c, Calcium traces recorded in two representative FOVs showing highly synchronized calcium activity alternating to individual spiking. Scale bars, 250 μm. d, Experimental design for the transduction of cortical organoids with AAV7m8 and example GFP and GCaMP inverted terminal repeat (ITR) sequence vectors. CMV, cytomegalovirus. e, Representative images of isolated cortical organoids transduced with AAV7m8–GFP and AAV–null at 1 × 10¹⁰ vg per well in a 96-well plate on days 5 and 9 after transduction, respectively. Scale bars, 1,000 μm. Replicates: AAV–null = 2, AAV7m8–GFP = 4. f, Representative images of cortical organoids transduced with AAV7m8–GFP at 1 × 10¹⁰ vg per well in a 6-well plate on days 5 and 9 after transduction, respectively. Scale bar, 1,000 μm. g, Representative images of cortical organoids showing neuronal expression of GCaMP sensor on days 2, 7, 15 and 21 after transduction, respectively. Scale bars, 1,000 μm. h, Representative confocal image of a 2-month-old organoid expressing GCaMP sensor (green) with physically separate nuclear localized dTomato fluorophore (red). Scale bar, 50 μm.

References

    1. Scuderi S, Altobelli G, Cimini V, Coppola G & Vaccarino F Cell-to-cell adhesion and neurogenesis in human cortical development: a study comparing 2D monolayers with 3D organoid cultures. Stem Cell Rep. 16, 264–280 (2021). - PMC - PubMed
    1. Centeno E, Cimarosti H & Bithell A 2D versus 3D human induced pluripotent stem cell-derived cultures for neurodegenerative disease modelling. Mol. Neurodegener 13, 27 (2018). - PMC - PubMed
    1. Adlakha Y Human 3D brain organoids: steering the demolecularization of brain and neurological diseases. Cell Death Discov. 9, 221 (2023). - PMC - PubMed
    1. Grenier K, Kao J & Diamandis P Three-dimensional modeling of human neurodegeneration: brain organoids coming of age. Mol. Psychiatry 25, 254–274 (2020). - PubMed
    1. Eiraku M et al. Self-organized formation of polarized cortical tissues from ESCs and its active manipulation by extrinsic signals. Cell Stem Cell 3, 519–532 (2008). - PubMed

Key references

    1. Trujillo C et al. Cell Stem Cell. 25, 558–569.e7 (2019): 10.1016/j.stem.2019.08.002 - DOI - PMC - PubMed
    1. Trujillo C et al. Science 371, eaax2537 (2021): 10.1126/science.aax2537 - DOI - PMC - PubMed
    1. Papes F et al. Nat. Commun 13, 2387 (2022): 10.1038/s41467-022-29942-w - DOI - PMC - PubMed

Publication types

Associated data