. 2024 Jun;20(6):651-675.
doi: 10.1038/s44320-024-00037-6. Epub 2024 May 3.

Systematic identification of structure-specific protein-protein interactions

Affiliations

Systematic identification of structure-specific protein-protein interactions

Aleš Holfeld et al. Mol Syst Biol. 2024 Jun.

Abstract

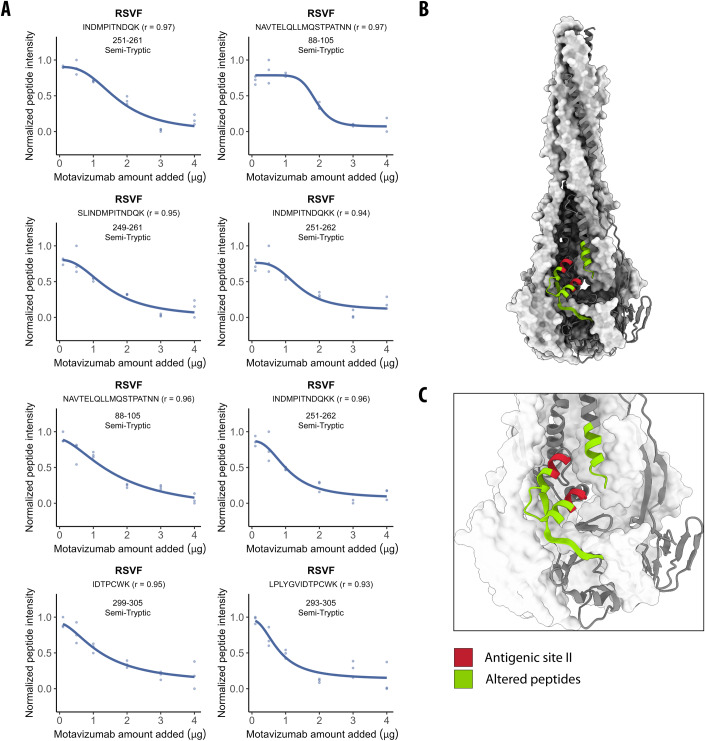
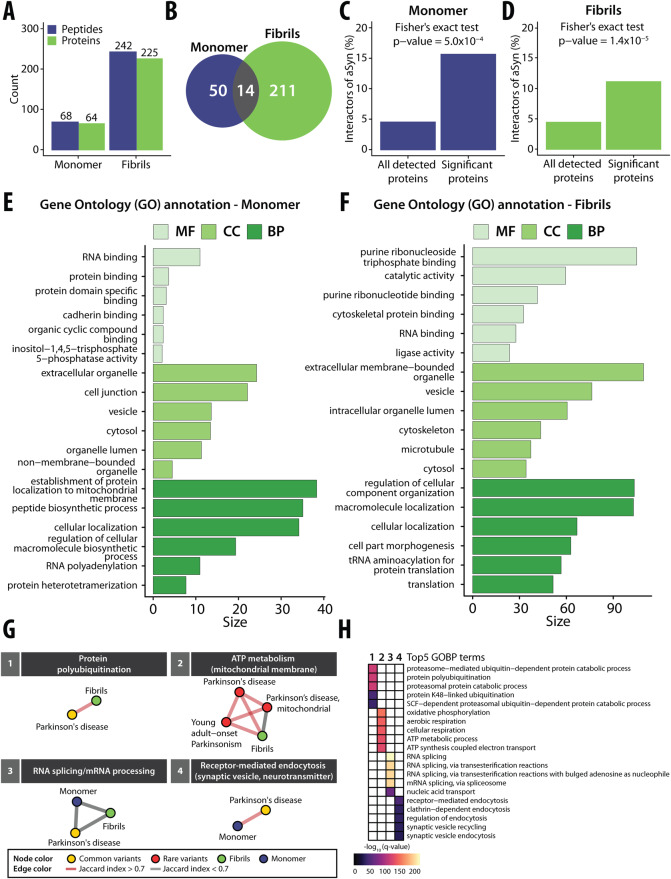
The physical interactome of a protein can be altered upon perturbation, modulating cell physiology and contributing to disease. Identifying interactome differences of normal and disease states of proteins could help understand disease mechanisms, but current methods do not pinpoint structure-specific PPIs and interaction interfaces proteome-wide. We used limited proteolysis-mass spectrometry (LiP-MS) to screen for structure-specific PPIs by probing for protease susceptibility changes of proteins in cellular extracts upon treatment with specific structural states of a protein. We first demonstrated that LiP-MS detects well-characterized PPIs, including antibody-target protein interactions and interactions with membrane proteins, and that it pinpoints interfaces, including epitopes. We then applied the approach to study conformation-specific interactors of the Parkinson's disease hallmark protein alpha-synuclein (aSyn). We identified known interactors of aSyn monomer and amyloid fibrils and provide a resource of novel putative conformation-specific aSyn interactors for validation in further studies. We also used our approach on GDP- and GTP-bound forms of two Rab GTPases, showing detection of differential candidate interactors of conformationally similar proteins. This approach is applicable to screen for structure-specific interactomes of any protein, including posttranslationally modified and unmodified, or metabolite-bound and unbound protein states.

Keywords: Limited Proteolysis; Mass Spectrometry; Protein–protein Interactions; Structural Proteomics; Structure-Specific Interactions.


Conflict of interest statement

PP is an inventor of a patent licensed by Biognosys AG that covers the LiP–MS method used in this manuscript and a member of the scientific advisory board of Biognosys AG. The remaining authors declare no competing interests. Pedro Beltrao is a member of the Advisory Editorial Board of Molecular Systems Biology. This has no bearing on the editorial consideration of this article for publication.

Figures

Figure 1
Figure 1. LiP–MS detects protein–protein interactions in purified systems.
(A) Schematic of LiP–MS workflow. Proteins are extracted from an experimental model, such as tissues, human cells, bacteria, yeast, viruses, or biofluids, under native-like conditions. The extract is then exposed to a protein of interest (treated) or not exposed (control) and subjected to limited proteolysis with proteinase K. Under LiP conditions, proteinase K cleaves solvent-exposed, accessible, and flexible regions, thus generating protein fragments that may differ between the treated and control samples for an interactor of the spiked-in protein. These protein fragments are digested by trypsin under denaturing conditions to produce peptides that are measurable by bottom-up proteomics. By comparing differential peptides between the treated and control samples, interactors of the protein of interest can be identified. (B) Structures of preRSVF (left, PDB: 4JHW) (McLellan et al, 2013) and postRSVF (right, PDB: 3RRR) (McLellan et al, 2011). Known antigenic sites are shown both on the protein structure and in isolation (middle). Blue indicates antigenic site Ø, targeted by antibodies D25 and 5C4. Red indicates antigenic site II, targeted by palivizumab and motavizumab. Orange indicates antigenic site IV, targeted by 101 F. (C) Visualization of structurally altered peptides in green (|log2 FC|>1, moderated t-test, q value <0.01, for all comparisons, n = 4 replicates each for control and treated samples), on one of the subunit of trimeric preRSVF (upper panel) and postRSVF (lower panel) protein structures upon addition of the indicated antibodies. Antigenic sites are colored as in panel (B).
Figure 2
Figure 2. LiP–MS detects protein–protein interactions in complex proteomes.
(A) Dose-response curves of eight LiP peptides with indicated amino acid positions originating from postRSVF show relative peptide intensities proportional to the amount of motavizumab spiked into HEK293T cellular extracts (n = 3 replicates each). Pearson’s coefficient (r) to a sigmoidal trend of the peptide-intensity response profile is indicated. These peptides correspond to the altered peptides (green) in panels (B) and (C). (B) The structure of postRSVF (PDB: 3RRR) (McLellan et al, 2011) with peptides altered in the dose-response analysis (r > 0.85; |log2 FC|>0.75; moderated t-test, q value <0.01) indicated in green and antigenic site II in red. (C) Zoom of the altered peptides on the structure of postRSVF (PDB: 3RRR) (McLellan et al, 2011) with colors as in panel (B).
Figure 3
Figure 3. LiP–MS detects interactors of integral membrane proteins in crude membranes.
(A) Schematic of AC8 with the CaMBD in the N-terminus, transmembrane domains 1–6 and 7–12 (TM1–6 and TM7–12), and catalytic domains C1a, C1b, C2a, and C2b indicated. (B) Distribution of protein coverage for membrane-annotated proteins identified in crude membrane preparations of HEK293S GnTI- cells (blue) and in HEK293T cellular extracts (green). Blue and green vertical lines indicate calculated median coverages of 29.6% and 17.6%, respectively. (C, D) Protein sequence coverage of bovine AC8-YFP in LiP–MS in crude membranes (C) and in cellular extracts (D) is visualized. The barcodes depict peptides along the AC8-YFP sequence. Gray represents detected peptides, white represents non-detected regions, and red represents peptides that were significantly altered upon CaM addition (r > 0.85, |log2 FC|>1, moderated t-test, q value <0.01). (E) AlphaFold2 (Varadi et al, ; Jumper et al, 2021) predicted the structure of AC8 (including the tag domain) with peptides altered upon CaM addition, highlighted in red. Amino acid sequences comprising the CaM-binding motifs of AC8 are depicted in black. Hydrophobic residues of the CaM-binding motif are underlined. The significantly altered peptides upon CaM addition are shown in red.
Figure 4
Figure 4. A systematic investigation of structure-specific interactors of the amyloidogenic protein aSyn and gene module analysis of Parkinson’s disease.
(A) Barplot with the numbers of altered LiP peptides (blue) and corresponding structurally altered proteins (green) for aSyn monomer (left) and amyloid fibrils (right). (B) Venn diagram with the numbers of structurally altered proteins for aSyn monomer (blue) and for amyloid fibrils (green). The overlap of structurally altered proteins identified for both aSyn monomer and amyloid fibrils is indicated in gray. (C) The plots show the fraction of known aSyn interactors (based on the STRING database) in structurally altered proteins (right) versus all detected proteins (left) upon spike-in of aSyn monomer into an iPSC-derived cortical neuron extract. The p value assessing enrichment (Fisher’s exact test) is shown. (D) Enrichment plot as in (C) upon spike-in of aSyn fibrils. (E, F) Functional enrichment analyses of structurally altered proteins upon spike-in of aSyn monomer (E) or fibril (F), based on the indicated ontologies (molecular function in light green, cellular component in green, biological process in dark green); the plots show the size (i.e., a score calculated based on q value) of the top6 significant gene ontology terms upon removal of redundant terms (q value <0.01, Benjamini–Hochberg FDR, minimum hypergeometric test, SimRel functional similarity, size = 0.7). (G) Identified modules with enriched GOBP (q value <0.05, Fisher’s exact test, one-sided) that are linked to either common (yellow node) or rare variants (red node) of PD genes for aSyn monomer (blue) or fibrils (green). The thickness of lines represents the Jaccard index (red for Jaccard index >0.7, gray for Jaccard index <0.7). (H) Heatmap showing the top4 GOBP terms within each module as indicated in (B). The gradient color indicates the significance based on the results of a GOBP enrichment test (purple = low significance, yellow = high significance).
Figure 5
Figure 5. A systematic investigation of structure-specific interactors of Rab5A and Rab2A GTPases.
(A) Crystal structures of Rab5A bound to guanosine-5’-[(β,γ)-imido]triphosphate (GNP) (PDB: 1N6H) and guanosine diphosphate (GDP) (PDB: 1TU4), colored according to their secondary structural elements, are shown to underscore the conformational differences between the GNP- and GDP-bound states of Rab5A. Note that the GNP-bound structure mimics the GTP-bound form. Coil regions are highlighted in green, β-sheets in gray, and α-helices in white. The bound GNP and GDP molecules are depicted in blue, demonstrating the nucleotide interaction sites. (B, C) Barplot with numbers of significantly changing peptides (blue) and corresponding proteins (green) for Rab5A (B) or Rab2A (C) in their GTP- (left) or GDP-bound (right) forms. (D, E) Venn diagrams with the overlap of proteins identified as significantly changing upon the addition of GTP and GDP-bound forms of Rab5A (D) or Rab2A (E). (F) The plots illustrate the extent of overlap between the two nucleotide-bound forms of a bait Rab protein for the top hits in our interaction screen. In each case, the upper row shows the top 50 hits for the indicated bait protein (e.g., Rab5A-GTP) based on correlation to a sigmoidal fit of the dose-response curve (Methods); the lower row shows the results for each candidate interactor for the other form of the protein (e.g., Rab5A-GDP). Hits are arranged alphabetically; color indicates the half-maximal response concentration, and white shows non-interactors. (GI) Venn diagrams showing interactors identified by both MitoID and LiP–MS, compared between both forms of Rab5A and Rab2A (G), GTP-bound forms (H), and GDP-bound forms (I) of the two proteins.

References

    1. Afitska K, Priss A, Yushchenko DA, Shvadchak VV. Structural optimization of inhibitors of α-synuclein fibril growth: affinity to the fibril end as a crucial factor. J Mol Biol. 2020;432:967–977. - PubMed
    1. Antoniou N, Prodromidou K, Kouroupi G, Boumpoureka I, Samiotaki M, Panayotou G, Xilouri M, Kloukina I, Stefanis L, Grailhe R, et al. High content screening and proteomic analysis identify a kinase inhibitor that rescues pathological phenotypes in a patient-derived model of Parkinson’s disease. npj Parkinson’s Dis. 2022;8:1–18. - PMC - PubMed
    1. Auton A, Abecasis GR, Altshuler DM, Durbin RM, Bentley DR, Chakravarti A, Clark AG, Donnelly P, Eichler EE, Flicek P, et al. A global reference for human genetic variation. Nature. 2015;526:68–74. - PMC - PubMed
    1. Barrio-Hernandez I, Schwartzentruber J, Shrivastava A, del-Toro N, Zhang Q, Bradley G, Hermjakob H, Orchard S, Dunham I, Anderson CA, et al (2021) Network expansion of genetic associations defines a pleiotropy map of human cell biology. Nat Genet 55:389–398 - PMC - PubMed
    1. Bates G. Huntingtin aggregation and toxicity in Huntington’s disease. Lancet. 2003;361:1642–1644. - PubMed