

A study on volumetric change of mandibular condyles with osteoarthritis using cone-beam computed tomography
- PMID: 38702404
- PMCID: PMC11068749
- DOI: 10.1038/s41598-024-60404-z
A study on volumetric change of mandibular condyles with osteoarthritis using cone-beam computed tomography
Abstract
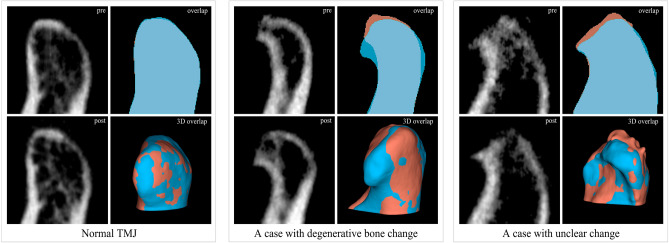
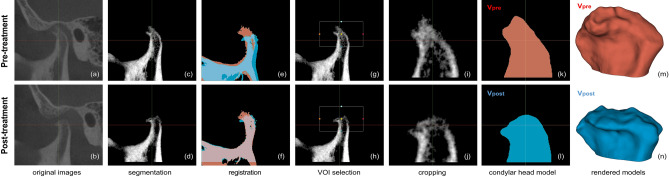
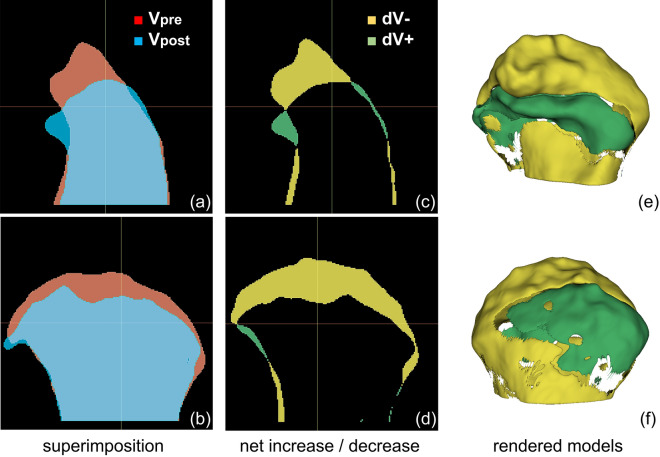
This study aimed to quantitatively assess three-dimensional changes in the mandibular condyle with osteoarthritis using cone-beam computed tomography (CBCT). Pre- and post-treatment CBCT images of temporomandibular joints (TMJs) from 66 patients were used to assess longitudinal changes in condylar volume within individual patients using 3D slicer software. Total volume difference (dV), net increase (dV + , bone deposition), and net decrease (dV- , bone resorption) after treatment were analyzed based on clinical and radiological factors. Condyles with surface erosion at their first visit showed significantly decreased volume after treatment compared to condyles without erosion (p < 0.05). Amounts of bone resorption and deposition were higher in condyles with surface erosion (both p < 0.01). In patients with condylar erosion, the presence of joint pain was associated with a decrease in condylar volume and an increase in net resorption (both p < 0.01). When both joint pain and condylar erosion were present, patients with parafunctional habits showed reduced condylar volume after treatment (p < 0.05). Condylar volume change after treatment was negatively correlated with the duration of pain relief (R = - 0.501, p < 0.05). These results indicate that condylar erosion and TMJ pain could be significant variables affecting TMJ volume changes after treatment. Establishing appropriate treatment strategies is crucial for managing condylar erosion and TMJ pain.
Keywords: Cone-Beam computed tomography; Diagnostic X-Ray radiology; Osteoarthritis; Temporomandibular joint disorders.
© 2024. The Author(s).
Conflict of interest statement
The authors declare no competing interests.
Figures
Similar articles
-
Condylar Erosion in Patients With Chronic Temporomandibular Joint Arthralgia: A Cone-Beam Computed Tomography Study.J Oral Maxillofac Surg. 2016 Jul;74(7):1343.e1-8. doi: 10.1016/j.joms.2016.01.029. Epub 2016 Jan 25. J Oral Maxillofac Surg. 2016. PMID: 26899480
-
Temporomandibular joint osteoarthritis: cone beam computed tomography findings, clinical features, and correlations.Int J Oral Maxillofac Surg. 2015 Oct;44(10):1268-74. doi: 10.1016/j.ijom.2015.06.023. Epub 2015 Jul 17. Int J Oral Maxillofac Surg. 2015. PMID: 26194774
-
Quantification of condylar resorption in temporomandibular joint osteoarthritis.Oral Surg Oral Med Oral Pathol Oral Radiol Endod. 2010 Jul;110(1):110-7. doi: 10.1016/j.tripleo.2010.01.008. Epub 2010 Apr 9. Oral Surg Oral Med Oral Pathol Oral Radiol Endod. 2010. PMID: 20382043 Free PMC article.
-
Correlation of clinical manifestations and condylar morphology of patients with temporomandibular degenerative joint diseases.Cranio. 2024 Sep;42(5):539-546. doi: 10.1080/08869634.2021.2018199. Epub 2022 Jan 5. Cranio. 2024. PMID: 34986737
-
Effects of condylar head surface changes on mandibular position in patients with temporomandibular joint osteoarthritis.J Craniomaxillofac Surg. 2015 Oct;43(8):1380-3. doi: 10.1016/j.jcms.2015.06.031. Epub 2015 Jun 27. J Craniomaxillofac Surg. 2015. PMID: 26209414
Cited by
-
Condylar Remodeling and Skeletal Changes Following Occlusal Splint and Manual Therapy: A Cone Beam Computed Tomography Study in Temporomandibular Disorders.J Clin Med. 2024 Sep 19;13(18):5567. doi: 10.3390/jcm13185567. J Clin Med. 2024. PMID: 39337052 Free PMC article.
-
Trends in dentomaxillofacial radiology.World J Radiol. 2025 Jan 28;17(1):97255. doi: 10.4329/wjr.v17.i1.97255. World J Radiol. 2025. PMID: 39876885 Free PMC article. Review.
References
-
- Zarb GA, Carlsson GE. Temporomandibular disorders: osteoarthritis. J. Orofac. Pain. 1999;13:295–306. - PubMed
Publication types
MeSH terms
LinkOut - more resources
Full Text Sources
Medical
