

Directed physiological networks in the human prefrontal cortex at rest and post transcranial photobiomodulation
- PMID: 38702415
- PMCID: PMC11068774
- DOI: 10.1038/s41598-024-59879-7
Directed physiological networks in the human prefrontal cortex at rest and post transcranial photobiomodulation
Abstract
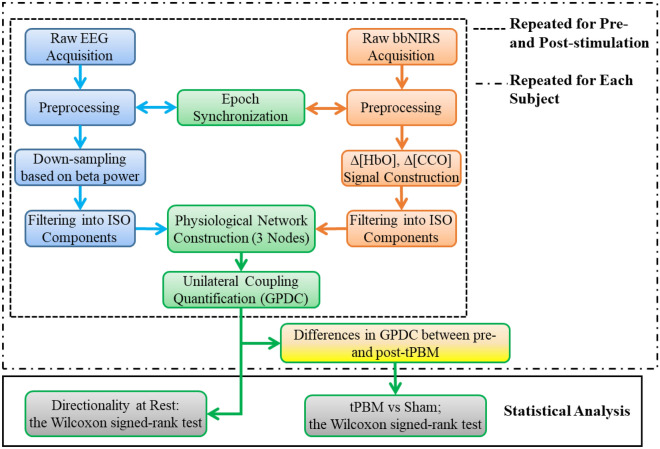
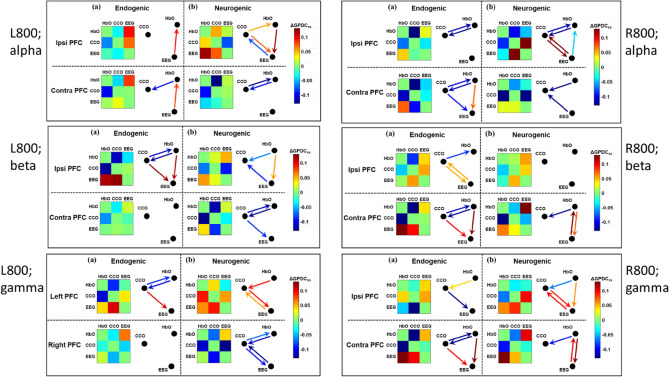
Cerebral infra-slow oscillation (ISO) is a source of vasomotion in endogenic (E; 0.005-0.02 Hz), neurogenic (N; 0.02-0.04 Hz), and myogenic (M; 0.04-0.2 Hz) frequency bands. In this study, we quantified changes in prefrontal concentrations of oxygenated hemoglobin (Δ[HbO]) and redox-state cytochrome c oxidase (Δ[CCO]) as hemodynamic and metabolic activity metrics, and electroencephalogram (EEG) powers as electrophysiological activity, using concurrent measurements of 2-channel broadband near-infrared spectroscopy and EEG on the forehead of 22 healthy participants at rest. After preprocessing, the multi-modality signals were analyzed using generalized partial directed coherence to construct unilateral neurophysiological networks among the three neurophysiological metrics (with simplified symbols of HbO, CCO, and EEG) in each E/N/M frequency band. The links in these networks represent neurovascular, neurometabolic, and metabolicvascular coupling (NVC, NMC, and MVC). The results illustrate that the demand for oxygen by neuronal activity and metabolism (EEG and CCO) drives the hemodynamic supply (HbO) in all E/N/M bands in the resting prefrontal cortex. Furthermore, to investigate the effect of transcranial photobiomodulation (tPBM), we performed a sham-controlled study by delivering an 800-nm laser beam to the left and right prefrontal cortex of the same participants. After performing the same data processing and statistical analysis, we obtained novel and important findings: tPBM delivered on either side of the prefrontal cortex triggered the alteration or reversal of directed network couplings among the three neurophysiological entities (i.e., HbO, CCO, and EEG frequency-specific powers) in the physiological network in the E and N bands, demonstrating that during the post-tPBM period, both metabolism and hemodynamic supply drive electrophysiological activity in directed network coupling of the prefrontal cortex (PFC). Overall, this study revealed that tPBM facilitates significant modulation of the directionality of neurophysiological networks in electrophysiological, metabolic, and hemodynamic activities.
Keywords: Generalized partial directed coherence; Infra-slow oscillation; Neurometabolic coupling; Neurovascular coupling; Transcranial photobiomodulation.
© 2024. The Author(s).
Conflict of interest statement
The authors declare no competing interests.
Figures


Update of
-
Directed physiological networks in the human prefrontal cortex at rest and post transcranial photobiomodulation.Res Sq [Preprint]. 2023 Oct 6:rs.3.rs-3393702. doi: 10.21203/rs.3.rs-3393702/v1. Res Sq. 2023. Update in: Sci Rep. 2024 May 3;14(1):10242. doi: 10.1038/s41598-024-59879-7. PMID: 37886539 Free PMC article. Updated. Preprint.
Similar articles
-
Directed physiological networks in the human prefrontal cortex at rest and post transcranial photobiomodulation.Res Sq [Preprint]. 2023 Oct 6:rs.3.rs-3393702. doi: 10.21203/rs.3.rs-3393702/v1. Res Sq. 2023. Update in: Sci Rep. 2024 May 3;14(1):10242. doi: 10.1038/s41598-024-59879-7. PMID: 37886539 Free PMC article. Updated. Preprint.
-
Site-specific effects of 800- and 850-nm forehead transcranial photobiomodulation on prefrontal bilateral connectivity and unilateral coupling in young adults.Neurophotonics. 2023 Apr;10(2):025012. doi: 10.1117/1.NPh.10.2.025012. Epub 2023 Jun 5. Neurophotonics. 2023. PMID: 37284247 Free PMC article.
-
Enhancement of Frequency-Specific Hemodynamic Power and Functional Connectivity by Transcranial Photobiomodulation in Healthy Humans.Front Neurosci. 2022 Jun 10;16:896502. doi: 10.3389/fnins.2022.896502. eCollection 2022. Front Neurosci. 2022. PMID: 35757526 Free PMC article.
-
Metabolic Connectivity and Hemodynamic-Metabolic Coherence of Human Prefrontal Cortex at Rest and Post Photobiomodulation Assessed by Dual-Channel Broadband NIRS.Metabolites. 2022 Jan 5;12(1):42. doi: 10.3390/metabo12010042. Metabolites. 2022. PMID: 35050164 Free PMC article.
-
Effect of transcranial photobiomodulation on electrophysiological activity of brain in healthy individuals: A scoping review.J Clin Neurosci. 2023 Nov;117:156-167. doi: 10.1016/j.jocn.2023.09.029. Epub 2023 Oct 10. J Clin Neurosci. 2023. PMID: 37826867
Cited by
-
Noninvasive Ultra Low Intensity Light Photodynamic Treatment of Glioblastoma with Drug Augmentation: LoGlo PDT Regimen.Brain Sci. 2024 Nov 21;14(12):1164. doi: 10.3390/brainsci14121164. Brain Sci. 2024. PMID: 39766363 Free PMC article.
-
Effects of transcranial photobiomodulation in cerebral circulation and brain neural oscillations: a systematic review.Lasers Med Sci. 2025 Aug 22;40(1):341. doi: 10.1007/s10103-025-04601-w. Lasers Med Sci. 2025. PMID: 40844561 Review.
-
Site- and electroencephalogram-frequency-specific effects of 800-nm prefrontal transcranial photobiomodulation on electroencephalogram global network topology in young adults.Neurophotonics. 2025 Jan;12(1):015011. doi: 10.1117/1.NPh.12.1.015011. Epub 2025 Feb 27. Neurophotonics. 2025. PMID: 40018415 Free PMC article.
-
Modal Analysis of Cerebrovascular Effects for Digital Health Integration of Neurostimulation Therapies-A Review of Technology Concepts.Brain Sci. 2024 Jun 10;14(6):591. doi: 10.3390/brainsci14060591. Brain Sci. 2024. PMID: 38928591 Free PMC article.
-
Quantification and stimulation of human glymphatic dynamics: New features of Alzheimer's disease and effects of brain photobiomodulation.Res Sq [Preprint]. 2025 Mar 5:rs.3.rs-6115809. doi: 10.21203/rs.3.rs-6115809/v1. Res Sq. 2025. PMID: 40092434 Free PMC article. Preprint.
References
-
- Masamoto K, Hirase H, Yamada K. New Horizons in Neurovascular Coupling: A Bridge Between Brain Circulation and Neural Plasticity. Elsevier; 2016.
Publication types
MeSH terms
Substances
Grants and funding
LinkOut - more resources
Full Text Sources
Miscellaneous
