. 2024 May 3;23(1):87.
doi: 10.1186/s12943-024-02003-0.

Single-cell transcriptome analysis reveals subtype-specific clonal evolution and microenvironmental changes in liver metastasis of pancreatic adenocarcinoma and their clinical implications

Affiliations

Single-cell transcriptome analysis reveals subtype-specific clonal evolution and microenvironmental changes in liver metastasis of pancreatic adenocarcinoma and their clinical implications

Joo Kyung Park et al. Mol Cancer. .

Abstract

Background: Intratumoral heterogeneity (ITH) and tumor microenvironment (TME) of pancreatic ductal adenocarcinoma (PDAC) play important roles in tumor evolution and patient outcomes. However, the precise characterization of diverse cell populations and their crosstalk associated with PDAC progression and metastasis is still challenging.

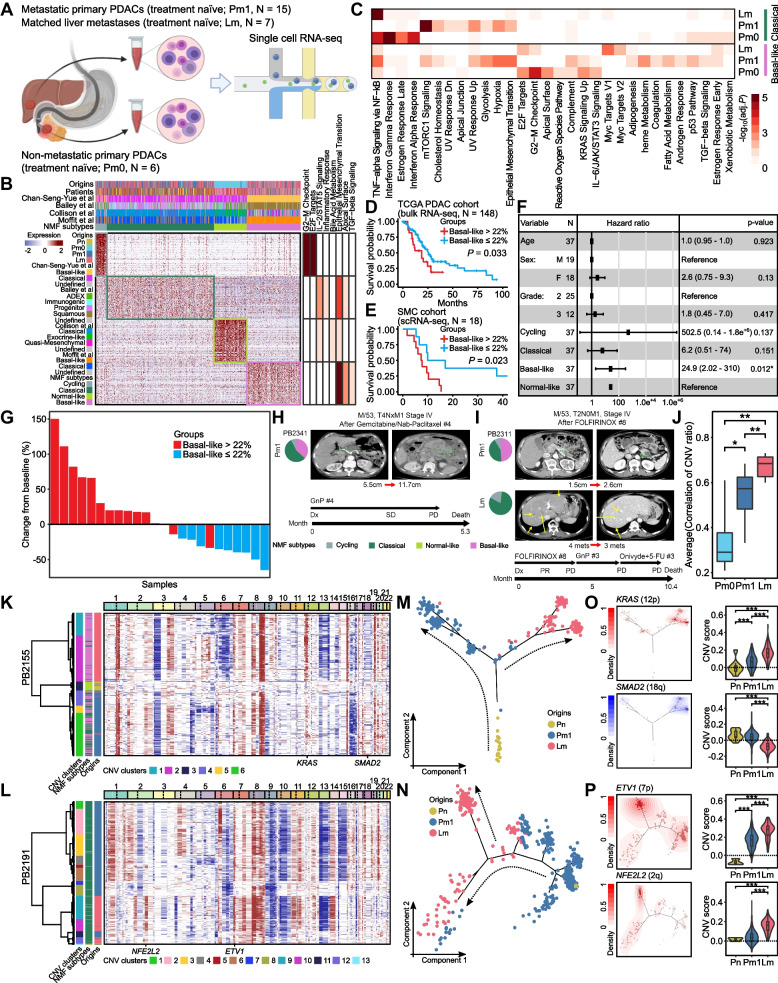
Methods: We performed single-cell RNA sequencing (scRNA-seq) of treatment-naïve primary PDAC samples with and without paired liver metastasis samples to understand the interplay between ITH and TME in the PDAC evolution and its clinical associations.

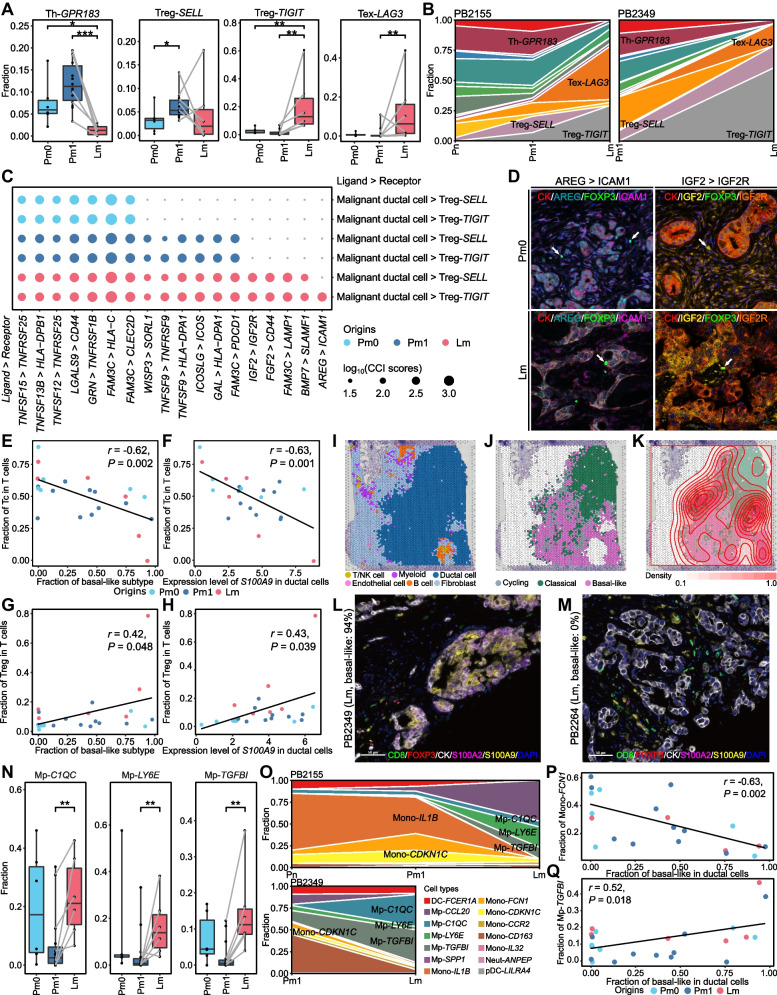
Results: scRNA-seq analysis revealed that even a small proportion (22%) of basal-like malignant ductal cells could lead to poor chemotherapy response and patient survival and that epithelial-mesenchymal transition programs were largely subtype-specific. The clonal homogeneity significantly increased with more prevalent and pronounced copy number gains of oncogenes, such as KRAS and ETV1, and losses of tumor suppressor genes, such as SMAD2 and MAP2K4, along PDAC progression and metastasis. Moreover, diverse immune cell populations, including naïve SELLhi regulatory T cells (Tregs) and activated TIGIThi Tregs, contributed to shaping immunosuppressive TMEs of PDAC through cellular interactions with malignant ductal cells in PDAC evolution. Importantly, the proportion of basal-like ductal cells negatively correlated with that of immunoreactive cell populations, such as cytotoxic T cells, but positively correlated with that of immunosuppressive cell populations, such as Tregs.

Conclusion: We uncover that the proportion of basal-like subtype is a key determinant for chemotherapy response and patient outcome, and that PDAC clonally evolves with subtype-specific dosage changes of cancer-associated genes by forming immunosuppressive microenvironments in its progression and metastasis.

Keywords: Intratumoral heterogeneity; Liver metastasis; Pancreatic ductal adenocarcinoma; Single-cell RNA-sequencing; Tumor microenvironment.


Conflict of interest statement

The authors declare no competing interests.

Figures

Fig. 1
Fig. 1
ScRNA-seq analysis of PDAC subtypes and their clinical relevance. A Schematic of the experimental design. ScRNA-seq was performed on PDAC samples from 21 patients, including non-metastatic PDACs (N = 6), metastatic PDACs (N = 15), and matched liver metastases (N = 7). B Heatmap showing the expression of signature genes for NMF subtypes. Each column in the heatmap corresponds to one cell and each row of the heatmap corresponds to a signature gene of four NMF subtypes. Origin, patient, NMF subtype, and previously reported PDAC classification schemes for each cell are shown at the top of the plot, and the results of GSEA for each signature gene set are shown on the right side of the plot. C Pathway enrichment analysis focusing on origin-specific differences within classical and basal-like subtypes. D and E Kaplan–Meier overall survival curves for PDAC patients based on the fraction of basal-like subtype in the deconvoluted TCGA PDAC RNA-seq dataset (D), and in their primary PDAC in our dataset (SMC cohort) (E). F Forest plot showing the estimated hazard ratios for the clinicopathologic parameters and the proportions of NMF subtypes by multivariate Cox regression analysis of combined scRNA-seq data from our cohort and the two previously published PDAC cohorts. Data are presented as hazard ratio ± 95% confidence interval. G Waterfall plot showing the best percentage change in the sum of the target lesions according to the RECIST v1.1. Each bar indicates a study sample, and the sample is divided into two groups: those with basal-like proportion above 22% (red) and those below (cyan). H and I The proportion of PDAC NMF subtypes and CT scan images before and after chemotherapy of PDAC patients PB2341 (H) and PB2311 (I). J Boxplot showing the distribution of mean CNV correlation coefficients among malignant ductal cells within origins (two-sided Wilcoxon rank sum test: *P < 0.05, **P < 0.01, ***P < 0.001). K and L Hierarchical clustering of CNV profiles in individual patients PB2155 (K) and PB2191 (L). M and N Unsupervised transcriptional trajectories of ductal cells in individual patients PB2155 (M) and PB2191 (N) colored by sample origin. Trajectory directions were indicated by arrows. O and P Dots on trajectory projections (left) were colored by copy number scores at the cellular level and overlaid with contour plots of cells with the strongest copy number variation for known cancer-associated genes in individual patients PB2155 (O) and PB2191 (P). Violin plots (right) showed copy number scores of genes by origin (two-sided Wilcoxon rank sum test: *P < 0.05, **P < 0.01, ***P < 0.001)
Fig. 2
Fig. 2
The interplay between ITH and TME in the primary PDACs and matched liver metastases. A Box plots indicating the percentage differences in T cell subclusters among origins (two-sided Wilcoxon rank sum test: *P < 0.05, **P < 0.01, ***P < 0.001). B Area plots displaying the changes in T cell subcluster composition by origin for each patient. C Dot plots illustrating ligand-receptor interactions between malignant ductal cells and Tregs. The size of a circle indicates an interaction score, and the color of a circle represents the origin. D Multiplex immunohistochemistry (IHC) showing the interaction between ICAM1 (magenta)- or IGF2R (orange)-expressing FOXP3+ (green) Tregs (arrows) and AREG (cyan)- or IGF2 (yellow)-expressing cytokeratin (CK)+ (red) tumor cells. Nuclei are counterstained with DAPI (blue). E and F Scatter plot displaying the correlation between the fraction of basal-like in ductal cells and the fraction of cytotoxic T cells in T cells (E), and between the expression level of S100A9 in ductal cells and the fraction of cytotoxic T cells in T cells (F). G and H Pearson correlation between the proportion of basal-like among ductal cells and the proportion of Tregs among the T cell population (G), and between the expression level of S100A9 in ductal cells and the fraction of Tregs among T cells (H). I and J Mapping of major cell types (I) and NMF subtypes (J) to spatial transcription spots from treatment naïve PDAC patient published by Zhou et al. using a robust cell type decomposition (RCTD) method. K The spots on the spatial transcriptome slide were colored by NMF subtypes and overlaid with contour plots of Treg enriched spots. L and M Multiplex IHC showing the expression of S100A9 (yellow) and the distribution of T cells in basal-like dominant (L) and classical dominant (M) PDAC tissues. CD8 (green) for cytotoxic T cells, FOXP3 (red) for Tregs, CK (white) for ductal cancer cells, S100A2 (magenta) for basal-like ductal cells and DAPI (blue) for nuclei were co-stained. Scale bar, 50 μm. N Box plots indicating the percentage differences in myeloid subclusters among origins (two-sided Wilcoxon rank sum test: *P < 0.05, **P < 0.01, ***P < 0.001). Samples from the same patients were connected by solid lines. O Area plots showing the change in the composition of the myeloid subclusters by origin for each patient. P and Q Scatter plot displaying the Pearson correlation between the fraction of basal-like in ductal cells and the fraction of Mono-FCN1 (P) and Mp-TGFBI (Q)

References

    1. Siegel RL, Miller KD, Jemal A. Cancer statistics, 2018. CA Cancer J Clin. 2018;68:7–30. doi: 10.3322/caac.21442. - DOI - PubMed
    1. Ryan DP, Hong TS, Bardeesy N. Pancreatic adenocarcinoma. N Engl J Med. 2014;371:1039–1049. doi: 10.1056/NEJMra1404198. - DOI - PubMed
    1. Zhang Y, Lazarus J, Steele NG, Yan W, Lee HJ, Nwosu ZC, Halbrook CJ, Menjivar RE, Kemp SB, Sirihorachai VR, et al. Regulatory T-cell depletion alters the tumor microenvironment and accelerates pancreatic carcinogenesis. Cancer Discov. 2020;10:422–439. doi: 10.1158/2159-8290.CD-19-0958. - DOI - PMC - PubMed
    1. Hwang WL, Jagadeesh KA, Guo JA, Hoffman HI, Yadollahpour P, Reeves JW, Mohan R, Drokhlyansky E, Van Wittenberghe N, Ashenberg O, et al. Single-nucleus and spatial transcriptome profiling of pancreatic cancer identifies multicellular dynamics associated with neoadjuvant treatment. Nat Genet. 2022;54:1178–1191. doi: 10.1038/s41588-022-01134-8. - DOI - PMC - PubMed
    1. Cui Zhou D, Jayasinghe RG, Chen S, Herndon JM, Iglesia MD, Navale P, Wendl MC, Caravan W, Sato K, Storrs E, et al. Spatially restricted drivers and transitional cell populations cooperate with the microenvironment in untreated and chemo-resistant pancreatic cancer. Nat Genet. 2022;54:1390–1405. doi: 10.1038/s41588-022-01157-1. - DOI - PMC - PubMed

Publication types

MeSH terms

Substances