. 2024 May 3;22(1):422.
doi: 10.1186/s12967-024-05238-z.

Integrative analyses of bulk and single-cell transcriptomics reveals the infiltration and crosstalk of cancer-associated fibroblasts as a novel predictor for prognosis and microenvironment remodeling in intrahepatic cholangiocarcinoma

Affiliations

Integrative analyses of bulk and single-cell transcriptomics reveals the infiltration and crosstalk of cancer-associated fibroblasts as a novel predictor for prognosis and microenvironment remodeling in intrahepatic cholangiocarcinoma

Yan-Jie Zhong et al. J Transl Med. .

Abstract

Background: Intrahepatic cholangiocarcinoma (ICC) is a highly malignant neoplasm and characterized by desmoplastic matrix. The heterogeneity and crosstalk of tumor microenvironment remain incompletely understood.

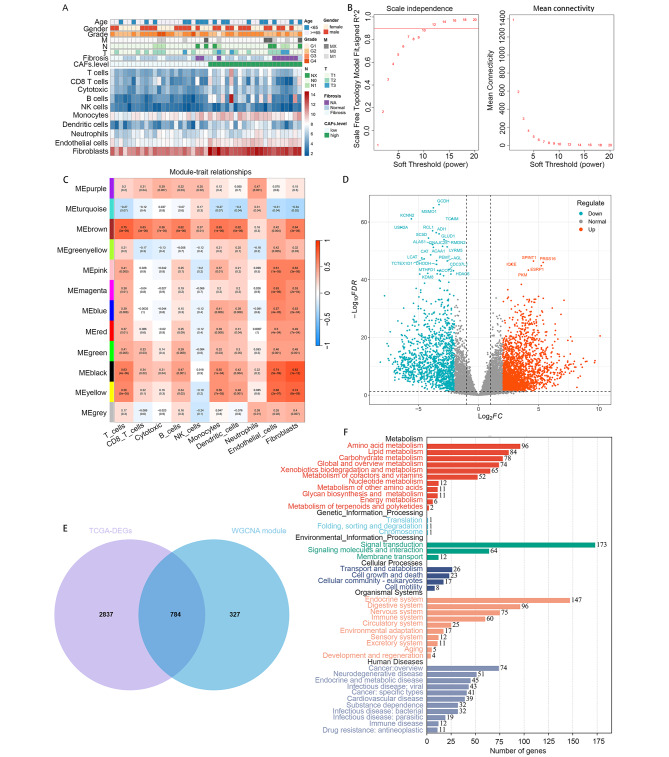
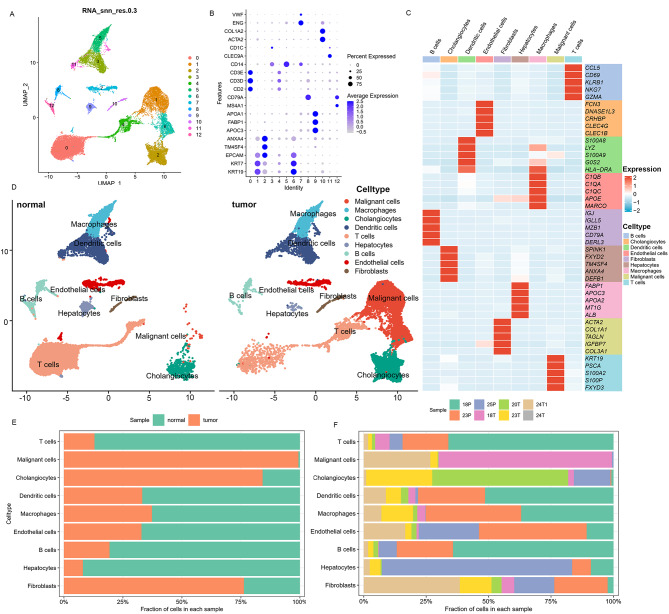
Methods: To address this gap, we performed Weighted Gene Co-expression Network Analysis (WGCNA) to identify and construct a cancer associated fibroblasts (CAFs) infiltration biomarker. We also depicted the intercellular communication network and important receptor-ligand complexes using the single-cell transcriptomics analysis of tumor and Adjacent normal tissue.

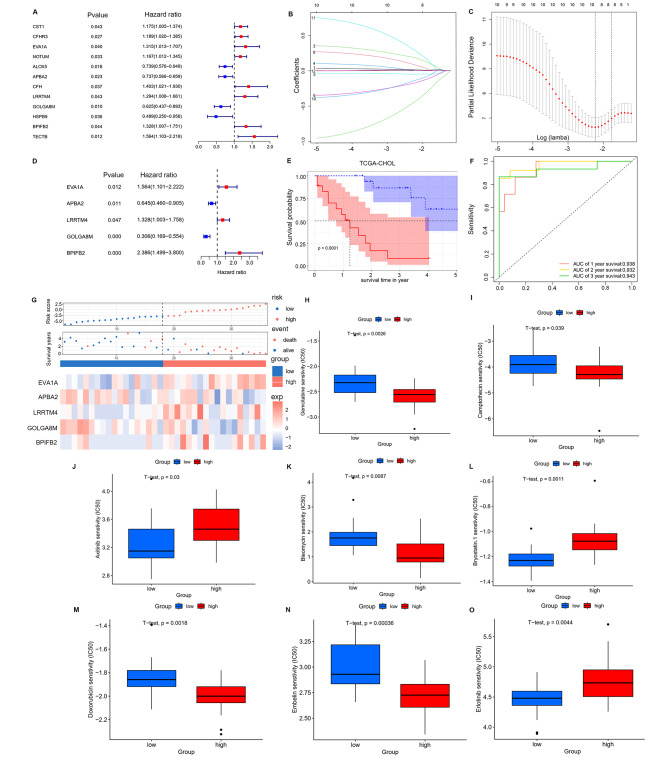
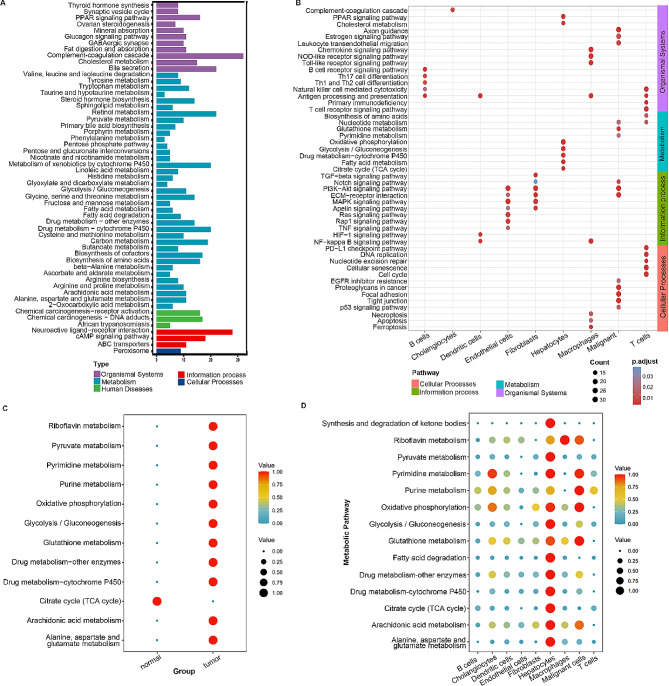
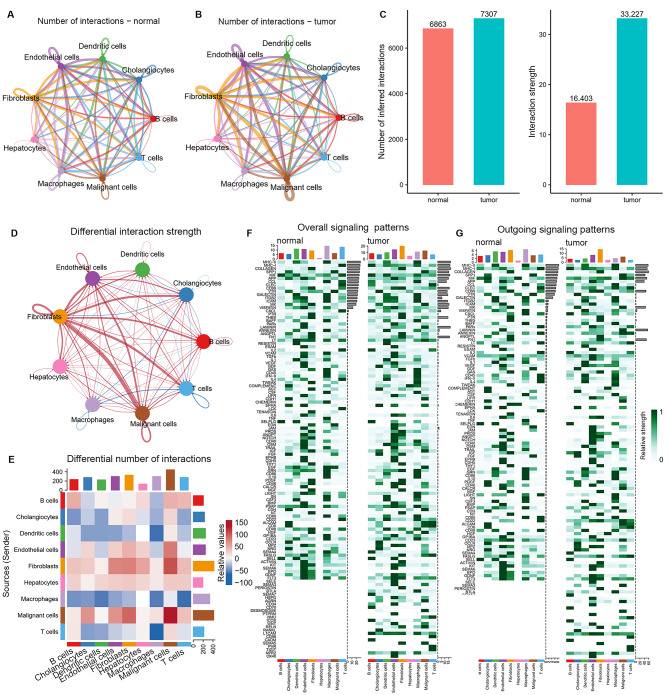
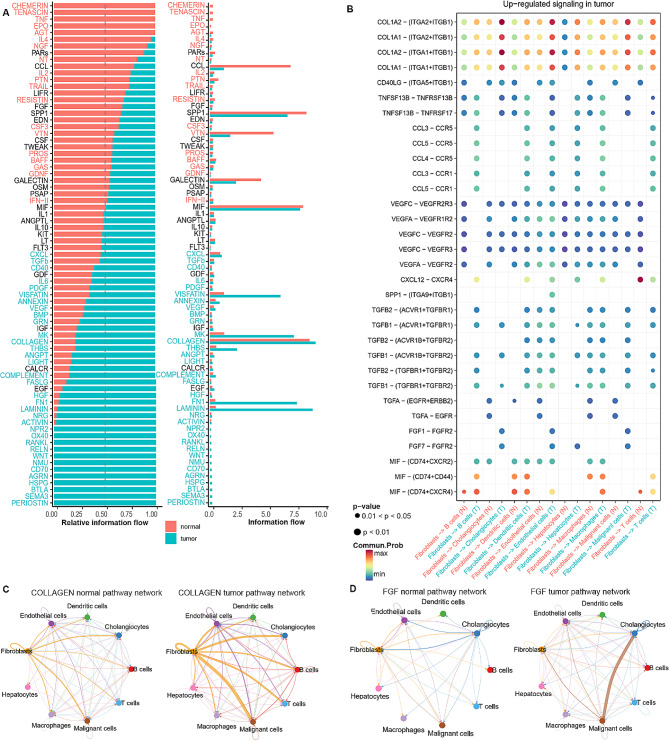
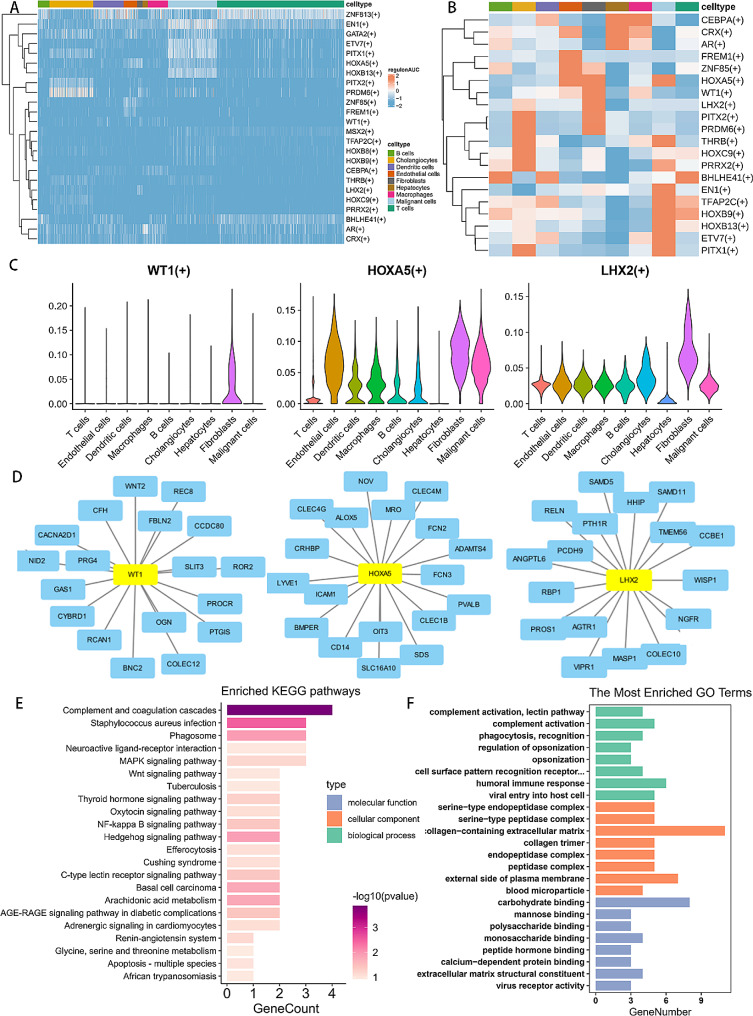
Results: Through the intersection of TCGA DEGs and WGCNA module genes, 784 differential genes related to CAFs infiltration were obtained. After a series of regression analyses, the CAFs score was generated by integrating the expressions of EVA1A, APBA2, LRRTM4, GOLGA8M, BPIFB2, and their corresponding coefficients. In the TCGA-CHOL, GSE89748, and 107,943 cohorts, the high CAFs score group showed unfavorable survival prognosis (p < 0.001, p = 0.0074, p = 0.028, respectively). Additionally, a series of drugs have been predicted to be more sensitive to the high-risk group (p < 0.05). Subsequent to dimension reduction and clustering, thirteen clusters were identified to construct the single-cell atlas. Cell-cell interaction analysis unveiled significant enhancement of signal transduction in tumor tissues, particularly from fibroblasts to malignant cells via diverse pathways. Moreover, SCENIC analysis indicated that HOXA5, WT1, and LHX2 are fibroblast specific motifs.

Conclusions: This study reveals the key role of fibroblasts - oncocytes interaction in the remodeling of the immunosuppressive microenvironment in intrahepatic cholangiocarcinoma. Subsequently, it may trigger cascade activation of downstream signaling pathways such as PI3K-AKT and Notch in tumor, thus initiating tumorigenesis. Targeted drugs aimed at disrupting fibroblasts-tumor cell interaction, along with associated enrichment pathways, show potential in mitigating the immunosuppressive microenvironment that facilitates tumor progression.

Keywords: Cancer-associated fibroblasts; Intercellular communication; Intrahepatic cholangiocarcinoma; Prognosis; Single cell transcriptomic; WGCNA.


Conflict of interest statement

The authors declare that they have no competing interests.

Figures

Fig. 1
Fig. 1
Screening of CAFs-inflitration related genes. (A) Various TME cell abundances in the TCGA cohort are shown in the heat map. Associations between CAFs level and clinicopathological characteristics are also illustrated as an annotation. (B) The nature of the network topology constructed with unique power values. (C) The correlation between different modules and the proportion of CAFs-high and low infiltration. (D) Volcano plot of differentially expressed genes (DEGs) in TCGA-CHOL. (E) Venn plot shows the hub genes intersected by DEG and WGCNA. (F) KEGG functional enrichment analysis of hub genes in TCGA-CHOL dataset
Fig. 2
Fig. 2
CAFs-related risk model identification and chemosensitivity analysis in the training and validation cohorts. (A) Twelve prognostic genes were screened from the 784 genes by univariate Cox analysis. (B-C) Coefficient distribution plots of log (lamda) sequences (B) and selection of optimal parameters (lambda) in the LASSO model (C). (D) Five prognostic genes were screened after multivariate Cox analysis. (E) Survival probability between patients with high and low CAFs scores. (F) ROC curves of CAFs scores in the training set. (G) Risk score distribution, survival status and genes expression patterns for patients in high- and low-CAFs scores groups. (H-I) Association between the CAFs scores and chemosensitivity in TCGA cohort. The box plots of the estimated IC50 for Gemcitabine, Camptothecin, Axitinib, Bleomycin, Bryostatin.1, Doxorubicin, Embelin, and Erlotinib were shown in the two groups
Fig. 3
Fig. 3
Validation of the risk signature for survival prediction in GSE89748 and GSE107943 sets. (A-B) Kaplan–Meier curve analysis of overall survival in two validation cohorts. (C-D) Risk score distribution, survival status and genes expression patterns in high- and low-CAFs scores groups. (E-F) Time-dependent ROC curves analysis
Fig. 4
Fig. 4
Single-cell Atlas of adjacent normal and tumor tissues. (A) UMAP plot for 13 distinct cell subclusters. (B) Dot plots depicting average expression of known markers in indicated cell clusters. (C) Heatmap showing the cell-type-specific top 5 DEGs (Wilcoxon test). (D) UMAP plots of cells from adjacent normal and tumor tissues of 5 ICC patients showing 9 clusters in each plot. (E-F) Proportion of 9 major cell types showing in bar plots in different tissues (E) and donors (F)
Fig. 5
Fig. 5
Pathway analysis in sample types and cellular subpopulations. (A) KEGG analysis of the Single cell global differentially expressed genes. (B) Functional annotation of nine cellular subpopulations. (C) Metabolic-related pathways comparison between tumor and adjacent normal tissues. (D) Dot plots show the specific metabolic pathways that were enriched in each cell subpopulation
Fig. 6
Fig. 6
Comparison of cellular interactions between samples from tumor and adjacent normal tissues. (A-B) Cellular interaction number and strength. (C) Bar graph illustrating the total number (left) and weight (right) of ligand − receptor interactions between samples from tumor and adjacent normal tissues. (D-E) Communication quantity and intensity differences network. Red and blue colors represent upregulated and downregulated pathways, respectively, relative to normal tissues (D). (F-G) Heatmap showing possible afferent or efferent signaling pathways between cells
Fig. 7
Fig. 7
Comparison of cellular interactions between samples from tumor and adjacent normal tissues. (A) Comparative profiles of pathway signal intensities indicating conserved and specific signaling pathways in tumor and normal tissue samples. (B) Dot plots show the variation in the signaling action of fibroblasts relative to other cell types. (C-D) The COLLAGEN (C) and FGF (D) signaling pathway network in normal and tumor
Fig. 8
Fig. 8
Characterization of fibroblasts subgroups in normal and tumor tissues. (A) Dot plot showing marker genes in each cluster. (B) UMAP plots of six different fibroblasts subpopulations. (C) Distribution of different fibroblasts subgroups from diverse sample origins. (D) Heatmap of the top 5 differentially expressed genes (DEGs) across six fibroblasts clusters. (E) Dot plots show the pathways that were enriched in each fibroblasts subpopulation. (F) Cellular interaction number and strength in normal and tumor groups
Fig. 9
Fig. 9
Transcription factor analysis of fibroblast infiltration associated genes. (A) Heatmap of the AUC scores of transcription factors (TFs) motifs in each cell subtype estimated per cell by pySCENIC. (B) Heatmap shows the specific transcription factors (TFs) in each cell subtypes. (C) Violin diagram showing the expression levels of transcription factors. (D) Fibroblasts-specific transcription factors and their targeted genes. (E-F) KEGG and GO analysis of the fibroblasts-specific transcription factors and their targeted genes

References

    1. Kelley RK, Bridgewater J, Gores GJ, Zhu AX. Systemic therapies for intrahepatic cholangiocarcinoma. J Hepatol. 2020;72:353–63. doi: 10.1016/j.jhep.2019.10.009. - DOI - PubMed
    1. Ali PI, Saleem K, Aboul-Enein H, Rather M, Imran D. Social Aspects of Cancer Genesis.
    1. Ali I, Alsehli M, Scotti L, Tullius Scotti M, Tsai S-T, Yu R-S, Hsieh MF, Chen J-C. Progress in polymeric nano-medicines for theranostic cancer treatment. 2020;12:598. - PMC - PubMed
    1. Sirica AE, Gores GJ. Desmoplastic stroma and cholangiocarcinoma: clinical implications and therapeutic targeting. Hepatology. 2014;59:2397–402. doi: 10.1002/hep.26762. - DOI - PMC - PubMed
    1. Sirica AE, Gores GJ, Groopman JD, Selaru FM, Strazzabosco M, Wei Wang X, Zhu AX. Intrahepatic Cholangiocarcinoma: Continuing challenges and translational advances. Hepatology. 2019;69:1803–15. doi: 10.1002/hep.30289. - DOI - PMC - PubMed

Publication types

MeSH terms