. 2024 Jul 3;32(7):2264-2285.
doi: 10.1016/j.ymthe.2024.04.034. Epub 2024 May 3.

Chandipura viral glycoprotein (CNV-G) promotes Gectosome generation and enables delivery of intracellular therapeutics

Affiliations

Chandipura viral glycoprotein (CNV-G) promotes Gectosome generation and enables delivery of intracellular therapeutics

Xiaojuan Zhang et al. Mol Ther. .

Abstract

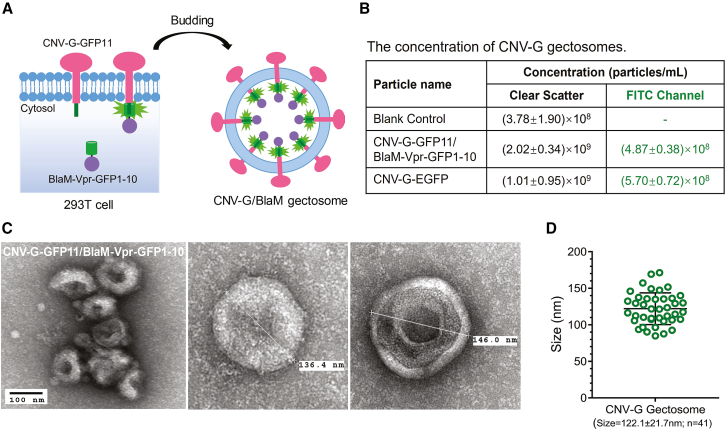
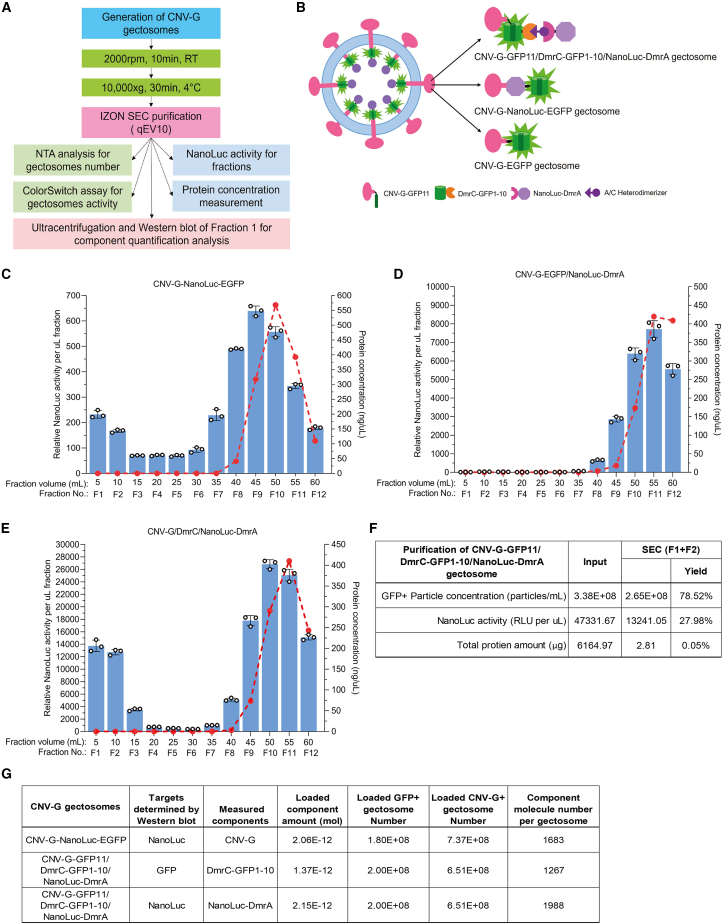
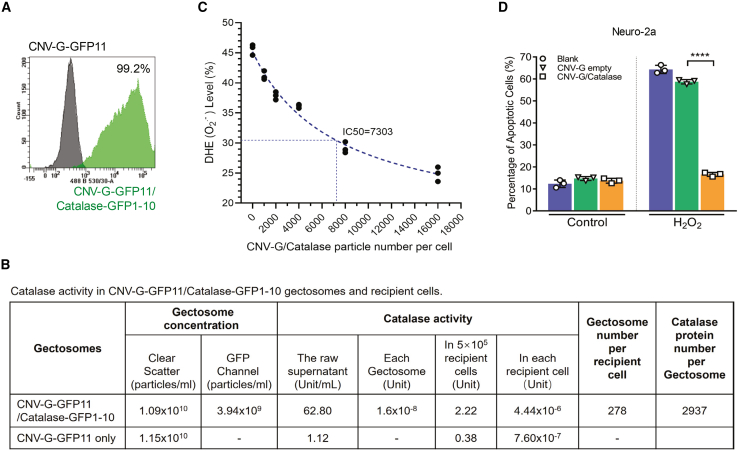
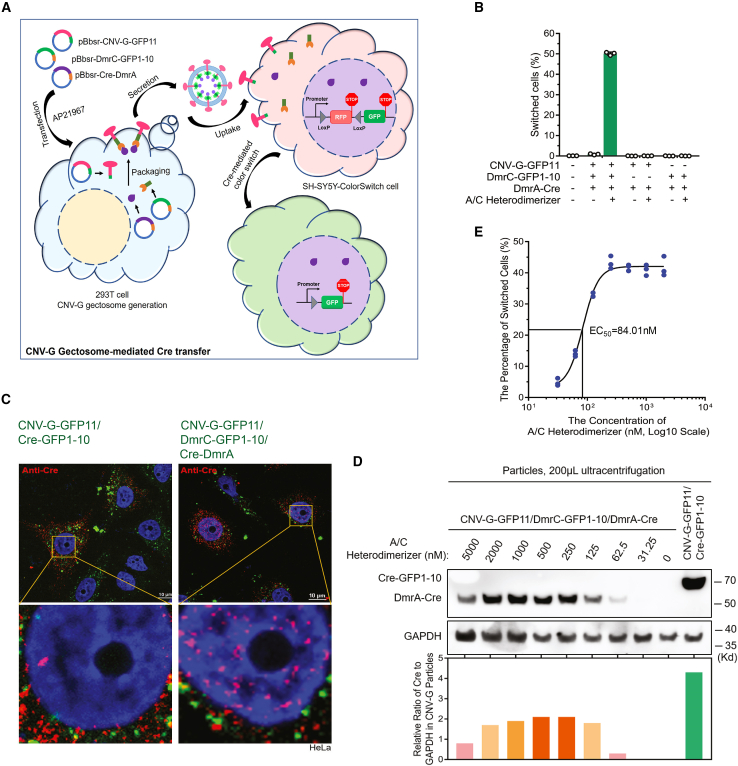
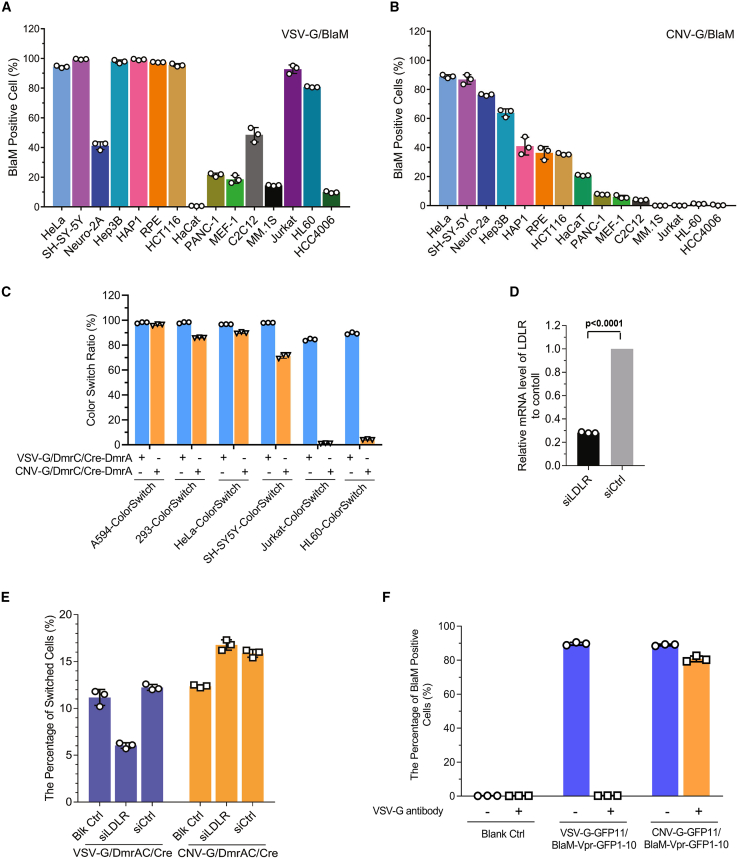
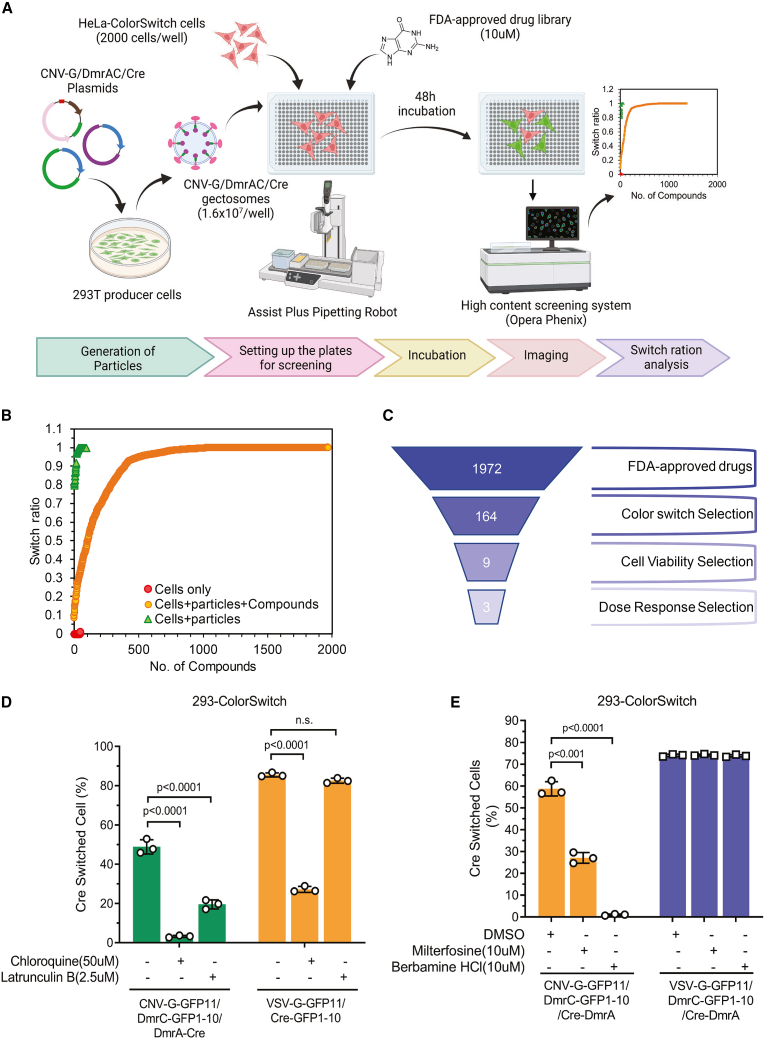
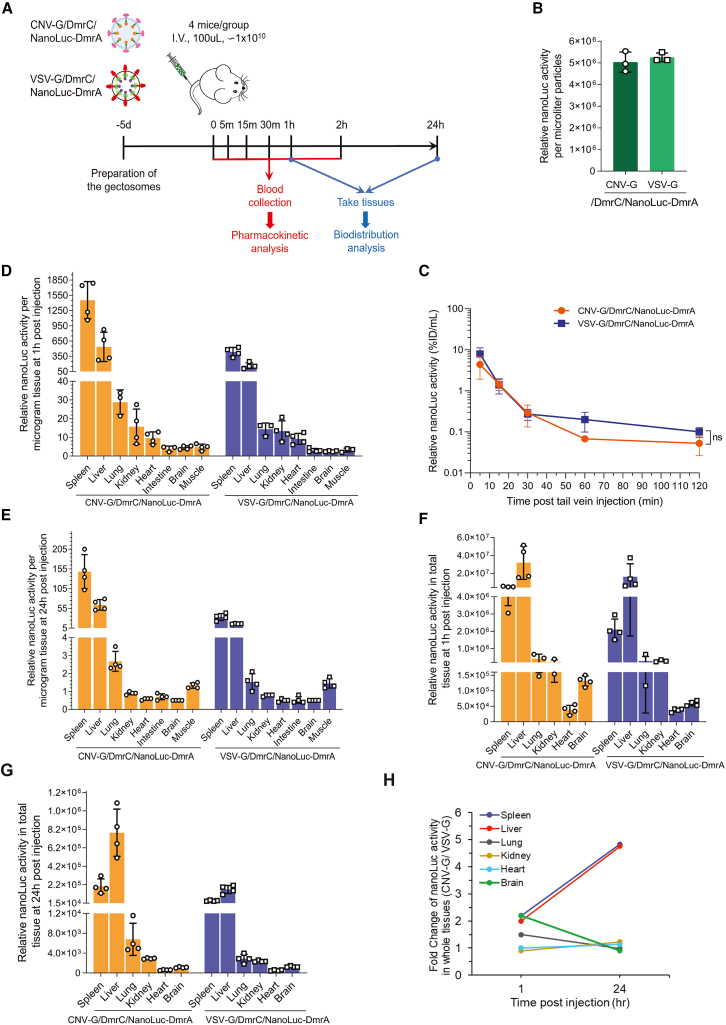
Overexpression of vesicular stomatitis virus G protein (VSV-G) elevates the secretion of EVs known as gectosomes, which contain VSV-G. Such vesicles can be engineered to deliver therapeutic macromolecules. We investigated viral glycoproteins from several viruses for their potential in gectosome production and intracellular cargo delivery. Expression of the viral glycoprotein (viral glycoprotein from the Chandipura virus [CNV-G]) from the human neurotropic pathogen Chandipura virus in 293T cells significantly augments the production of CNV-G-containing gectosomes. In comparison with VSV-G gectosomes, CNV-G gectosomes exhibit heightened selectivity toward specific cell types, including primary cells and tumor cell lines. Consistent with the differential tropism between CNV-G and VSV-G gectosomes, cellular entry of CNV-G gectosome is independent of the Low-density lipoprotein receptor, which is essential for VSV-G entry, and shows varying sensitivity to pharmacological modulators. CNV-G gectosomes efficiently deliver diverse intracellular cargos for genomic modification or responses to stimuli in vitro and in the brain of mice in vivo utilizing a split GFP and chemical-induced dimerization system. Pharmacokinetics and biodistribution analyses support CNV-G gectosomes as a versatile platform for delivering macromolecular therapeutics intracellularly.

Keywords: CNV-G; Chandipura virus; VSV-G; biodistribution; catalase; exosomes; gectosomes; genome editing; macromolecule delivery; pharmacokinetics.


Conflict of interest statement

Declaration of interests The University of Colorado-Boulder currently holds the PCT patents for the use of gectosome technology, with X.Z., Q.X., Z.L., and X.L. as inventors. X.L. is a co-founder and member of the Scientific Advisory Board of OnKure Inc., which has no relationships or competing interests to this study. X.L. owns equity in OnKure Inc. X.L. is also a co-founder and interim president of Vesicle Therapeutics, Inc, a startup company that licensed gectosome technology from the University of Colorado-Boulder. X, L., X.Z., and Q.X. own equity in Vesicle Therapeutics, Inc.

Figures

None
Graphical abstract
Figure 1
Figure 1
Generation and characterization of CNV-G gectosomes (A) Schematic illustration depicting CNV-G gectosome generation: CNV-G-GFP11 and BlaM-Vpr-GFP1-10 are co-expressed in 293T cells, leading to the packaging of the cargo protein BlaM-Vpr-GFP1-10. These CNV-G gectosomes carrying BlaM-Vpr-GFP1-10 are subsequently secreted from the 293T producer cell. (B) Nanoparticle tracking analysis showing the concentration of EVs in the supernatants from CNV-G-EGFP, co-transfected with CNV-G-GFP11/BlaM-Vpr-GFP1-10 cells, and non-transfected cells. Results are presented as mean ± SD for technical replicates (n = 3), reflecting data from 10 separate experiments. (C) Representative TEM images of CNV-G-ELD-GFP11/BlaM-Vpr-GFP1-10 gectosomes. (D) Size distribution analysis of CNV-G-ELD-GFP11/BlaM-Vpr-GFP1-10 gectosomes based on TEM imaging.
Figure 2
Figure 2
Purification and component quantification of CNV-G gectosomes (A) Flowchart of the purification and quantification steps for CNV-G gectosomes. (B) Schematic diagram illustrating three types of CNV-G gectosomes (CNV-G-GFP-11/DmrC-GFP1-10/NanoLuc-DmrA, CNV-G-NanoLuc-EGFP or CNV-G-EGFP) employed in the purification and component quantification studies. (C) NanoLuc activity and protein concentrations in SEC fractions of CNV-G-NanoLuc-EGFP gectosomes. (D) NanoLuc activity and protein concentrations in SEC fractions of CNV-G-EGFP gectosomes generated from HEK293T cells transiently transfected with CNV-G-EGFP and NanoLuc-DmrA plasmids to assess passive cargo packaging. (E) NanoLuc activity and protein concentrations in SEC fractions of CNV-G-GFP-11/DmrC-GFP1-10/NanoLuc-DmrA (CNV-G/DmrC/NanoLuc-DmrA) gectosomes. (F) SEC purification efficiency and yield summary. (G) Results of the quantitative component analysis for CNV-G-GFP11, DmrC-GFP1-10, or NanoLuc-DmrA cargo in CNV-G gectosomes based on concentration estimations and GFP, NanoLuc quantifications via western blot analysis.
Figure 3
Figure 3
Delivery of catalases by CNV-G gectosomes relieves oxidative stress in recipient cells (A) Flow cytometry analysis showing positive GFP fluorescence in HEK293T cells after co-transfection with CNV-G-GFP11 and catalase-GFP1-10 expression vectors. (B) Quantitative catalase activity assessment in both CNV-G-GFP11/catalase-GFP1-10 gectosomes and target cells. The number of gectosomes interacting with each recipient cell and the catalase content within individual gectosomes were measured. Nanoparticle tracking analysis was used to measure CNV-G/catalase gectosome concentrations in the GFP channel, while the Catalase Colorimetric Activity Kit was used to measure catalase activity and amount in gectosomes and recipient cells. (C) Dose effect of delivered catalase on ROS levels in HeLa recipient cells. ROS levels were detected using DHE (20 μM) as a fluorescent probe. After a 12-h incubation with varied concentrations of CNV-G/catalase gectosomes, HeLa cells were treated with H2O2 (100 μM) for 24 h, followed by DHE incubation for 30 min. Flow cytometry analysis was subsequently performed to measure ROS levels. (D) Alleviation of oxidative stress in Neuro-2a cells by catalase delivered through CNV-G/catalase gectosomes. Neuro-2a cells were treated with CNV-G/catalase gectosomes or CNV-G empty gectosomes for 12 h before a 12-h H2O2 (500 μM) challenge, followed by an apoptotic assay. ∗∗∗∗p < 0.0001.
Figure 4
Figure 4
Delivery of Cre protein into nucleus with three-component CNV-G gectosomes (A) Illustrated overview of the experiment of CNV-G-mediated delivery of Cre (not to scale). (B) Functional delivery of Cre into the nucleus using a three-component CNV-G gectosome system. Flow cytometric analysis of 293-ColorSwitch cells (approximately 1 × 105) treated with CNV-G-GFP11/DmrC-GFP1-10/Cre-DmrA gectosomes (GFP-positive particle number, approximately 4 × 108) generated from HEK293T cells transfected with varying combinations of CNV-G-GFP11, DmrC-GFP1-10, and DmrA-Cre, in the presence or absence of A/C heterodimerizer (AP21967). (C) Confocal microscopy images showing the intracellular localization of Cre in HeLa after incubation with CNV-G gectosomes from a two-component system (CNV-G-GFP11/Cre-GFP1-10) or a three-component system (CNV-G-GFP11/DmrC-GFP1-10/Cre-DmrA). Green fluorescence indicates split GFP-complemented gectosomes, red signifies Cre protein, and nuclei are marked by DAPI. Areas in orange boxes are magnified for detail. (D) and (E) Dose-response effects of A/C heterodimerizer on Cre-DmrA cargo loading into CNV-G gectosomes. Immunoblotting analysis with Cre antibody and GAPDH (loading control) was performed on CNV-G-GFP11/DmrC-GFP1-10/Cre-DmrA gectosomes generated in the presence of various concentrations of A/C heterodimerizer. (C) Representative result of immunoblotting analysis. (D) Response curve of A/C heterodimerizer on the percentage of switched cells in SH-SY5Y-ColorSwitch recipient cells against A/C heterodimerizer concentrations, with an estimated median effective concentration (EC50) value of approximately 84 nM. Data represent the average ± SD (n = 3).
Figure 5
Figure 5
CNV-G gectosomes exhibit more restricted cellular tropism than VSV-G gectosomes (A and B) Investigation into the cell-type specificity of CNV-G gectosomes relative to VSV-G gectosomes. Various cell lines were exposed to CNV-G-GFP11/BlaM-Vpr-GFP1-10 (CNV-G/BlaM) or VSV-G-GFP11/BlaM-Vpr-GFP1-10 (VSV-G/BlaM) gectosomes, followed by detection of BlaM activity using flow cytometry following labeling with the CCF2-AM substrate. (C) Assessment of cellular tropism using CNV-G or VSV-G gectosomes with a three-component system (CNV-G-GFP11/DmrC-GFP1-10/Cre-DmrA or VSV-G-GFP11/DmrC-GFP1-10/Cre-DmrA) in six color-switch cell lines. Flow cytometric analysis was utilized to evaluate the color conversion of target cells after treatment with gectosomes (GFP-positive particles, 1 × 109 particles/mL, 1 mL per well) for 48 h. Data are presented as the mean ± SD from three replicates (n = 3). (D and E) Impact of LDLR knockdown on the percentage of switched cells induced by VSV-G gectosomes and CNV-G gectosomes. We exposed 293-ColorSwitch cells treated with siLDLR for 48 h to CNV-G-GFP11/DmrC-GFP1-10/Cre-DmrA or VSV-G-GFP11/DmrC-GFP1-10/Cre-DmrA gectosomes for 48 h, followed by flow cytometric analysis to detect the percentage of switched cells. (D) RT-qPCR data confirming LDLR knockdown efficiency. (F) Evaluation of VSV-G antibody blocking efficacy on CNV-G gectosome uptake. CNV-G-GFP11/BlaM-Vpr-GFP1-10 and VSV-G-GFP11/BlaM-Vpr-GFP1-10 gectosomes were incubated with VSV-G antibody (1:1,000) overnight at 4°C before application to recipient HeLa cells. After 16 h, treated recipient cells were labeled with the BlaM substrate CCF2-AM and analyzed via flow cytometry. Data are presented as the mean ± SD (n = 3).
Figure 6
Figure 6
CNV-G gectosomes utilize distinct pathways for cellular entry compared with VSV-G gectosomes (A) Schematic outline of the methodology for inhibitor screening against CNV-G gectosome uptake. HeLa-ColorSwitch cells (2,000 cells/well) in 384-well plates were treated with CNV-G-GFP11/DmrC-GFP1-10/Cre-DmrA (CNV-G/DmrAC/Cre) gectosomes (approximately 1.6 × 107 particles/well). The cells were pretreated with compounds from FDA-approved drug libraries (final concentration = 10 μM). After 48 h, the plates were scanned with Opera Phenix to measure the switched ratio. (B) Ranking of compound activity from the inhibitor screening for CNV-G gectosome-mediated Cre delivery. (C) Screen funnel illustrating the process of hit selection and filtering steps. (D) Evaluation of chloroquine and latrunculin B effects on Cre cargo delivery efficiency in 293-ColorSwitch cells via CNV-G gectosomes compared with VSV-G gectosomes. Data are presented as the mean ± SD (n = 3). (E) Assessment the effect of miltefosine and berbamine HCl on the delivery efficiency of Cre protein into 293-ColorSwitch cells via CNV-G gectosomes versus VSV-G gectosomes. Data are presented as the mean ± SD (n = 3).
Figure 7
Figure 7
PK and biodistribution studies of CNV-G and VSV-G gectosomes (A) Diagram illustrating the experimental setup for PK and biodistribution analyses of CNV-G-GFP11/DmrC-GFP1-10/NanoLuc-DmrA (CNV-G/DmrC/NanoLuc-DmrA) and VSV-G-GFP11/DmrC-GFP1-10/NanoLuc-DmrA (VSV-G/DmrC/NanoLuc-DmrA) gectosomes in mice. (B) Analysis of NanoLuc activity in CNV-G/DmrC/NanoLuc-DmrA and VSV-G/DmrC/NanoLuc-DmrA gectosomes prior to mouse injection. (C) PK results depicting the temporal changes in NanoLuc activity per microliter of serum over time after tail vein injection of either CNV-G/DmrC/NanoLuc-DmrA or VSV-G/DmrC/NanoLuc-DmrA. NanoLuc activity in serum was measured at various time points after injection (N = 4). (D) and (E) Measurement of relative NanoLuc activity per microgram of tissue at 1 h or 24 h after injection for CNV-G/DmrC/NanoLuc-DmrA or VSV-G-GFP11/DmrC-GFP1-10/NanoLuc-DmrA gectosomes (N = 4). (F) and (G) Relative NanoLuc activity normalized to total tissue weight at 1 h or 24 h after injection of CNV-G/DmrC/NanoLuc-DmrA or VSV-G/DmrC/NanoLuc-DmrA gectosomes (N = 4). (H) Fold change in NanoLuc activity in whole tissues from mice injected with CNV-G/DmrC/NanoLuc-DmrA relative to those injected with VSV-G/DmrC/NanoLuc-DmrA.
Figure 8
Figure 8
CNV-G gectosomes can deliver cargos to neuronal cells in vitro and in vivo (A) Uptake of CNV-G gectosomes by human cortical GABAergic neurons. Human cortical GABAergic neurons were treated with CNV-G-GFP11/BlaM-Vpr-GFP1-10 gectosomes for 16 h, followed by CCF2-AM labeling. Uptake efficiency was quantified using fluorescence microscopy and flow cytometry. (B) Delivery of Cre using CNV-G gectosomes into neuronal cells of ROSAnTnG mice in vitro. Neuronal cells isolated from a ROSAnTnG mouse were incubated with CNV-G-GFP11/DmrC-GFP1-10/Cre-DmrA gectosomes (GFP-positive particle number, approximately 4 × 108; CNV-G-GFP11/BlaM-Vpr-GFP1-10 as control) for 48 h in 12-well plates (approximately 1 × 105 cells/well) prior to the flow cytometric analysis. The data show the percentage of color conversion (mean ± SD, n = 3). (C) Uptake of CNV-G gectosomes in different primary neuronal cell types. Primary mouse microglia, hippocampal neurons, cortex neurons, and astrocytes were seeded at 5 × 104 cells/well and incubated with CNVG/BlaM or VSV-G/BlaM gectosomes (1 × 108 particles/mL/well) for 16 h, followed by labeling with CCF2-AM dye and flow cytometry analysis to measure the percentage of BlaM-positive cells. Data are presented as mean ± SE (n = 2). (D) Delivery of Cre to mouse hippocampal neuronal cells in vivo. CNV-G-GFP11/DmrC-GFP1-10/DmrA-Cre gectosomes (approximately 5 × 107 particles/mouse in 500 nL PBS) were intracranially injected into mice (N = 3). Six weeks after injection, the mouse brains were sectioned, and the sections were scanned by confocal microscopy to quantify the efficiency of Cre delivery by measuring the switch ratio.

References

    1. Hou X., Zaks T., Langer R., Dong Y. Lipid nanoparticles for mRNA delivery. Nat. Rev. Mater. 2021;6:1078–1094. - PMC - PubMed
    1. Mathieu M., Martin-Jaular L., Lavieu G., Théry C. Specificities of secretion and uptake of exosomes and other extracellular vesicles for cell-to-cell communication. Nat. Cell Biol. 2019;21:9–17. - PubMed
    1. Pegtel D.M., Gould S.J. Exosomes. Annu. Rev. Biochem. 2019;88:487–514. - PubMed
    1. Herrmann I.K., Wood M.J.A., Fuhrmann G. Extracellular vesicles as a next-generation drug delivery platform. Nat. Nanotechnol. 2021;16:748–759. - PubMed
    1. Mangeot P.E., Dollet S., Girard M., Ciancia C., Joly S., Peschanski M., Lotteau V. Protein Transfer Into Human Cells by VSV-G-induced Nanovesicles. Mol. Ther. 2011;19:1656–1666. - PMC - PubMed

LinkOut - more resources