Machine learning and deep learning to identifying subarachnoid haemorrhage macrophage-associated biomarkers by bulk and single-cell sequencing
- PMID: 38702954
- PMCID: PMC11069052
- DOI: 10.1111/jcmm.18296
Machine learning and deep learning to identifying subarachnoid haemorrhage macrophage-associated biomarkers by bulk and single-cell sequencing
Abstract
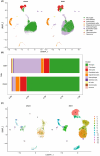
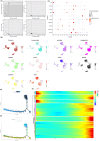
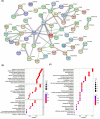
We investigated subarachnoid haemorrhage (SAH) macrophage subpopulations and identified relevant key genes for improving diagnostic and therapeutic strategies. SAH rat models were established, and brain tissue samples underwent single-cell transcriptome sequencing and bulk RNA-seq. Using single-cell data, distinct macrophage subpopulations, including a unique SAH subset, were identified. The hdWGCNA method revealed 160 key macrophage-related genes. Univariate analysis and lasso regression selected 10 genes for constructing a diagnostic model. Machine learning algorithms facilitated model development. Cellular infiltration was assessed using the MCPcounter algorithm, and a heatmap integrated cell abundance and gene expression. A 3 × 3 convolutional neural network created an additional diagnostic model, while molecular docking identified potential drugs. The diagnostic model based on the 10 selected genes achieved excellent performance, with an AUC of 1 in both training and validation datasets. The heatmap, combining cell abundance and gene expression, provided insights into SAH cellular composition. The convolutional neural network model exhibited a sensitivity and specificity of 1 in both datasets. Additionally, CD14, GPNMB, SPP1 and PRDX5 were specifically expressed in SAH-associated macrophages, highlighting its potential as a therapeutic target. Network pharmacology analysis identified some targeting drugs for SAH treatment. Our study characterised SAH macrophage subpopulations and identified key associated genes. We developed a robust diagnostic model and recognised CD14, GPNMB, SPP1 and PRDX5 as potential therapeutic targets. Further experiments and clinical investigations are needed to validate these findings and explore the clinical implications of targets in SAH treatment.
Keywords: deep learning; hdWGCNA; machine learning; single‐cell sequencing; subarachnoid haemorrhage rat model.
© 2024 The Authors. Journal of Cellular and Molecular Medicine published by Foundation for Cellular and Molecular Medicine and John Wiley & Sons Ltd.
Conflict of interest statement
The authors declare that the research was conducted in the absence of any commercial or financial relationships that could be construed as a potential conflict of interest.
Figures


Similar articles
-
Single-cell hdWGCNA reveals a novel diagnostic model and signature genes of macrophages associated with chronic obstructive pulmonary disease.Inflamm Res. 2025 Apr 17;74(1):66. doi: 10.1007/s00011-025-02025-4. Inflamm Res. 2025. PMID: 40244418
-
Identification of key genes and immune infiltration in peripheral blood biomarker analysis of delayed cerebral ischemia: Valproic acid as a potential therapeutic drug.Int Immunopharmacol. 2024 Aug 20;137:112408. doi: 10.1016/j.intimp.2024.112408. Epub 2024 Jun 18. Int Immunopharmacol. 2024. PMID: 38897129
-
Identification of pivotal genes and regulatory networks associated with SAH based on multi-omics analysis and machine learning.Sci Rep. 2025 Apr 24;15(1):14401. doi: 10.1038/s41598-025-98754-x. Sci Rep. 2025. PMID: 40274967 Free PMC article.
-
Single-cell hdWGCNA reveals metastatic protective macrophages and development of deep learning model in uveal melanoma.J Transl Med. 2024 Jul 29;22(1):695. doi: 10.1186/s12967-024-05421-2. J Transl Med. 2024. PMID: 39075441 Free PMC article.
-
Biases in machine-learning models of human single-cell data.Nat Cell Biol. 2025 Mar;27(3):384-392. doi: 10.1038/s41556-025-01619-8. Epub 2025 Feb 19. Nat Cell Biol. 2025. PMID: 39972066 Review.
Cited by
-
Advanced pathological subtype classification of thyroid cancer using efficientNetB0.Diagn Pathol. 2025 Mar 7;20(1):28. doi: 10.1186/s13000-025-01621-6. Diagn Pathol. 2025. PMID: 40055769 Free PMC article.
-
Single-cell RNA sequencing in stroke and traumatic brain injury: Current achievements, challenges, and future perspectives on transcriptomic profiling.J Cereb Blood Flow Metab. 2024 Dec 9:271678X241305914. doi: 10.1177/0271678X241305914. Online ahead of print. J Cereb Blood Flow Metab. 2024. PMID: 39648853 Free PMC article. Review.
References
Publication types
MeSH terms
Substances
Grants and funding
- GZSYQN202202/Guizhou Provincial People's Hospital Youth Fund
- GPPH-NSFC-2019-09/Guizhou Provincial People's Hospital National Science Foundation
- GPPH-NSFC-2019-18/Guizhou Provincial People's Hospital National Science Foundation
- GPPH-NSFC-D-2019-17/Guizhou Provincial People's Hospital National Science Foundation
- CSTB2023NSCQ-MSX0749/General Project of Chongqing Natural Science Foundation
- [2020]1Z066/Guizhou Provincial Science and Technology Projects
- [2018]03/Guizhou Provincial People's Hospital Doctor Foundation
- [2018]06/Guizhou Provincial People's Hospital Doctor Foundation
- 82260533/National Natural Science Foundation of China
- 82360376/National Natural Science Foundation of China
- 82360482/National Natural Science Foundation of China
LinkOut - more resources
Full Text Sources
Research Materials
Miscellaneous

