. 2024 May;45(7):e26684.
doi: 10.1002/hbm.26684.

Mapping brain function in adults and young children during naturalistic viewing with high-density diffuse optical tomography

Affiliations

Mapping brain function in adults and young children during naturalistic viewing with high-density diffuse optical tomography

Kalyan Tripathy et al. Hum Brain Mapp. 2024 May.

Abstract

Human studies of early brain development have been limited by extant neuroimaging methods. MRI scanners present logistical challenges for imaging young children, while alternative modalities like functional near-infrared spectroscopy have traditionally been limited by image quality due to sparse sampling. In addition, conventional tasks for brain mapping elicit low task engagement, high head motion, and considerable participant attrition in pediatric populations. As a result, typical and atypical developmental trajectories of processes such as language acquisition remain understudied during sensitive periods over the first years of life. We evaluate high-density diffuse optical tomography (HD-DOT) imaging combined with movie stimuli for high resolution optical neuroimaging in awake children ranging from 1 to 7 years of age. We built an HD-DOT system with design features geared towards enhancing both image quality and child comfort. Furthermore, we characterized a library of animated movie clips as a stimulus set for brain mapping and we optimized associated data analysis pipelines. Together, these tools could map cortical responses to movies and contained features such as speech in both adults and awake young children. This study lays the groundwork for future research to investigate response variability in larger pediatric samples and atypical trajectories of early brain development in clinical populations.

Keywords: brain development; feature regressor analysis; functional near‐infrared spectroscopy; movie viewing; optical neuroimaging.


Conflict of interest statement

The authors declare no conflicts of interest.

Figures
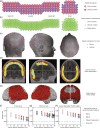
FIGURE 1
FIGURE 1
Preschooler HD‐DOT system: (a) A schematic of the optode array with 128 sources (red) and 125 detectors (blue). (b) A depiction of the high‐density measurements – each green line represents one of 2464 source‐detector pairs with <50 mm separation. (c) Source and detector positions on the head during a typical imaging session. (d) Tomographic slices of a flat field reconstruction thresholded at 10% of its maximum illustrate the depth of sensitivity. (e) Surface projection of a flat field reconstruction illustrates the cortical coverage typically achieved with the imaging cap, including parts of frontal, parietal, temporal, and occipital cortex. (f–h) Light fall‐off curves for data collected on an optical head phantom with various source encoding patterns. (f) Illumination with a 1% duty cycle allows for unsaturated nearest‐neighbor measurements but low light levels approaching the noise floor for long‐range measurements. (g) With a 50% duty cycle, light levels remain higher above the noise floor at longer distances but are frequently clipped at shorter distances. (h) A 2‐pass encoding pattern alternating between 1% and 50% duty cycles supports unclipped measurements for short‐range separations and measurements well above the noise floor for longer separations, maximizing dynamic range.
FIGURE 2
FIGURE 2
System validation with in vivo adult data: (a–d) Representative single subject data quality illustrations. (a) Light levels show a log‐linear fall‐off with increasing source‐detector separation. Optical power measurements are tightly clustered within 2 orders of magnitude at each possible distance and are above the noise floor across 5 degrees of source‐detector separation. (b) The cardiac pulse is clearly visible in measurement time traces. (c) Fourier spectra show a strong cardiac pulse peak at ~1 Hz. (d) High mean 0.5–2 Hz band‐limited signal‐to‐noise ratio (pulse SNR) is detectible across the cap. SNR tended to be higher across the posterior and lateral panels than the dorsal panel. (e–j) Group level oxyhemoglobin and deoxyhemoglobin maps from 5 adult participants illustrate image quality across the cap. OxyHb (e) and deoxyHb (h) contrast maps subtracting the response to right‐sided visual stimuli from the response to left‐sided visual stimuli illustrate robust contralateral visual cortex activations across 8 runs. OxyHb (f) and deoxyHb (i) contrast maps for left‐sided finger tapping minus right‐sided finger tapping show the contralateral motor cortex activity evoked during 9 runs of a motor task. Robust bilateral auditory cortex oxyHb (G) and deoxyHb (j) responses measured in response to 8 word‐hearing task runs. (k–m) Corresponding plots of oxy‐, deoxy‐, and total hemoglobin signals averaged across regions of activation in all participants.
FIGURE 3
FIGURE 3
Functional brain mapping using animated movies: Movie data from 3 highly sampled adults (80 movie‐viewing runs total): Illustrative time traces are plotted for a voxel of interest in the superior temporal gyrus ([−67.5, −27,12]) in an individual participant, while group maps are presented to show results across voxels, runs, and participants. (a) Movies evoked reproducible patterns of brain activity, plotted here for a single voxel during two viewings of the same clip, and mapped across the brain as the t‐statistics for voxel‐wise inter‐run signal correlations over time for all 40 pairs of movie‐viewing runs. (b) These responses are movie‐specific – comparing responses across 40 pairs of mismatched movie clips does not reveal the same inter‐run synchronization seen with matched clips. (c) A heterogeneous set of movies can be used to map responses to movie features such as speech through regressor correlation analysis. An exemplary speech regressor time course convolved with a canonical hemodynamic response function is plotted here alongside the oxyhemoglobin signal in a voxel of the brain that appears to be responsive to speech. The adjacent group speech regressor map highlights regions putatively involved in speech processing across the field of view. The t‐statistics plotted here are calculated from voxel‐wise correlations with speech regressors across 32 movie‐viewing runs using 8 different clips from the movies Moana and Finding Nemo. (d) A second group speech regressor map is shown here from a separate set of 34 movie‐viewing runs using an entirely separate set of eight movie clips from Curious George and Frozen. Speech regressors may have different time courses for different movies, but feature regressor analysis produces maps that are comparable nonetheless. (e) Activation maps from 22 runs of session‐matched, block‐design, word‐hearing task data are comparable to movie‐derived speech regressor maps.
FIGURE 4
FIGURE 4
Comparison of regressor maps across movies: (a) Correlation matrix comparing speech regressor maps from participants viewing clips of five different children's movies/shows as well as word‐hearing task activation maps. High correlations between independent viewings from the same movie (along the main diagonal), between different movies (off the main diagonal) except for Daniel Tiger's Neighborhood, and with the word‐hearing task (final row and column) illustrate the overall reproducibility, generalizability, and construct validity of speech regressor analysis. (b) Regressor correlations are weaker and noisier for some movies (particularly Daniel Tiger's Neighborhood) compared to others (e.g., Moana). (c) The construct validity of the speech regressor maps from a movie clip (measured as the spatial correlation between the mean speech regressor map and a session‐matched word‐hearing task activation map) is positively correlated with the mean inter‐run synchronization of measured brain activity between independent viewings of the movie clip. In this graph, each data point represents one pair of matched movie runs (i.e., the same participant viewing the same movie twice), and all 40 matched movie run pairs across all three adults are plotted. (d) A bar graph comparing the mean inter‐run synchronization of measured brain activity in our data from different movies. The show Daniel Tiger's Neighborhood was associated with lower mean inter‐run synchronization than other movies. (e) Modulation of speech over time is lower for clips of Daniel Tiger's Neighborhood than the other movies (e.g., Moana), as illustrated by exemplary regressor time courses and corresponding histograms of the regressor intensity distribution across time points (in arbitrary units, scaled relative to the norm of the distribution). (f) Quantifying and extending results from panel E, the kurtosis of the regressor intensity distribution is higher for clips from Daniel Tiger's Neighborhood than for the other movies. The reproducibility of speech maps decreases with increasing kurtosis of the underlying speech regressors.
FIGURE 5
FIGURE 5
Parallel feature regressor mapping: (a) Because movies are such rich stimuli, movie‐viewing data can be used to map responses to multiple features of interest present in a movie, e.g. both speech and faces. However, these features of interest may be more independent for some movies (e.g., Moana clip 3) and more correlated with one another for other clips (e.g., Finding Nemo clip 3). (b) Perhaps as a result, feature correlation maps for speech and faces display notable overlap (t‐maps shown for regressor correlations from 80 movie viewing runs). (c) When a participant was presented with just the audio (containing speech and no faces; 16 runs) or just the visuals (containing faces and no speech; 10 runs) of movies to remove confounds, speech and face regressor maps appeared more distinct and lateralized. (d) Distinct speech and face maps could be obtained from the audiovisual movie‐viewing data through multivariate regression (t‐maps shown for regressor correlations from 80 movie viewing runs). (e) Using univariate regression, the overlap between speech and face maps for a movie was strongly correlated with the similarity of the speech and face regressors for that movie. (f) Multivariate regression abolished the strong positive correlation between regressor map overlap and regressor similarity.
FIGURE 6
FIGURE 6
Functional brain mapping during movie viewing in young children using HD‐DOT: (a) N = 23 children ranging from 23 to 81 months of age were successfully imaged. (b) Eye tracking data showing a child attending to the stimulus display more when presented with movies than when asked to maintain visual fixation on a central crosshair. (c) High inter‐run synchronization is seen in responses to matched movie clips in the children across 56 movie‐viewing runs. (d) Evoked responses are movie‐specific, with low inter‐run synchronization across mismatched movie‐viewing runs. (e) Feature regressor analysis can be used to map receptive language from the HD‐DOT movie‐viewing data collected in awake young children. (f) Comparable responses are mapped across 17 block‐design word‐hearing task runs from children who complied with this task.

References

    1. Arichi, T. , Fagiolo, G. , Varela, M. , Melendez‐Calderon, A. , Allievi, A. , Merchant, N. , Tusor, N. , Counsell, S. J. , Burdet, E. , Beckmann, C. F. , & Edwards, A. D. (2012). Development of BOLD signal hemodynamic responses in the human brain. NeuroImage, 63(2), 663–673. 10.1016/j.neuroimage.2012.06.054 - DOI - PMC - PubMed
    1. Bartels, A. , & Zeki, S. (2004). Functional brain mapping during free viewing of natural scenes. Human Brain Mapping, 21(2), 75–85. 10.1002/hbm.10153 - DOI - PMC - PubMed
    1. Black, M. H. , Chen, N. T. M. , Iyer, K. K. , Lipp, O. V. , Bölte, S. , Falkmer, M. , Tan, T. , & Girdler, S. (2017). Mechanisms of facial emotion recognition in autism spectrum disorders: Insights from eye tracking and electroencephalography. Neuroscience and Biobehavioral Reviews, 80(December 2016), 488–515. 10.1016/j.neubiorev.2017.06.016 - DOI - PubMed
    1. Blasi, A. , Mercure, E. , Lloyd‐Fox, S. , Thomson, A. , Brammer, M. , Sauter, D. , Deeley, Q. , Barker, G. J. , Renvall, V. , Deoni, S. , Gasston, D. , Williams, S. C. R. , Johnson, M. H. , Simmons, A. , & Murphy, D. G. M. (2011). Early specialization for voice and emotion processing in the infant brain. Current Biology, 21(14), 1220–1224. 10.1016/j.cub.2011.06.009 - DOI - PubMed
    1. Boto, E. , Shah, V. , Hill, R. M. , Rhodes, N. , Osborne, J. , Doyle, C. , Holmes, N. , Rea, M. , Leggett, J. , Bowtell, R. , & Brookes, M. J. (2022). Triaxial detection of the neuromagnetic field using optically‐pumped magnetometry: Feasibility and application in children. NeuroImage, 252, 119027. 10.1016/j.neuroimage.2022.119027 - DOI - PMC - PubMed

Publication types