. 2024 Nov 25;120(14):1693-1712.
doi: 10.1093/cvr/cvae102.

miR-369-3p ameliorates diabetes-associated atherosclerosis by regulating macrophage succinate-GPR91 signalling

Affiliations

miR-369-3p ameliorates diabetes-associated atherosclerosis by regulating macrophage succinate-GPR91 signalling

Shruti Rawal et al. Cardiovasc Res. .

Abstract

Aims: Diabetes leads to dysregulated macrophage immunometabolism, contributing to accelerated atherosclerosis progression. Identifying critical factors to restore metabolic alterations and promote resolution of inflammation remains an unmet goal. MicroRNAs orchestrate multiple signalling events in macrophages, yet their therapeutic potential in diabetes-associated atherosclerosis remains unclear.

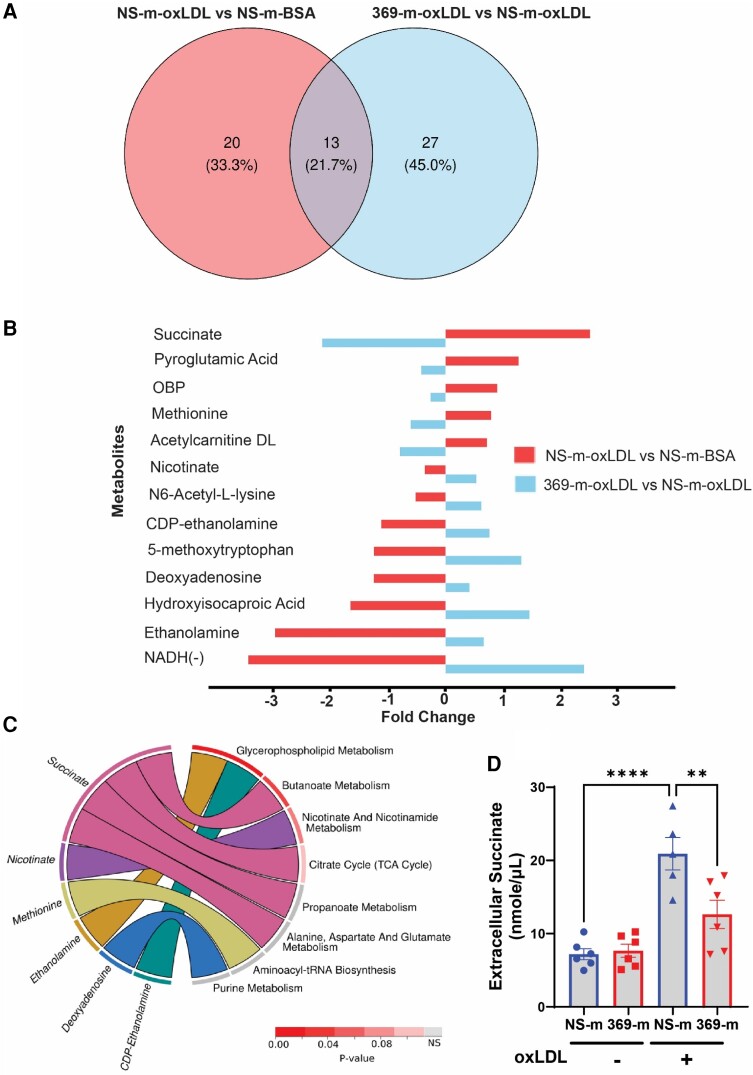
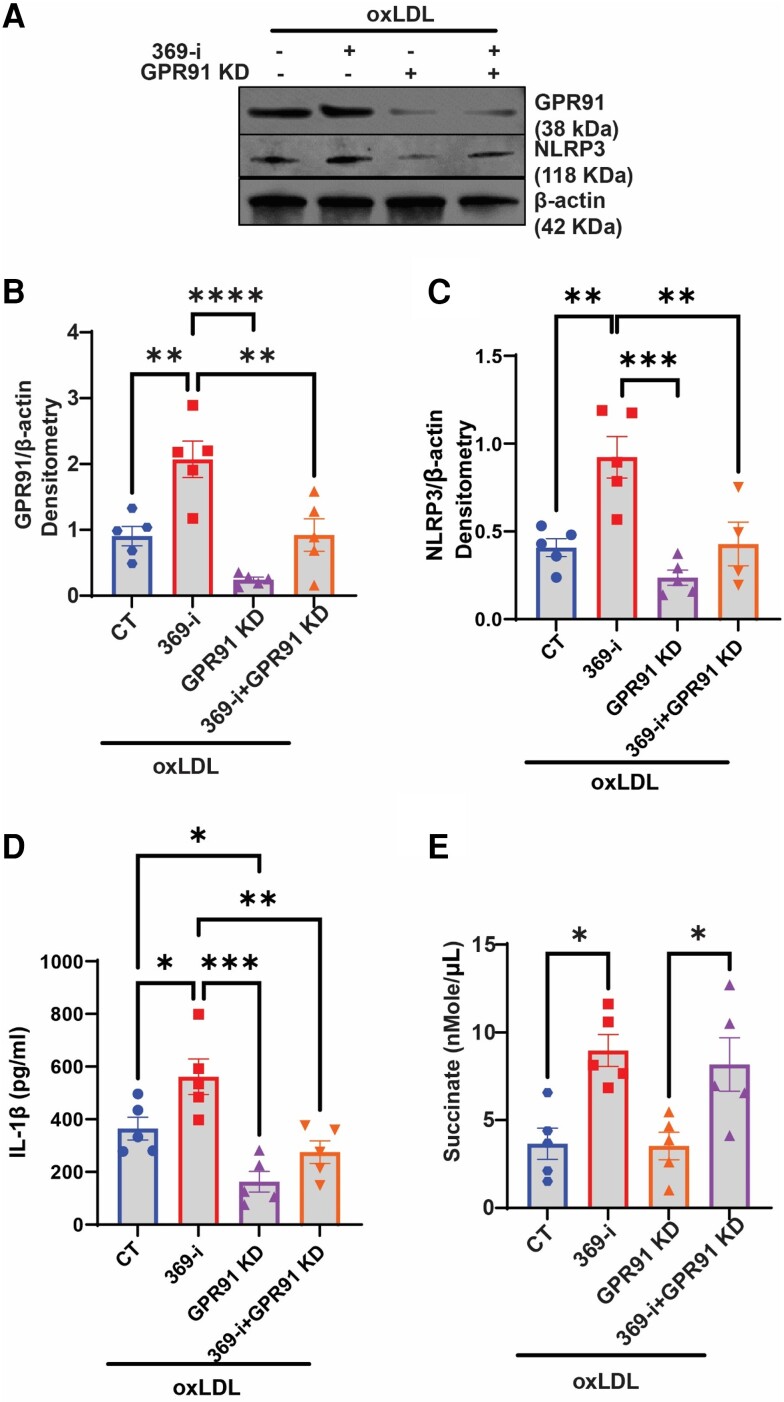
Methods and results: miRNA profiling revealed significantly lower miR-369-3p expression in aortic intimal lesions from Ldlr-/- mice on a high-fat sucrose-containing (HFSC) diet for 12 weeks. miR-369-3p was also reduced in peripheral blood mononuclear cells from diabetic patients with coronary artery disease (CAD). Cell-type expression profiling showed miR-369-3p enrichment in aortic macrophages. In vitro, oxLDL treatment reduced miR-369-3p expression in mouse bone marrow-derived macrophages (BMDMs). Metabolic profiling in BMDMs revealed that miR-369-3p overexpression blocked the oxidized low density lipoprotein (oxLDL)-mediated increase in the cellular metabolite succinate and reduced mitochondrial respiration (OXPHOS) and inflammation [Interleukin (lL)-1β, TNF-α, and IL-6]. Mechanistically, miR-369-3p targeted the succinate receptor (GPR91) and alleviated the oxLDL-induced activation of inflammasome signalling pathways. Therapeutic administration of miR-369-3p mimics in HFSC-fed Ldlr-/- mice reduced GPR91 expression in lesional macrophages and diabetes-accelerated atherosclerosis, evident by a decrease in plaque size and pro-inflammatory Ly6Chi monocytes. RNA-Seq analyses showed more pro-resolving pathways in plaque macrophages from miR-369-3p-treated mice, consistent with an increase in macrophage efferocytosis in lesions. Finally, a GPR91 antagonist attenuated oxLDL-induced inflammation in primary monocytes from human subjects with diabetes.

Conclusion: These findings establish a therapeutic role for miR-369-3p in halting diabetes-associated atherosclerosis by regulating GPR91 and macrophage succinate metabolism.

Keywords: Atherosclerosis; Diabetes; GPR91; Macrophage; Succinate; microRNA.


Conflict of interest statement

Conflict of interest: none declared.

Figures

Graphical Abstract
Graphical Abstract
Figure 1
Figure 1
Expression profiling of miR-369-3p expression. (A) miR-369-3p expression in aortic intima from Ldlr−/− mice on HFSC diet for 12 weeks (progression) or 0 week (chow-diet-fed control); n = 5 per group. (B) Cell-type profiling of miR-369-3p in FACS-sorted cells (aortic plaque macrophages, non-macrophages immune cells, and endothelial cells); MACs-sorted cells (aortic smooth muscle cells, aortic fibroblasts, primary bone marrow monocytes, and neutrophils); and PBMCs from Ldlr−/− mice on HFSC diet for 12 weeks (N = 7 mice per group). (C) miR-369-3p expression in human PBMCs (healthy controls, DM, CAD, or DM + CAD (N = 11–15 subjects/group). (D) miR-369-3p expression in BMDMs under the various indicated stimuli or basal control (N = 5 biological replicates per group). BMDMs were stimulated with Lipopolysaccharide (LPS) (50 ng/mL); oxLDL (50 μg/mL); palmitate (200 µM); IL-1β (10 ng/mL), or IL-4 (10 ng/mL). Unstimulated BMDMs (Basal) were used as control. Statistical analyses were performed using two-way ANOVA followed by Šídák’s test for multiple comparisons (A) or using one-way ANOVA followed by Holm-Šídák test for multiple comparisons (C and D). All data are mean ± SEM. Statistical differences are indicated as *P < 0.05; **P < 0.01, ***P < 0.001, and ****P < 0.001 vs. control.
Figure 2
Figure 2
miR-369-3p overexpression in BMDMs reduces oxLDL-mediated mitochondrial stress pro-inflammatory mediators. BMDMs were transfected with NS-m control or miR-369-3p (369-m) mimic (30 nM) for 48 h, after which the cells were serum-starved overnight and oxLDL was loaded for 24 h. (A–D) Seahorse analysis of cellular (A and B) OCR, basal respiration, maximum respiration, and spare respiratory capacity, (C and D) ECAR, glycolysis, glycolytic capacity, and glycolytic reserve. Data are normalized to total protein content and expressed as mean ± SEM (N = 4 biological replicates per group). (E and F) Western blotting was performed on total cell lysates to determine the levels of OXPHOS complex (N = 3 biological replicates per group). Statistical analysis was performed using one-way ANOVA followed by Holm-Šídák test for multiple comparisons. All data are mean ± SEM. Statistical differences are indicated as *P < 0.05; **P < 0.01; ***P < 0.001; and ****P < 0.0001 vs. NS-m control.
Figure 3
Figure 3
Effect of miR-369-3p overexpression alters global extracellular metabolic profile in oxLDL-treated BMDMs. (A) Venn diagram displaying altered metabolites between NS-m-oxLDL vs. NS-m-BSA and 369-m-oxLDL vs. NS-m-oxLDL (N = 3 biological replicates per group). (B) Bar plot showing 13 common altered metabolites between NS-m-oxLDL vs. NS-m-BSA and 369-m-oxLDL vs. NS-m-oxLDL. (C) Chordplot for metabolic pathways associated with altered metabolites that are inversely regulated between (NS-m-oxLDL vs. NS-m-BSA) and (369-m-oxLDL vs. NS-m-oxLDL) using the KEGG database and metaboanalyst tool (v5). P-values were generated by metaboanalyst tool based on the number of metabolites associated per pathway (D) Validation of extracellular succinate levels by colorimetric assay in oxLDL-treated BMDMs with or without miR-369-3p overexpression. Statistical analysis was performed using one-way ANOVA followed by Holm-Šídák test for multiple comparisons. All data are mean ± SEM. Statistical differences are indicated as **P < 0.01 and ****P < 0.0001 vs. NS-m control.
Figure 4
Figure 4
miR-369-3p regulates GPR91-mediated inflammasome activation and mitochondrial dysfunction markers in oxLDL-loaded macrophages. (A–G) BMDMs were transfected with NS-m control or miR-369-3p (369-m) mimic (30 nM) for 48 h, after which the cells were serum-starved overnight and oxLDL was loaded for 24 h. Whole cell lysate was prepared, and western blotting was performed. Representative blots (A) and quantification of western blots for GPR91 (B), NLRP3 (C), phosphor-ERK1/2 (D), phospho-DRP1 (E), cleaved IL-1β (F), and cleaved caspase 1 (G) using ImageJ software (N = 5 biological replicates per group). Statistical analysis was performed using one-way ANOVA followed by Holm-Šídák test for multiple comparisons. All data are mean ± SEM. Statistical differences are indicated as *P < 0.05; **P < 0.01; ***P < 0.001; and ****P < 0.0001 vs. NS-m control.
Figure 5
Figure 5
oxLDL-mediated inflammation is exacerbated by miR-369-3p inhibition and is partially dependent on GPR91 in macrophages. BMDMs were transfected with NS inhibitor/siRNA control (CT) or miR-369-3p inhibitor (369-i), or GPR91 siRNA (GPR91 KD) or co-transfected with both 369-i and GPR91 KD for 72 h, after which the cells were serum-starved overnight and oxLDL was loaded for 24 h. Whole cell lysate was prepared, and western blotting was performed. Representative blots (A) and quantification of western blots for GPR91 (B) and NLRP3 (C) are shown. ELISA was performed on cell supernatants to detect IL-1β (D). Extracellular succinate levels were measured by colorimetric assay (E). N = 5 biological replicates per group for all experiments. Statistical analysis was performed using one-way ANOVA followed by Holm-Šídák test for multiple comparisons. All data are mean ± SEM. Statistical differences are indicated as *P < 0.05; **P < 0.01; ***P < 0.001; and ****P < 0.0001 vs. NS-m control.
Figure 6
Figure 6
In vivo miR-369-3p overexpression halts diabetes-associated atherosclerosis progression (A) experimental outline: diabetes-associated atherosclerosis was established in Ldlr−/− mice by feeding a HFSC diet for 8 weeks after which mice were treated with NS-m control or miR-369-3p mimic (369-m) for 4 weeks on HFSC. (B) Cells were FACS-sorted directly into Trizol LS for lysis and total RNA was isolated to assess miR-369-3p expression using RT-qPCR analyses (N = 5/group). (C–E) Representative images (C) and quantification of aortic sinus lesion size (D) and lipid content (E) using ORO staining (N = 16 mice per group) are shown. Scale bar = 200 μm. (F–I) GPR91 expression was quantified as MFI in circulating monocytes (F and G) and aortic arch macrophages (H and I) using flow cytometry analyses (N = 8–9 mice per group). All data are mean ± SEM. Statistical analysis was performed using unpaired Student’s t-test and statistical differences were indicated as *P < 0.05; **P < 0.01; and ***P < 0.001 vs. NS-m control.
Figure 7
Figure 7
Therapeutic delivery of miR-369-3p reduced the expression of NLRP3 inflammasome in plaque macrophages and is associated with accumulation of alternatively active macrophages M2-like macrophages in the aortic plaques. (A) Shown are representative images and (B) quantification of CD68+ macrophages and (C) NLRP3+CD68+ macrophage staining in the aortic lesions of Ldlr−/− mice treated with miR-369-3p mimic (369-m) or NS-m control (N = 8 per group; scale bar = 50 µm). (D and E) Flow cytometric analyses of % M1 (B) and % M2 (C) subsets of CD11b + F4/80 + infiltrated macrophages (N = 8–9 mice per group). (F–H) Flow cytometric analyses of pro-inflammatory M1 markers, CCR2 (F), CD86 (G) and anti-inflammatory M2 marker, Arg1 (H). All data are mean ± SEM. Statistical analysis was performed using unpaired Student’s t-test and statistical differences were indicated as *P < 0.05; **P < 0.01; and ***P < 0.001 vs. NS-m control.
Figure 8
Figure 8
GPR91 is up-regulated in PBMCs from patients with diabetes and CAD and by oxLDL in primary human monocytes. (A) RT-qPCR analysis of SUCNR1/GPR91 expression in human PBMCs (healthy controls, DM, CAD, or DM + CAD (n = 11–15/group). (B and C) Primary human monocytes were serum-starved overnight and oxLDL was loaded for 24 h. RNA was isolated, and RT-qPCR was performed to determine miRNA-369-3p (B) and GPR91 (C) expression. (D) ELISA was performed on cell supernatants to detect IL-1β secretion. (E and F) Primary monocytes from human subjects without (E) or with diabetes (F) were either untreated or pre-treated with human-specific GPR91 inhibitor, NF-56-EJ40 for 1 h, followed by oxLDL-loading for 24 h and ELISA was performed on cell supernatants to detect IL-1β (N = 5 biological replicates per group). Statistical analysis was performed using unpaired Student’s t-test (B–D) or using one-way ANOVA followed by Holm-Šídák test for multiple comparisons (A and E). All data are mean ± SEM. Statistical differences are indicated as *P < 0.05; **P < 0.01; ***P < 0.001; and ****P < 0.0001 vs. NS-m control.

References

    1. Haffner SM. Diabetes, hyperlipidemia, and coronary artery disease. Am J Cardiol 1999;83:17F–21F. - PubMed
    1. Haffner SM. Epidemiology of insulin resistance and its relation to coronary artery disease. Am J Cardiol 1999;84:11J–14J. - PubMed
    1. Armitage J, Bowman L. Cardiovascular outcomes among participants with diabetes in the recent large statin trials. Curr Opin Lipidol 2004;15:439–446. - PubMed
    1. Evans JL, Goldfine ID, Maddux BA, Grodsky GM. Oxidative stress and stress-activated signaling pathways: a unifying hypothesis of type 2 diabetes. Endocr Rev 2002;23:599–622. - PubMed
    1. Lamharzi N, Renard CB, Kramer F, Pennathur S, Heinecke JW, Chait A, Bornfeldt KE. Hyperlipidemia in concert with hyperglycemia stimulates the proliferation of macrophages in atherosclerotic lesions: potential role of glucose-oxidized LDL. Diabetes 2004;53:3217–3225. - PubMed

Publication types

MeSH terms

Associated data