

Racial and Ethnic Disparities in All-Cause and Cause-Specific Mortality Among US Youth
- PMID: 38703403
- PMCID: PMC11070063
- DOI: 10.1001/jama.2024.3908
Racial and Ethnic Disparities in All-Cause and Cause-Specific Mortality Among US Youth
Abstract
Importance: Mortality rates in US youth have increased in recent years. An understanding of the role of racial and ethnic disparities in these increases is lacking.
Objective: To compare all-cause and cause-specific mortality trends and rates among youth with Hispanic ethnicity and non-Hispanic American Indian or Alaska Native, Asian or Pacific Islander, Black, and White race.
Design, setting, and participants: This cross-sectional study conducted temporal analysis (1999-2020) and comparison of aggregate mortality rates (2016-2020) for youth aged 1 to 19 years using US Centers for Disease Control and Prevention Wide-Ranging Online Data for Epidemiologic Research database. Data were analyzed from June 30, 2023, to January 17, 2024.
Main outcomes and measures: Pooled, all-cause, and cause-specific mortality rates per 100 000 youth (hereinafter, per 100 000) for leading underlying causes of death were compared. Injuries were classified by mechanism and intent.
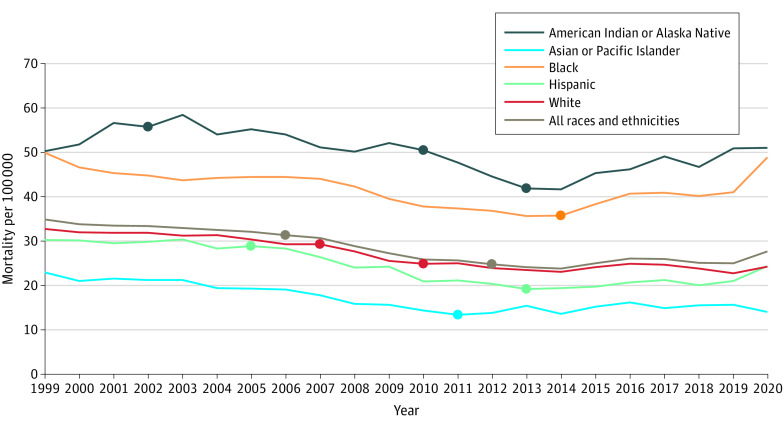
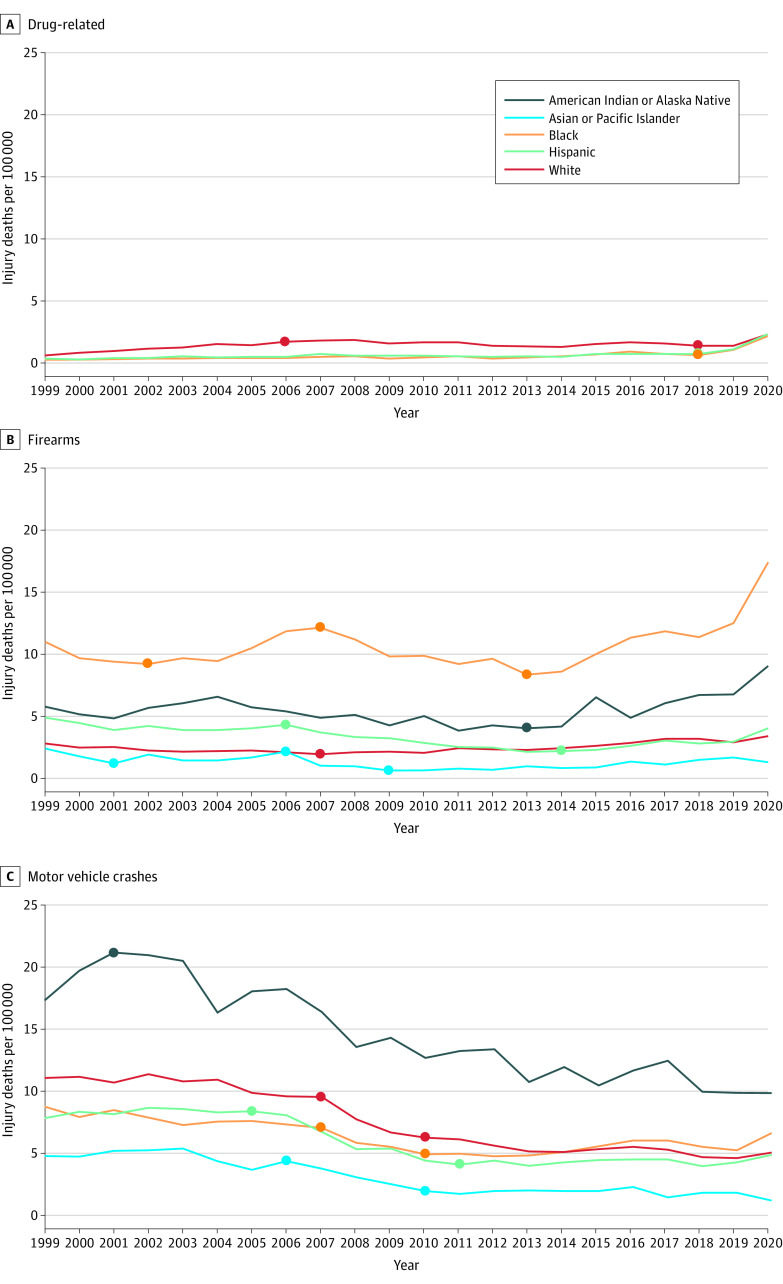
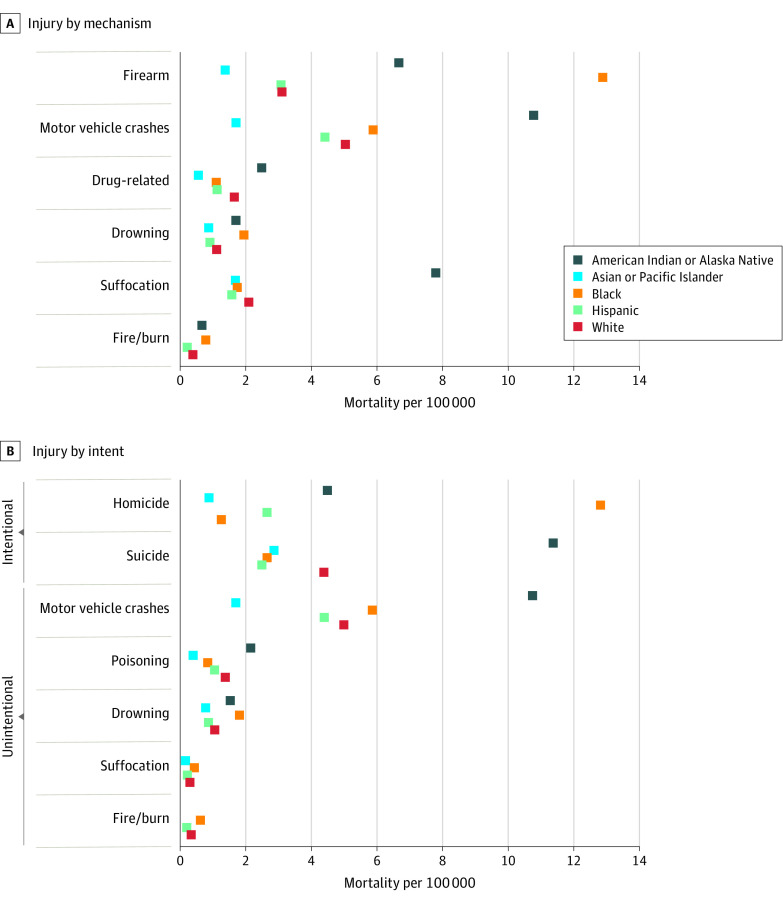
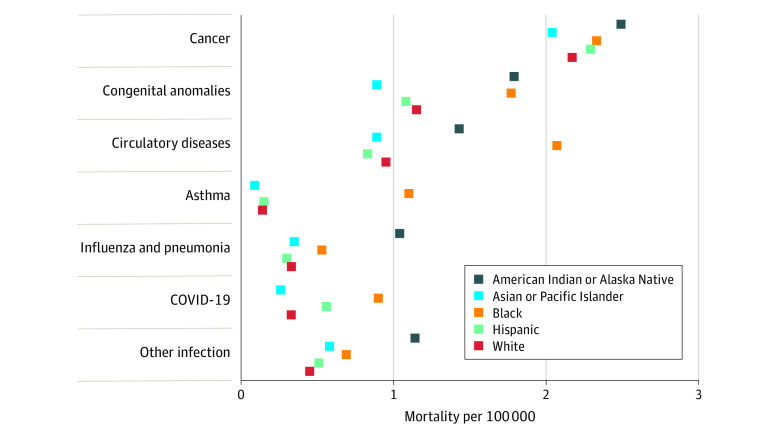
Results: Between 1999 and 2020, there were 491 680 deaths among US youth, including 8894 (1.8%) American Indian or Alaska Native, 14 507 (3.0%) Asian or Pacific Islander, 110 154 (22.4%) Black, 89 251 (18.2%) Hispanic, and 267 452 (54.4%) White youth. Between 2016 and 2020, pooled all-cause mortality rates were 48.79 per 100 000 (95% CI, 46.58-51.00) in American Indian or Alaska Native youth, 15.25 per 100 000 (95% CI, 14.75-15.76) in Asian or Pacific Islander youth, 42.33 per 100 000 (95% CI, 41.81-42.86) in Black youth, 21.48 per 100 000 (95% CI, 21.19-21.77) in Hispanic youth, and 24.07 per 100 000 (95% CI, 23.86-24.28) in White youth. All-cause mortality ratios compared with White youth were 2.03 (95% CI, 1.93-2.12) among American Indian or Alaska Native youth, 0.63 (95% CI, 0.61-0.66) among Asian or Pacific Islander youth, 1.76 (95% CI, 1.73-1.79) among Black youth, and 0.89 (95% CI, 0.88-0.91) among Hispanic youth. From 2016 to 2020, the homicide rate in Black youth was 12.81 (95% CI, 12.52-13.10) per 100 000, which was 10.20 (95% CI, 9.75-10.66) times that of White youth. The suicide rate for American Indian or Alaska Native youth was 11.37 (95% CI, 10.30-12.43) per 100 000, which was 2.60 (95% CI, 2.35-2.86) times that of White youth. The firearm mortality rate for Black youth was 12.88 (95% CI, 12.59-13.17) per 100 000, which was 4.14 (95% CI, 4.00-4.28) times that of White youth. American Indian or Alaska Native youth had a firearm mortality rate of 6.67 (95% CI, 5.85-7.49) per 100 000, which was 2.14 (95% CI, 1.88- 2.43) times that of White youth. Black youth had an asthma mortality rate of 1.10 (95% CI, 1.01-1.18) per 100 000, which was 7.80 (95% CI, 6.78-8.99) times that of White youth.
Conclusions and relevance: In this study, racial and ethnic disparities were observed for almost all leading causes of injury and disease that were associated with recent increases in youth mortality rates. Addressing the increasing disparities affecting American Indian or Alaska Native and Black youth will require efforts to prevent homicide and suicide, especially those events involving firearms.
Conflict of interest statement
Figures
Comment in
-
Injury Prevention Science and Firearm Injury in Pediatric Health.JAMA. 2024 May 28;331(20):1712-1713. doi: 10.1001/jama.2024.4208. JAMA. 2024. PMID: 38703402 No abstract available.
-
Race Disaggregation and Racial and Ethnic Disparities in US Youth Mortality.JAMA. 2024 Oct 1;332(13):1110. doi: 10.1001/jama.2024.15133. JAMA. 2024. PMID: 39230887 No abstract available.
References
-
- CDC WONDER database. Underlying Cause of Death. Centers for Disease Control and Prevention. Accessed July 6, 2023. https://wonder.cdc.gov
