. 2024 May 21;5(5):101548.
doi: 10.1016/j.xcrm.2024.101548. Epub 2024 May 3.

Metabolic liability for weight gain in early adulthood

Affiliations

Metabolic liability for weight gain in early adulthood

Venkatesh L Murthy et al. Cell Rep Med. .

Abstract

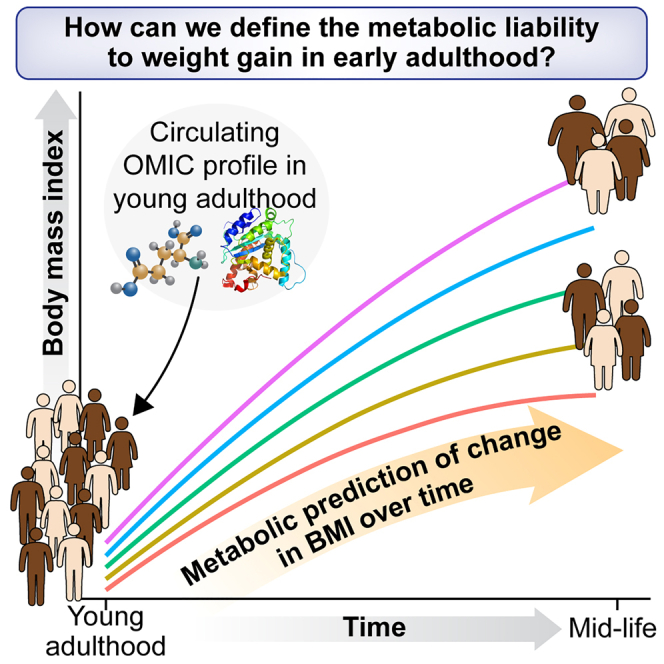
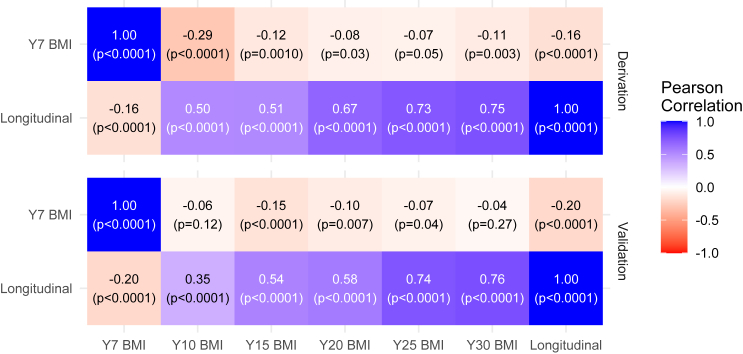
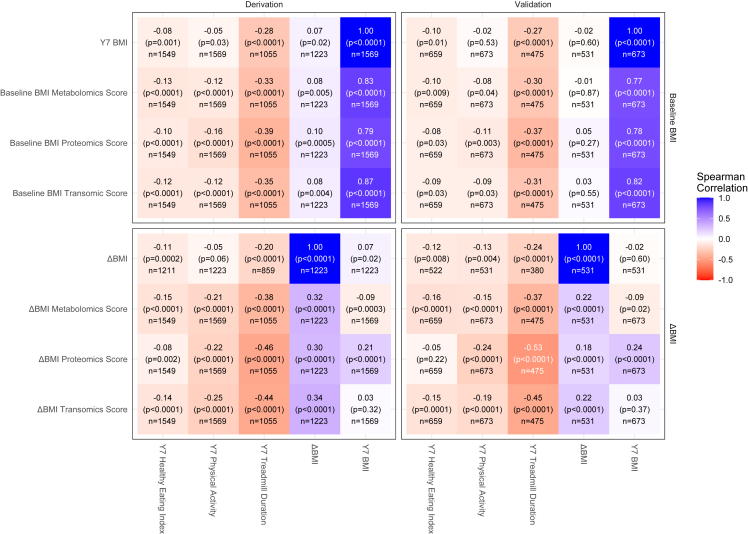
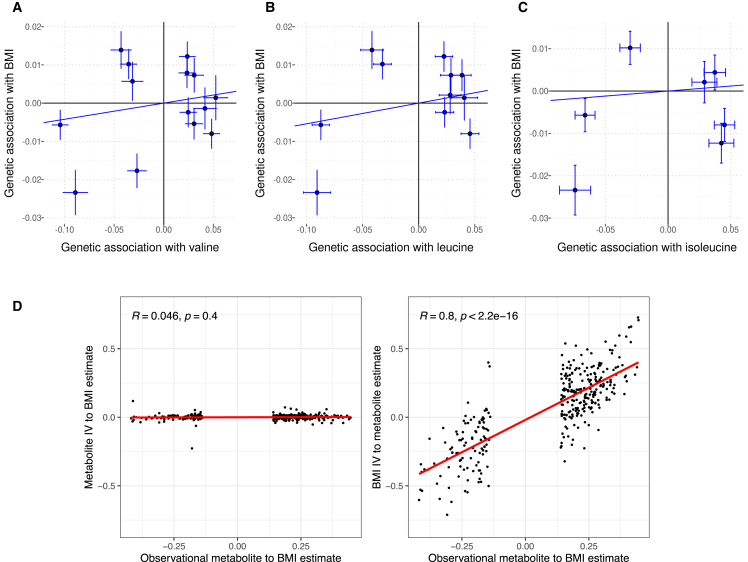
While weight gain is associated with a host of chronic illnesses, efforts in obesity have relied on single "snapshots" of body mass index (BMI) to guide genetic and molecular discovery. Here, we study >2,000 young adults with metabolomics and proteomics to identify a metabolic liability to weight gain in early adulthood. Using longitudinal regression and penalized regression, we identify a metabolic signature for weight liability, associated with a 2.6% (2.0%-3.2%, p = 7.5 × 10⁻¹⁹) gain in BMI over ≈20 years per SD higher score, after comprehensive adjustment. Identified molecules specified mechanisms of weight gain, including hunger and appetite regulation, energy expenditure, gut microbial metabolism, and host interaction with external exposure. Integration of longitudinal and concurrent measures in regression with Mendelian randomization highlights the complexity of metabolic regulation of weight gain, suggesting caution in interpretation of epidemiologic or genetic effect estimates traditionally used in metabolic research.

Keywords: branched chain amino acids; metabolism; obesity; weight regulation.


Conflict of interest statement

Declaration of interests V.L.M. owns stock or stock options in General Electric, Cardinal Health, Ionetix, Boston Scientific, Merck, Eli Lilly, Johnson and Johnson, and Pfizer. He has received research grants and consulting fees from Siemens Medical Imaging. He has served on medical advisory boards for Ionetix. R.V.S. has served as a consultant in the past for Amgen. R.V.S. is a co-inventor on a patent for ex-RNA signatures of cardiac remodeling. J.T.W. receives consulting fees from 3M.

Figures

None
Graphical abstract
Figure 1
Figure 1
BMI over time in CARDIA BMI at year 7 (initial study visit for this analysis) and year 30 in CARDIA demonstrate variability in propensity for weight gain over 2 decades. Color scale indicates the number of nearest neighbors to account for overplotting. (A) Scatterplot of BMI at year 7 and year 30. Points are colored by density of nearby points to account for overplotting. The dashed line indicates unity. (B) Scatterplot of year 7 BMI and change in BMI (ΔBMI) from year 7 to year 30. Although year 7 and year 30 BMI are strongly correlated, year 7 BMI is not strongly predictive of a change in BMI over the ensuing ≈2 decades. Sample sizes are indicated in the plot.
Figure 2
Figure 2
Divergent molecular associations between concurrent BMI and its longitudinal trajectory Shown is the inter-relation of regression coefficients for all molecular species for cross-sectional (concurrent, year 7) BMI and BMI trajectory (longitudinal). These regression coefficients derive from models adjusted for age, sex, race, and year 7 BMI (except when year 7 BMI is the outcome). Each cell represents the Pearson correlation between the regression coefficients for all species in the row, with each column representing the dependent variable. For example, the cell for row “Year 7 BMI” and column “Year 10 BMI” represents the correlation of the regression coefficients for molecular species from a model for “Year 7 BMI = species” versus a model for “Year 10 BMI = species” (plus adjustments). Color indicates the magnitude and direction of the Pearson correlation, which is noted in text with its corresponding p value in each cell. In general, regression estimates for molecular species against year 7 BMI (cross-sectional associations) were generally not well correlated with those for subsequent years, suggesting that metabolites and proteins related to concurrent/cross-sectional BMI (at year 7) do not display the same relation to later BMI. This is consistent across both our derivation and validation samples. Plots are for 746 features.
Figure 3
Figure 3
Discordant metabolic pathways of weight gain in CARDIA This figure visualizes regression results from cross-sectional and longitudinal models for BMI for species selected based on false discovery rate (FDR) ≤0.05 for association with either cross-sectional or longitudinal BMI in the derivation cohort (age/sex/race/baseline BMI adjusted). The outermost tracks specify the pathway (Figure S2) and platform (metabolite or protein, including the designation for metabolite or protein platform, “hydrophilic interaction liquid chromatography (HILIC)-positive,” “HILIC-negative,” “C8-positive,” and “C18-negative;” based on column and spectrometry; or “CVD-2” and “CVD-3” for the protein panel). The next layer of bar plots represents scaled regression coefficients for cross-sectional (outer) and longitudinal (inner) models in the derivation cohort. The inner tracks denote significance in these models and across the derivation and/or validation cohort (FDR ≤0.05). Lines in the center connect identical species across pathways.
Figure 4
Figure 4
Trans-omic molecular profile of weight gain liability predicts weight gain over ≈2 decades (A) Model-estimated marginal means for BMI from longitudinal models of BMI adjusted for age (at year 7), sex, race, income, education, smoking, physical activity, and year 7 BMI with time, time squared, score by time, and score terms. The score-by-time interaction was statistically significant, indicating that the trans-omic score in early adulthood is associated with increasingly divergent BMI over time (higher scores = larger gains in BMI). (B) Distribution of trans-omic scores (density plot) and actual (not model-estimated) changes in BMI (points, representing actual change in BMI across 25-quantiles of the scores). Sample size is indicated in the plot.
Figure 5
Figure 5
Correlation of baseline and change in BMI molecular scores with diet, activity, and fitness in early adulthood Trans-omic BMI change score (final row) is associated most strongly with objectively measured fitness (and less with activity and healthy dietary pattern), consistent across derivation and validation samples. Color scale indicates the magnitude and direction of the Spearman correlation, which is noted in text with its corresponding sample size and p value in each cell.
Figure 6
Figure 6
MR studies implicate a complex underlying pathophysiology of metabolism and BMI (A–C) Summary of IVW associations between each amino acid and BMI in GIANT. Each point represents a SNP instrument, and the fitted line represents the estimated slope by the IVW method. (D) Results from an analysis of a recent bidirectional MR study, representing strong relation between effect estimates of cross-sectional BMI to metabolite relation (x axis) with the BMI genetic IV to metabolite relation but not the metabolite genetic IV to BMI. Pearson correlation and its corresponding p value are displayed, and the red line represents a linear fit. The blank area in the middle of each plot is due to a report of significant metabolites in the primary data.

References

    1. Khera A.V., Chaffin M., Wade K.H., Zahid S., Brancale J., Xia R., Distefano M., Senol-Cosar O., Haas M.E., Bick A., et al. Polygenic Prediction of Weight and Obesity Trajectories from Birth to Adulthood. Cell. 2019;177:587–596.e9. - PMC - PubMed
    1. Narath S.H., Mautner S.I., Svehlikova E., Schultes B., Pieber T.R., Sinner F.M., Gander E., Libiseller G., Schimek M.G., Sourij H., Magnes C. An Untargeted Metabolomics Approach to Characterize Short-Term and Long-Term Metabolic Changes after Bariatric Surgery. PLoS One. 2016;11 - PMC - PubMed
    1. Sohn M.J., Chae W., Ko J.S., Cho J.Y., Kim J.E., Choi J.Y., Jang H.B., Lee H.J., Park S.I., Park K.H., et al. Metabolomic Signatures for the Effects of Weight Loss Interventions on Severe Obesity in Children and Adolescents. Metabolites. 2021;12 - PMC - PubMed
    1. Small D.M. Individual differences in the neurophysiology of reward and the obesity epidemic. Int. J. Obes. 2009;33:S44–S48. - PMC - PubMed
    1. Martins C., Gower B.A., Hunter G.R. Metabolic adaptation delays time to reach weight loss goals. Obesity. 2022;30:400–406. - PMC - PubMed