. 2024 May 21;5(5):101547.
doi: 10.1016/j.xcrm.2024.101547. Epub 2024 May 3.

Comprehensive proteogenomic characterization of rare kidney tumors

Collaborators, Affiliations

Comprehensive proteogenomic characterization of rare kidney tumors

Ginny Xiaohe Li et al. Cell Rep Med. .

Abstract

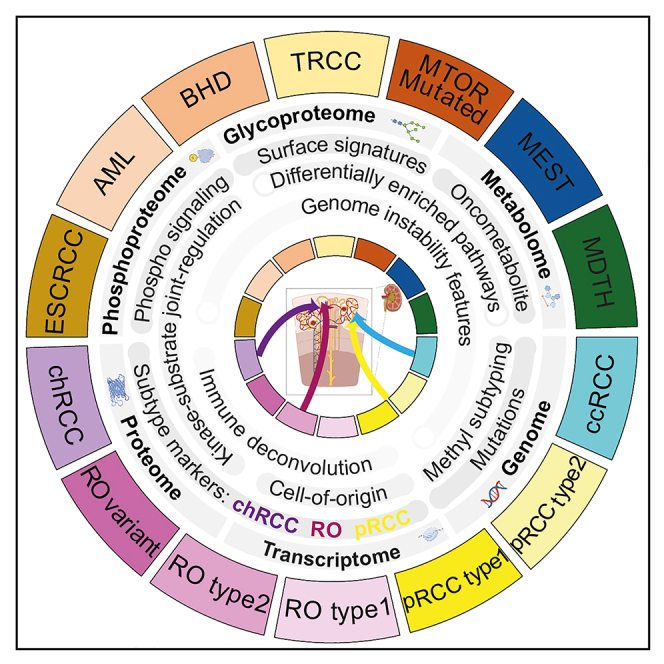
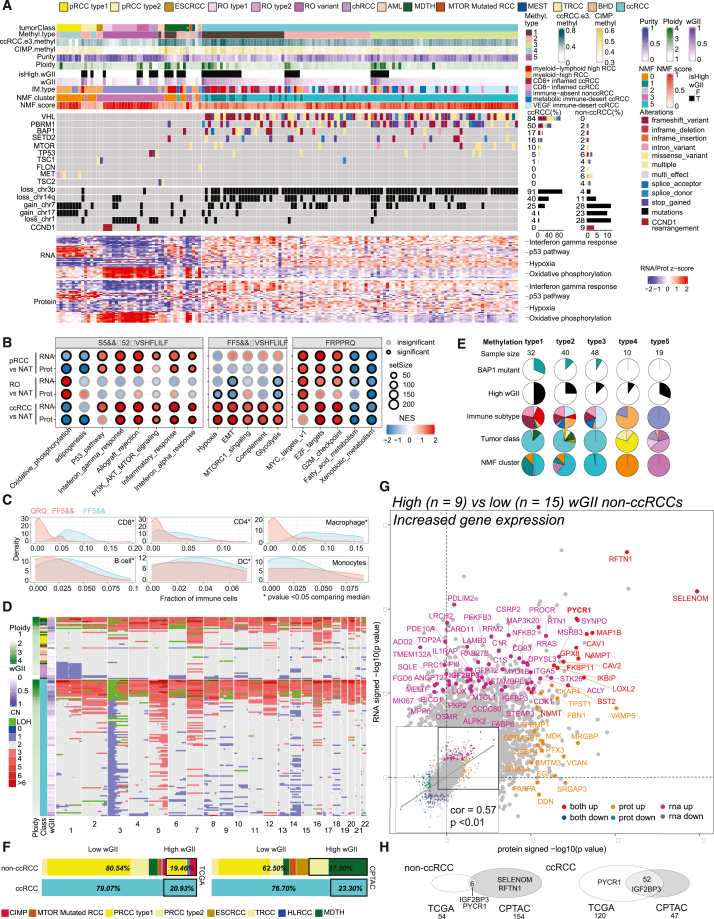
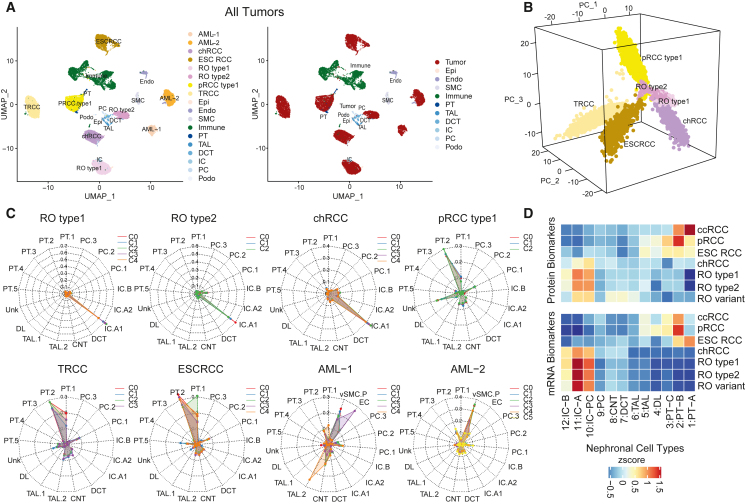
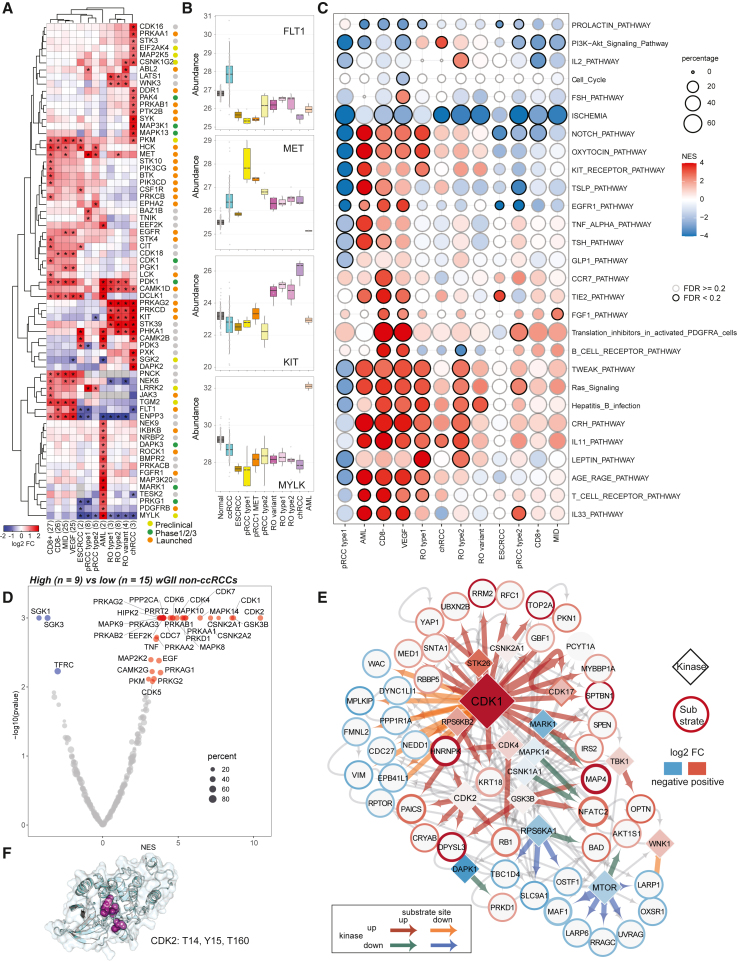
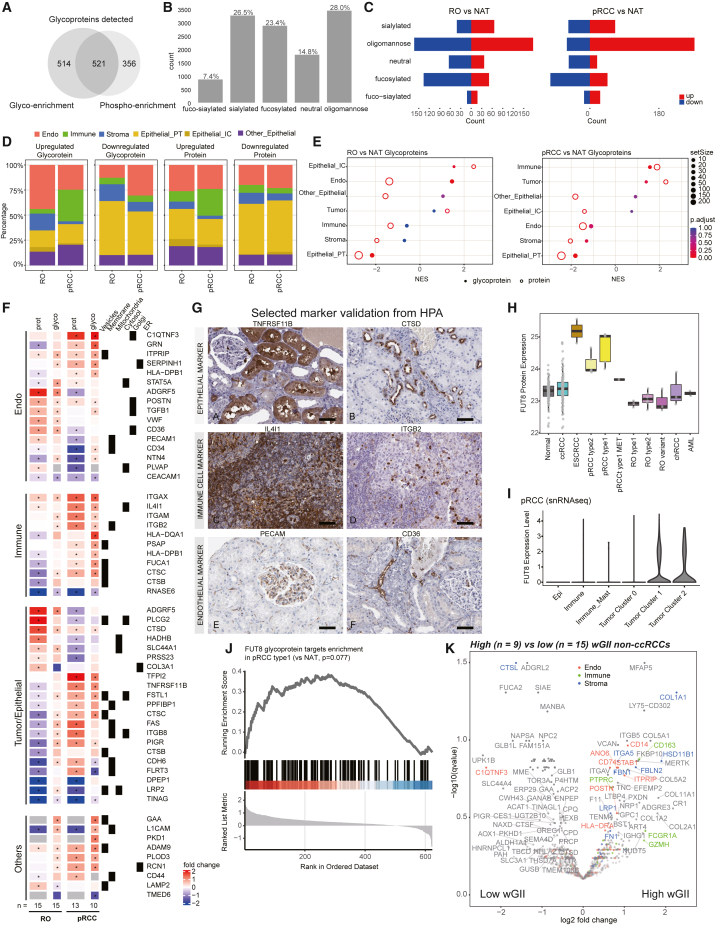
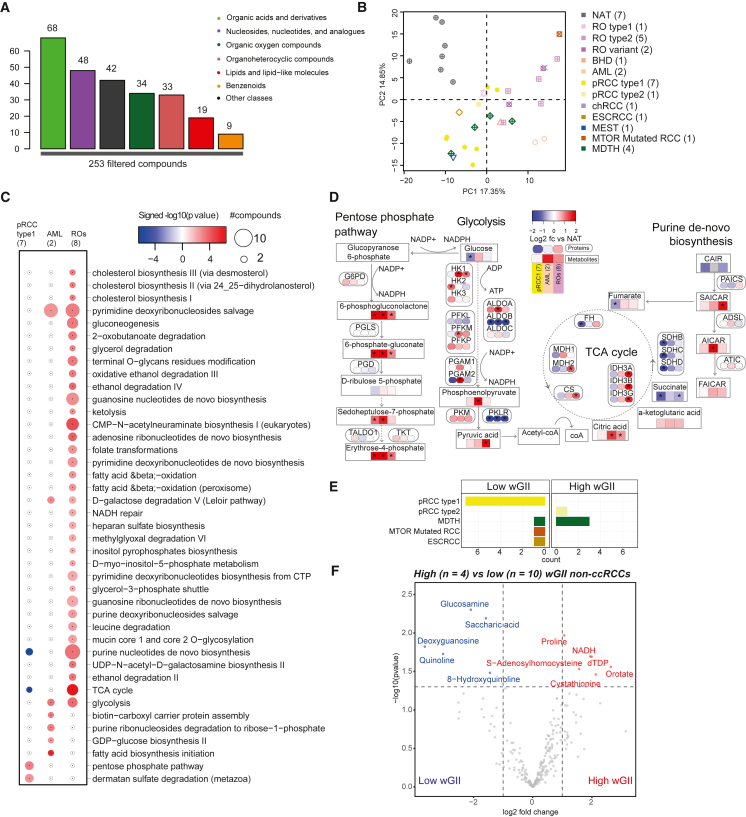
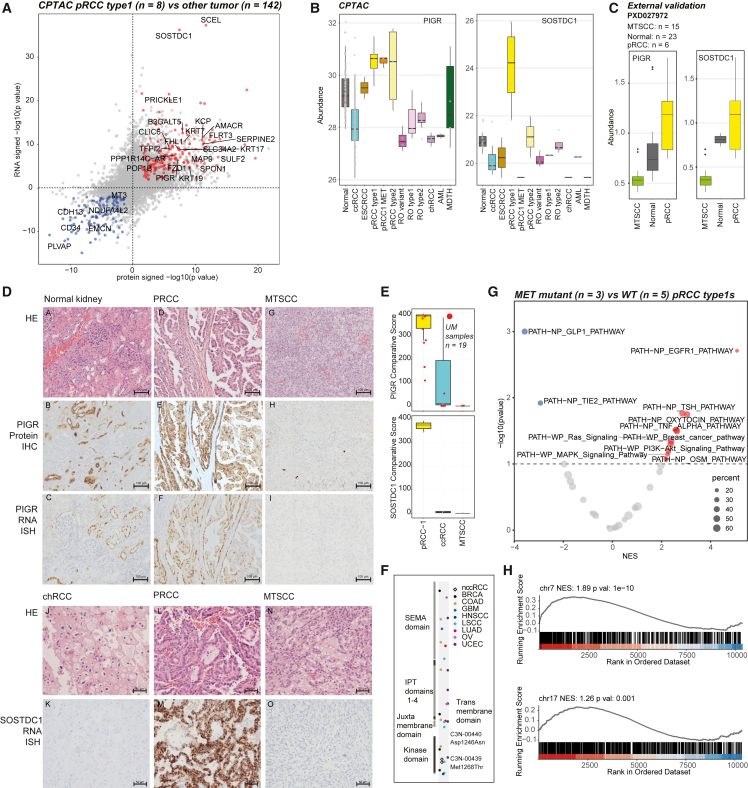
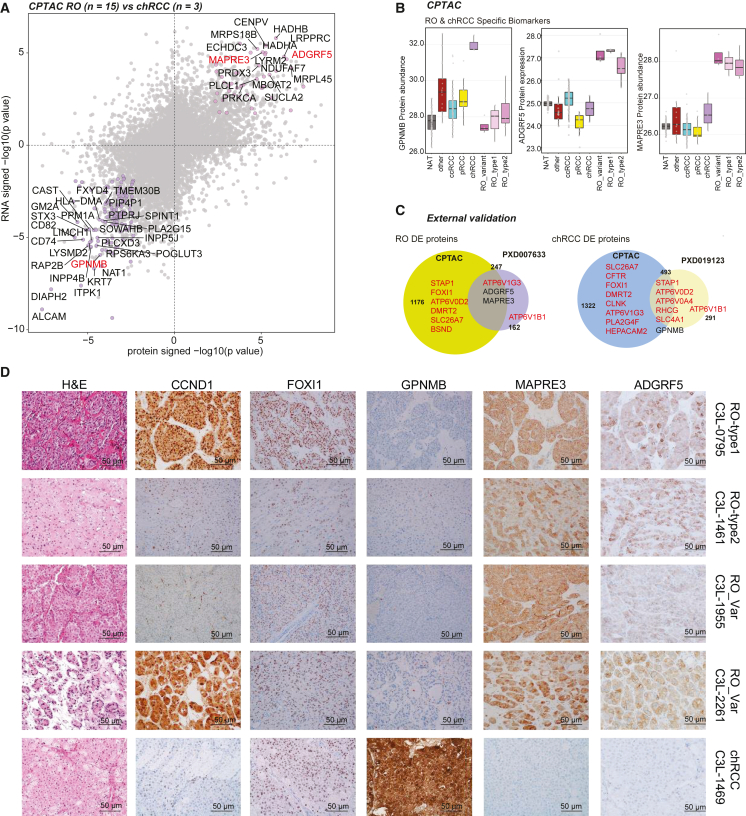
Non-clear cell renal cell carcinomas (non-ccRCCs) encompass diverse malignant and benign tumors. Refinement of differential diagnosis biomarkers, markers for early prognosis of aggressive disease, and therapeutic targets to complement immunotherapy are current clinical needs. Multi-omics analyses of 48 non-ccRCCs compared with 103 ccRCCs reveal proteogenomic, phosphorylation, glycosylation, and metabolic aberrations in RCC subtypes. RCCs with high genome instability display overexpression of IGF2BP3 and PYCR1. Integration of single-cell and bulk transcriptome data predicts diverse cell-of-origin and clarifies RCC subtype-specific proteogenomic signatures. Expression of biomarkers MAPRE3, ADGRF5, and GPNMB differentiates renal oncocytoma from chromophobe RCC, and PIGR and SOSTDC1 distinguish papillary RCC from MTSCC. This study expands our knowledge of proteogenomic signatures, biomarkers, and potential therapeutic targets in non-ccRCC.

Keywords: CPTAC; cell-of-origin; differential diagnosis biomarkers; glycoproteomics; metabolomics; non-clear cell renal cell carcinoma; phosphoproteomics; prognostic marker; proteogenomics; weighted genome instability index.


Conflict of interest statement

Declaration of interests A.I.N., F.Y., and D.A.P. receive royalties from the University of Michigan for the sale of MSFragger software licences to commercial entities. All licence transactions are managed by the University of Michigan Innovation Partnerships office and all proceeds are subject to university technology transfer policy. Related to this work a provisional patent has been filed by University of Michigan, where A.M.C., A.I.N., S.M.D., R. Mannan, R. Mehra, Y.Z., S.C., A.D., X.W., G.X.L., and Y.H. are named as inventors.

Figures

None
Graphical abstract
Figure 1
Figure 1
Proteogenomic biomarkers of copy number-based genome instability in renal cell carcinoma (A) Proteogenomic aberration landscape of ccRCC and non-ccRCC. Top panel: histo-molecular annotations condensed as tracks (∗excluded sample). RNA and protein automatic relevance determination in non-negative matrix factorization (ARD-NMF) classification. Middle panel: non-ccRCC display distinct recurrent events. Bottom panel: heatmaps show the top 10 differentially expressed genes and proteins enriched in annotated biological processes. Top 20 protein and RNA features (log2 fold change) from selected pathways. (B) Differentially enriched pathways (RNA and protein) among the various RCC subtypes. (C) Predicted immune composition for ccRCC and non-ccRCC. (D) Heatmap of absolute copy number variation (CNV) deduced from CNVEX output for non-ccRCC (top) and ccRCC (bottom) sorted by ploidy. Ploidy, RCC subtype, wGII annotations tracks provided (left). (E) Distribution of BAP1 mutation, wGII, immune subtype, tumor classes, and NMF clustering in five methylation subgroups. Significant enrichment (p < 0.01) of BAP1 mutation, high wGII, myeloid-lymphoid high immune subtype, and NMF cluster1 hyper-methylated group. (F) Subtype composition among low- and high-wGII tumors, in TCGA (left) and CPTAC (right) non-ccRCC (upper), and ccRCC (lower) cohorts. Bold black borders, high-wGII samples. (G) Comparison of significance levels (signed –log10 p value) between protein (x axis) and mRNA (y axis) under high to low-wGII comparison within a subset of non-ccRCC samples. Significantly upregulated genes are labeled and colored. The inset shows the global correlation between the changes. (H) Overlap between TCGA and CPTAC high-wGII mRNA expression gene markers in non-ccRCC (left) and ccRCC (right).
Figure 2
Figure 2
Tumor transcriptomic heterogeneity, immune infiltration status, and tumor cell-of-origin by snRNA-seq (A) UMAP of snRNA-seq data from eight non-ccRCC tumors. Nuclei are colored by RCC subtypes for tumor cells (left) and cell types (right). (B) First three principal components of six tumors (AML excluded) colored by tumor types. (C) Probabilities of cell-of-origin are predicted by a random forest classifier for different tumor subclusters for RCC subtypes. Classifier was trained on Lake et al. benign renal epithelial cell snRNA-seq data. (D) Averaged abundance of DE protein (top) and mRNA (bottom) markers from each RCC subtype versus NATs among the epithelial cell types identified from normal kidney scRNA-seq data.
Figure 3
Figure 3
Phosphoproteomic changes in non-ccRCC and genome-unstable tumors (A) DE kinases across major subtypes. Colors represent protein abundance fold change between tumor subtype and NATs. Highlighted kinases are significantly differentially expressed in certain tumor subtypes (adjusted p < 0.01, abs(log2 fc) > 1). CD8+, CD8 positive; CD8–, CD8 negative; MID, metabolic immune-desert; VEGF, VEGF immune-desert. Drug discovery stages (for kinases) from the drug repurposing hub indicated. (B) Subtype-specific upregulated kinases. Top to bottom: FLT1 in ccRCC, MET in pRCC type 1, KIT in oncocytic tumors, and MYLK in AML. (C) Pathways enriched among the differentially regulated phosphorylation sites across subtypes. Black borders, pathways with FDR < 20%. (D) Kinases that are enriched with down- or upregulated phosphorylation in high compared with low-wGII non-ccRCC. Kinases with enrichment p ≤ 0.05 are labeled. (E) Significantly co-regulated kinase-substrate pairs in high-wGII tumors (FDR < 0.05, abs(log2fc of kinase) > 0.05, abs(log2fc of substrates >0.5)). Diamonds and circles represent kinases and substrate proteins, respectively, and arrows point from former to latter. Diamonds filled with color represent protein abundance log2 fold change between high- and low-wGII non-ccRCC. Border color around circles represents average phosphorylation intensity log2 fold changes between high- and low-wGII non-ccRCC. Size of nodes and thickness of colored arrows are proportional to the number of significant phosphorylation events between kinases and substrate proteins. (F) Protein 3D structure of CDK2. Highlighted residues are significantly upregulated phosphorylation clusters identified by CLUMPS-PTM.
Figure 4
Figure 4
RCC glycoproteome reflects tumor immune infiltration and angiogenesis (A) Glycoprotein overlap between glyco searches on glyco-enriched samples (glyco enrichment) and phospho-enriched samples (phospho enrichment). (B) Distribution of various glycoforms found in the glyco-enriched samples. (C) Distribution of differentially expressed glycoforms. (D) DE glycoproteins (left) and proteins (right) in glyco-enriched samples and their cell type annotation, delineated by cell-type-specific expression from previous scRNA-seq data. (E) Cell-type enrichment analysis for glycoproteins markers in oncocytoma (left) and pRCC (right) in glyco-enriched samples. (F) DE cell-type-specific glycoprotein markers in glyco-enriched samples. Asterisks indicate significant adjusted q value <0.05) marker expressions. (G) Selected glycoprotein marker expression was validated using data from the Human Protein Atlas. Scale bars, 50 μm. (H) FUT8 protein expression across different RCC subtypes and NATs. (I) FUT8 RNA expression among different cell types identified in type 1 pRCC (C3N-00439) snRNA-seq data. (J) Expression of putative FUT8 glycoprotein targets in pRCC by GSEA. (K) DE glycoproteins (unnormalized data) between high- versus low-wGII non-ccRCC.
Figure 5
Figure 5
Metabolomic aberrations across RCC subtypes (A) Filtered metabolites analyzed and their distribution across functional categories. (B) Clustering of metabolomics data from different non-ccRCC and NATs. (C) DE pathways between tumor subtypes. Bubble size, number of compounds per pathway. (D) Schematic sketch of key pathways, protein and metabolite abundance log2 fold changes are represented in rounded-corner and regular-corner color boxes, respectively. (E) Distribution of tumor subtypes stratified by high- and low-wGII groups. (F) Metabolites with significant differential abundance (abs(log2fc) > 1 and p < 0.05) between high- and low-wGII tumors.
Figure 6
Figure 6
Proteogenomic biomarkers that distinguish pRCC from MTSCC (A) Significantly differential events (abs(log2fc) > 2 and q < 0.05) in protein expression (x axis) and RNA expression (y axis) between pRCC type 1 and other tumors. (B) Specificity of pRCC type 1 protein markers PIGR and SOSTDC1. (C) Expression of pRCC type 1 protein markers PIGR and SOSTDC1 in the proteomics data from Xu et al. (PXD027972). (D) H&E, protein IHC, and RNA-ISH images (top to bottom) of biomarker PIGR in normal kidney tissue, pRCC, MTSCC tumors (upper panels from left to right) and SOSTDC1 in chRCC, pRCC, and MTSCC (lower panels from left to right). (E) RNA-ISH comparative scores of PIGR and SOSTDC1 in different tumor types. Red points represent external University of Michigan samples. (F) Location of missense mutations in MET across TCGA cohorts are colored on the MET protein domain diagram. (G) PTM-SEA analysis shows pathways such as EGFR are significantly enriched with increased phosphorylation in MET mutant pRCC samples. (H) Enrichment in chromosomes 7 and 17 gene sets are tested with protein expression difference between chromosome 7 gain and no gain non-ccRCC sample groups.
Figure 7
Figure 7
Proteogenomic biomarkers that distinguish oncocytomas (RO) from chRCC (A) DE proteins (x axis) and mRNA (y axis) between RO and chRCC. Indicated genes have p < 0.01 in both dimensions, and candidates in red (MAPRE3, ADGRF5, GPNMB) were subsequently validated as RO- and chRCC-specific biomarkers, respectively. (B) chRCC marker GPNMB (left) and RO biomarkers ADGRF5 and MAPRE3 protein abundance in different subtypes. (C) Overlap between DE proteins identified in this study (CPTAC) and the publicly available PXD007633 dataset in RO (left) and PXD019123 chRCC dataset (right). Genes in red are associated with FOX1 and DMRT2. (D) Immunohistochemistry validation of nominated markers seen in representative tumor sections. Corresponding H&E staining images are shown alongside.

References

    1. Moch H., Amin M.B., Berney D.M., Compérat E.M., Gill A.J., Hartmann A., Menon S., Raspollini M.R., Rubin M.A., Srigley J.R. The 2022 World Health Organization classification of tumours of the urinary system and male genital organs—part A: renal, penile, and testicular tumours. Eur. Urol. 2022:82. - PubMed
    1. Moch H., Cubilla A.L., Humphrey P.A., Reuter V.E., Ulbright T.M. The 2016 WHO Classification of Tumours of the Urinary System and Male Genital Organs-Part A: Renal, Penile, and Testicular Tumours. Eur. Urol. 2016;70:93–105. doi: 10.1016/j.eururo.2016.02.029. - DOI - PubMed
    1. Warren A.Y., Harrison D. WHO/ISUP classification, grading and pathological staging of renal cell carcinoma: standards and controversies. World J. Urol. 2018;36:1913–1926. doi: 10.1007/s00345-018-2447-8. - DOI - PMC - PubMed
    1. Wobker S.E., Matoso A., Pratilas C.A., Mangray S., Zheng G., Lin M.-T., Debeljak M., Epstein J.I., Argani P. Metanephric Adenoma-Epithelial Wilms Tumor Overlap Lesions: An Analysis of BRAF Status. Am. J. Surg. Pathol. 2019;43:1157–1169. doi: 10.1097/PAS.0000000000001240. - DOI - PubMed
    1. Sirintrapun S.J., Geisinger K.R., Cimic A., Snow A., Hagenkord J., Monzon F., Legendre B.L., Ghazalpour A., Bender R.P., Gatalica Z. Oncocytoma-like renal tumor with transformation toward high-grade oncocytic carcinoma: a unique case with morphologic, immunohistochemical, and genomic characterization. Medicine (Baltim.) 2014;93 doi: 10.1097/MD.0000000000000081. - DOI - PMC - PubMed

Substances