. 2024 May 21;5(5):101529.
doi: 10.1016/j.xcrm.2024.101529. Epub 2024 May 3.

Genetic variants for head size share genes and pathways with cancer

Maria J Knol  1 Raymond A Poot  2 Tavia E Evans  3 Claudia L Satizabal  4 Aniket Mishra  5 Muralidharan Sargurupremraj  6 Sandra van der Auwera  7 Marie-Gabrielle Duperron  5 Xueqiu Jian  8 Isabel C Hostettler  9 Dianne H K van Dam-Nolen  10 Sander Lamballais  11 Mikolaj A Pawlak  12 Cora E Lewis  13 Amaia Carrion-Castillo  14 Theo G M van Erp  15 Céline S Reinbold  16 Jean Shin  17 Markus Scholz  18 Asta K Håberg  19 Anders Kämpe  20 Gloria H Y Li  21 Reut Avinun  22 Joshua R Atkins  23 Fang-Chi Hsu  24 Alyssa R Amod  25 Max Lam  26 Ami Tsuchida  27 Mariël W A Teunissen  28 Nil Aygün  29 Yash Patel  30 Dan Liang  29 Alexa S Beiser  31 Frauke Beyer  32 Joshua C Bis  33 Daniel Bos  34 R Nick Bryan  35 Robin Bülow  36 Svenja Caspers  37 Gwenaëlle Catheline  38 Charlotte A M Cecil  39 Shareefa Dalvie  25 Jean-François Dartigues  40 Charles DeCarli  41 Maria Enlund-Cerullo  42 Judith M Ford  43 Barbara Franke  44 Barry I Freedman  45 Nele Friedrich  46 Melissa J Green  47 Simon Haworth  48 Catherine Helmer  49 Per Hoffmann  50 Georg Homuth  51 M Kamran Ikram  52 Clifford R Jack Jr  53 Neda Jahanshad  54 Christiane Jockwitz  55 Yoichiro Kamatani  56 Annchen R Knodt  22 Shuo Li  57 Keane Lim  58 W T Longstreth  59 Fabio Macciardi  60 Cohorts for Heart and Aging Research in Genomic Epidemiology (CHARGE) ConsortiumEnhancing NeuroImaging Genetics through Meta-Analysis (ENIGMA) ConsortiumOuti Mäkitie  61 Bernard Mazoyer  62 Sarah E Medland  63 Susumu Miyamoto  64 Susanne Moebus  65 Thomas H Mosley  66 Ryan Muetzel  39 Thomas W Mühleisen  67 Manabu Nagata  64 Soichiro Nakahara  68 Nicholette D Palmer  69 Zdenka Pausova  17 Adrian Preda  70 Yann Quidé  47 William R Reay  23 Gennady V Roshchupkin  34 Reinhold Schmidt  71 Pamela J Schreiner  72 Kazuya Setoh  56 Chin Yang Shapland  73 Stephen Sidney  74 Beate St Pourcain  75 Jason L Stein  29 Yasuharu Tabara  56 Alexander Teumer  76 Anne Uhlmann  25 Aad van der Lugt  10 Meike W Vernooij  34 David J Werring  77 B Gwen Windham  66 A Veronica Witte  32 Katharina Wittfeld  7 Qiong Yang  57 Kazumichi Yoshida  64 Han G Brunner  78 Quentin Le Grand  79 Kang Sim  80 Dan J Stein  81 Donald W Bowden  69 Murray J Cairns  23 Ahmad R Hariri  22 Ching-Lung Cheung  82 Sture Andersson  83 Arno Villringer  84 Tomas Paus  85 Sven Cichon  86 Vince D Calhoun  87 Fabrice Crivello  88 Lenore J Launer  89 Tonya White  90 Peter J Koudstaal  91 Henry Houlden  77 Myriam Fornage  92 Fumihiko Matsuda  56 Hans J Grabe  93 M Arfan Ikram  1 Stéphanie Debette  94 Paul M Thompson  54 Sudha Seshadri  4 Hieab H H Adams  95
Collaborators, Affiliations

Genetic variants for head size share genes and pathways with cancer

Maria J Knol et al. Cell Rep Med. .

Abstract

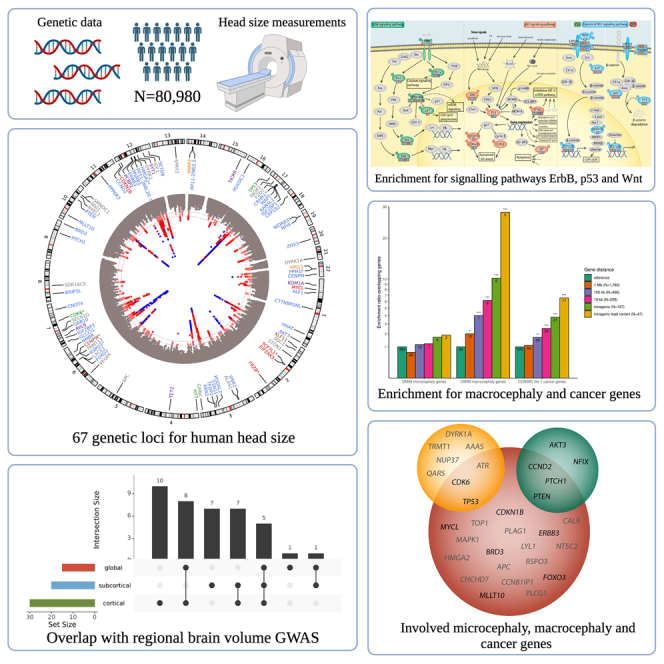
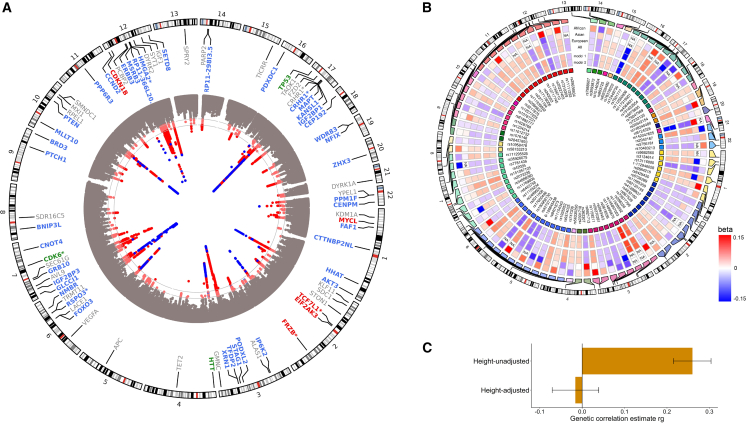
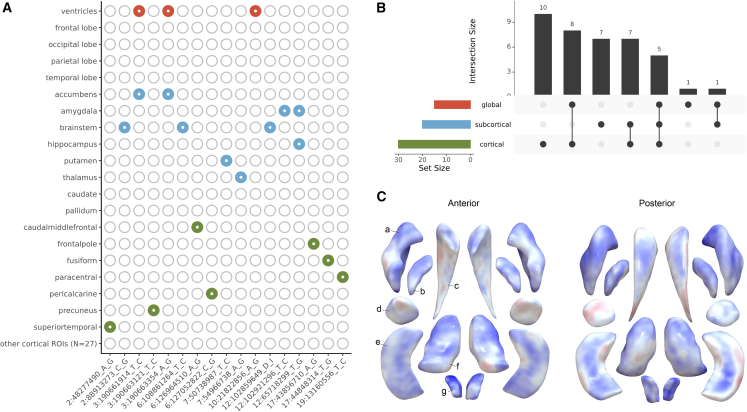
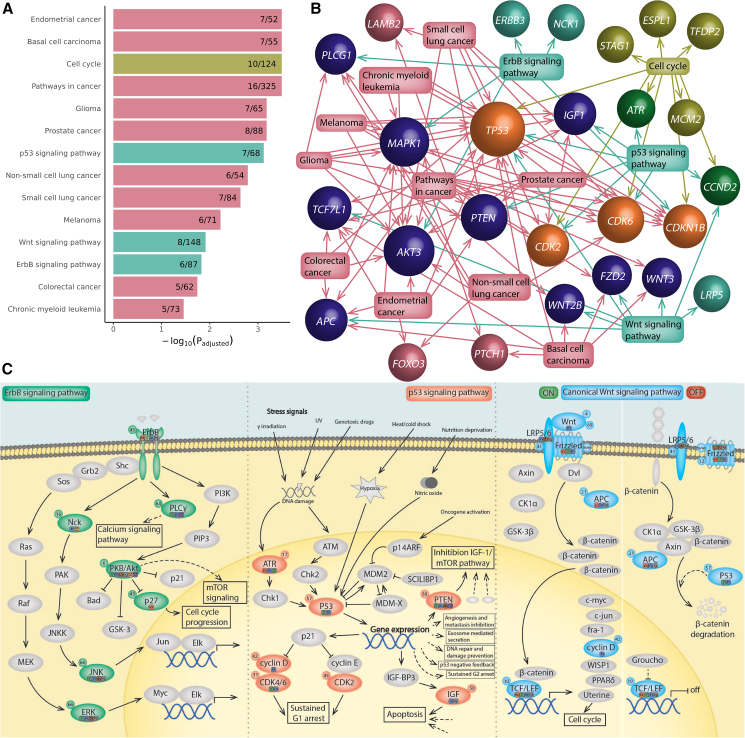
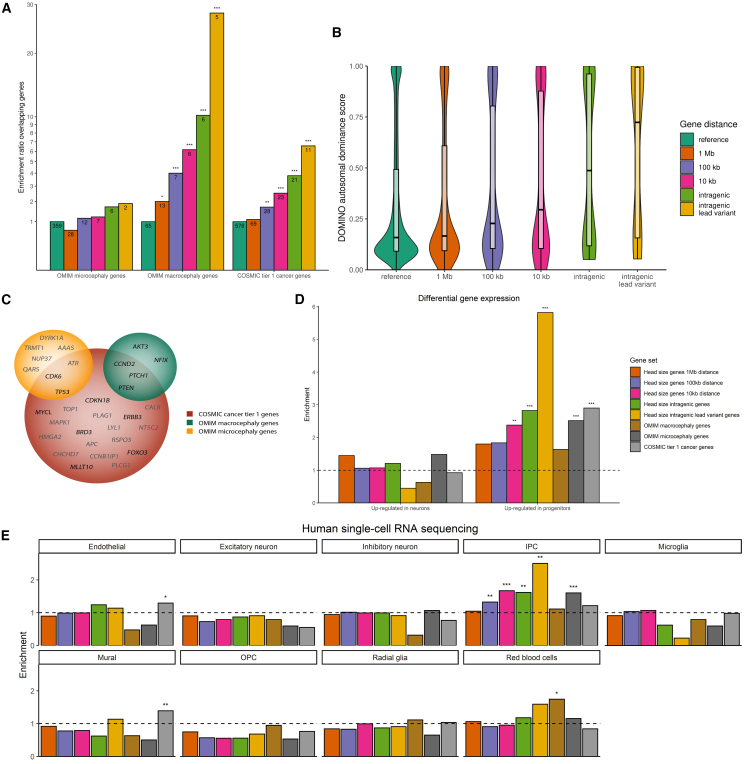
The size of the human head is highly heritable, but genetic drivers of its variation within the general population remain unmapped. We perform a genome-wide association study on head size (N = 80,890) and identify 67 genetic loci, of which 50 are novel. Neuroimaging studies show that 17 variants affect specific brain areas, but most have widespread effects. Gene set enrichment is observed for various cancers and the p53, Wnt, and ErbB signaling pathways. Genes harboring lead variants are enriched for macrocephaly syndrome genes (37-fold) and high-fidelity cancer genes (9-fold), which is not seen for human height variants. Head size variants are also near genes preferentially expressed in intermediate progenitor cells, neural cells linked to evolutionary brain expansion. Our results indicate that genes regulating early brain and cranial growth incline to neoplasia later in life, irrespective of height. This warrants investigation of clinical implications of the link between head size and cancer.

Keywords: cancer; genetics; genome-wide association study; head circumference; head size; intracranial volume; meta-analysis.


Conflict of interest statement

Declaration of interests H.H. and I.C.H. received funding from Alzheimer’s Research UK and the Dunhill Medical Trust Foundation. M.A.P. reported receiving grants and personal and travel fees from Roche, Novartis, Merck, and Biogen outside the submitted work. M. Scholz receives funding from Pfizer Inc. for a project not related to this research. C.D. serves as a consultant of Novartis Pharmaceuticals. B.F. has received educational speaking fees from Medice. N.J. and P.M.T. are MPIs of a research grant from Biogen Inc. for work unrelated to the contents of this manuscript. D.J.W. received funding from the Stroke Foundation/British Heart Foundation. D.J.S. has received consultancy honoraria from Discovery Vitality, Johnson & Johnson, Kanna, L’Oreal, Lundbeck, Orion, Sanofi, Servier, Takeda, and Vistagen. H.H. received funding from MRC, Wellcome Trust, and NIHR UCLH BRC. H.J.G. has received travel grants and speaker’s honoraria from Fresenius Medical Care, Neuraxpharm, and Janssen Cilag as well as research funding from Fresenius Medical Care.

Figures

None
Graphical abstract
Figure 1
Figure 1
Genome-wide association studies on human head size (A) Circos Manhattan plot of the European ancestry head size GWAS, with gray lines corresponding to genome-wide significant (p < 5 × 10−8) or sub-significant (p < 1 × 10−6) p value thresholds. Known variants are in blue, novel ones in red. For each lead variant, the nearest gene is presented, with the color corresponding to its position to the lead variant: exonic (red), 3′-UTR (green), intronic (blue), intergenic including up- and downstream, exonic and intronic non-coding RNA (gray). Nearest genes for more than one locus are denoted with an asterisk (∗). (B) Circos heatmap showing the betas of lead variants in African, Asian, and European ancestry meta-analyses, as well as the transancestral meta-analysis. Differences between the height-unadjusted (model 1) and -adjusted (model 2) meta-analysis are also shown. (C) Bar plot of the genetic correlation coefficient (ρgenetic) of the height-unadjusted and -adjusted head size GWAS with the height GWAS, with their accompanying 95% confidence intervals.
Figure 2
Figure 2
Genetic loci for head size and effects on regional brain volumes (A) Heatmap showing head size loci that overlap with previously identified loci for global brain volumes (red), subcortical volumes (blue), and cortical region of interest volumes (green). (B) UpSet plot of associations between head size lead variants and brain volumes. Intersection size corresponds to the frequency of the combination depicted below the bar. Set size corresponds to the frequency of associations with one of the brain volume categories (i.e., global, subcortical, or cortical). (C) Plot showing the subcortical shape analysis of rs111939932 using log Jacobian determinants. Colors correspond to t values, with positive associations depicted in blue, and negative ones in red. Letters point to different subcortical structures: a, putamen; b, pallidum; c, caudate; d, amygdala; e, hippocampus; f, thalamus; g, accumbens.
Figure 3
Figure 3
Gene sets enriched in human head size loci (A) Bar plots presenting enriched KEGG gene sets. –log10 of adjusted p value and proportion of nearby genes overlapping with the gene set are presented. Cancer gene sets are depicted in pink, cell growth and death gene sets in yellow-green, and signal transduction gene sets in turquoise. (B) Network graph showing enriched KEGG gene sets and their included genes near genetic lead variants. Gene sets are shown in squares with arrows to overlapping genes. Colors correspond to gene set categories: only cancer gene sets (pink), only cell growth and death gene sets (yellow-green), only signal transduction gene sets (turquoise), cancer gene sets and cell growth and death gene sets (dark blue), cell growth and death and signal transduction gene sets (green), or all three gene set categories (orange). Sphere size corresponds to the number of gene sets linked to that gene. (C) Schematic overview of enriched signaling pathways with proteins encoded by genes near (<10 kb) identified genetic loci. Proteins encoded by these genes are colored (green, ErbB pathway; red, p53 pathway; blue, Wnt pathway), other proteins are depicted in gray. Circles next to protein names provide the locus number of the encoding gene. Locations of lead variants and variants in LD (r2 > 0.6) are shown in squares next to the proteins: exonic (e; red), 3′-UTR (3′; green), 5′-UTR (5; light green), intronic (i; blue), intergenic including up- and downstream, exonic and intronic non-coding RNA (g; gray). For Frizzled, not only FZD2 but also FRZB is taken into consideration.
Figure 4
Figure 4
Gene enrichments stratified by distance from head size lead variants (A) Enrichment of OMIM macro- and microcephaly genes and COSMIC tier 1 genes near identified genetic loci. Depicted are enrichments of genes within 1 Mb (orange), 100 kb (purple), or 10 kb (pink) of identified genetic loci, genes with intragenic genetic variants (light green) and genes with intragenic genetic lead variants (yellow) in comparison with genes in the reference genome (dark green). ∗p < 0.05; ∗∗p < 0.0125 (0.05/4); ∗∗∗p < 0.0025 (0.05/4/5). (B) Violin plots showing DOMINO autosomal dominance scores of different gene sets. ∗p < 0.05; ∗∗p < 0.01; ∗∗∗p < 0.001. (C) Venn diagram showing genes within 10 kb of genetic loci that overlap with OMIM microcephaly genes (yellow) or macrocephaly genes (green) or COSMIC cancer tier 1 genes (red). Genes with intragenic lead variants are depicted in black, others in gray. (D) Bar plot showing enrichments of gene sets for genes differentially expressed in neurons and progenitors. ∗p < 0.05; ∗∗p < 0.025 (0.05/2); ∗∗∗p < 0.003 (0.05/2/8). (E) Bar plots showing enrichments of gene sets for the various cell types in the human cortical brain using single-cell RNA-sequencing data. ∗p < 0.05; ∗∗FDR < 0.05; ∗∗∗p < 0.0007 (0.05/9/8).

References

    1. Dekaban A.S. Changes in brain weights during the span of human life: relation of brain weights to body heights and body weights. Ann. Neurol. 1978;4:345–356. - PubMed
    1. Smit D.J.A., Luciano M., Bartels M., van Beijsterveldt C.E.M., Wright M.J., Hansell N.K., Brunner H.G., Estourgie-van Burk G.F., de Geus E.J.C., Martin N.G., Boomsma D.I. Heritability of head size in Dutch and Australian twin families at ages 0-50 years. Twin Res. Hum. Genet. 2010;13:370–380. - PubMed
    1. Pirozzi F., Nelson B., Mirzaa G. From microcephaly to megalencephaly: determinants of brain size. Dialogues Clin. Neurosci. 2018;20:267–282. - PMC - PubMed
    1. Jansen P.R., Nagel M., Watanabe K., Wei Y., Savage J.E., de Leeuw C.A., van den Heuvel M.P., van der Sluis S., Posthuma D. Genome-wide meta-analysis of brain volume identifies genomic loci and genes shared with intelligence. Nat. Commun. 2020;11:5606. - PMC - PubMed
    1. Haworth S., Shapland C.Y., Hayward C., Prins B.P., Felix J.F., Medina-Gomez C., Rivadeneira F., Wang C., Ahluwalia T.S., Vrijheid M., et al. Low-frequency variation in TP53 has large effects on head circumference and intracranial volume. Nat. Commun. 2019;10:357. - PMC - PubMed

Grants and funding