. 2024 May 21;5(5):101546.
doi: 10.1016/j.xcrm.2024.101546. Epub 2024 May 3.

Targeting low levels of MIF expression as a potential therapeutic strategy for ALS

Affiliations

Targeting low levels of MIF expression as a potential therapeutic strategy for ALS

Leenor Alfahel et al. Cell Rep Med. .

Abstract

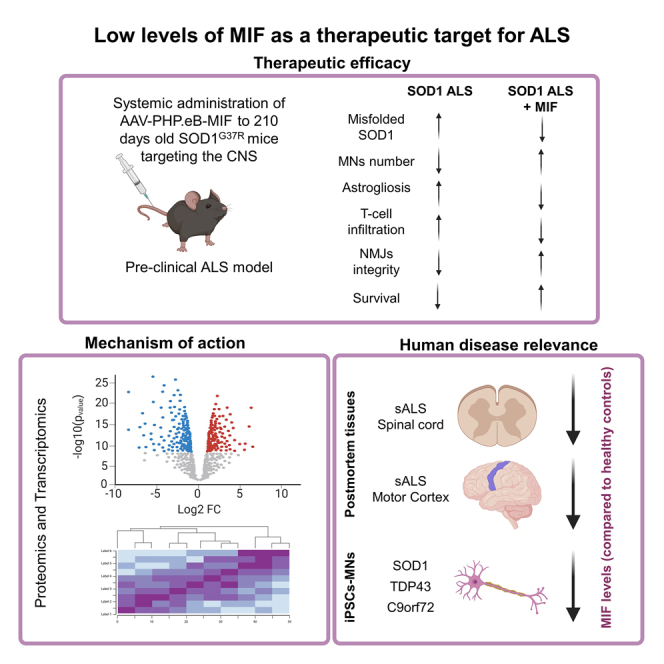
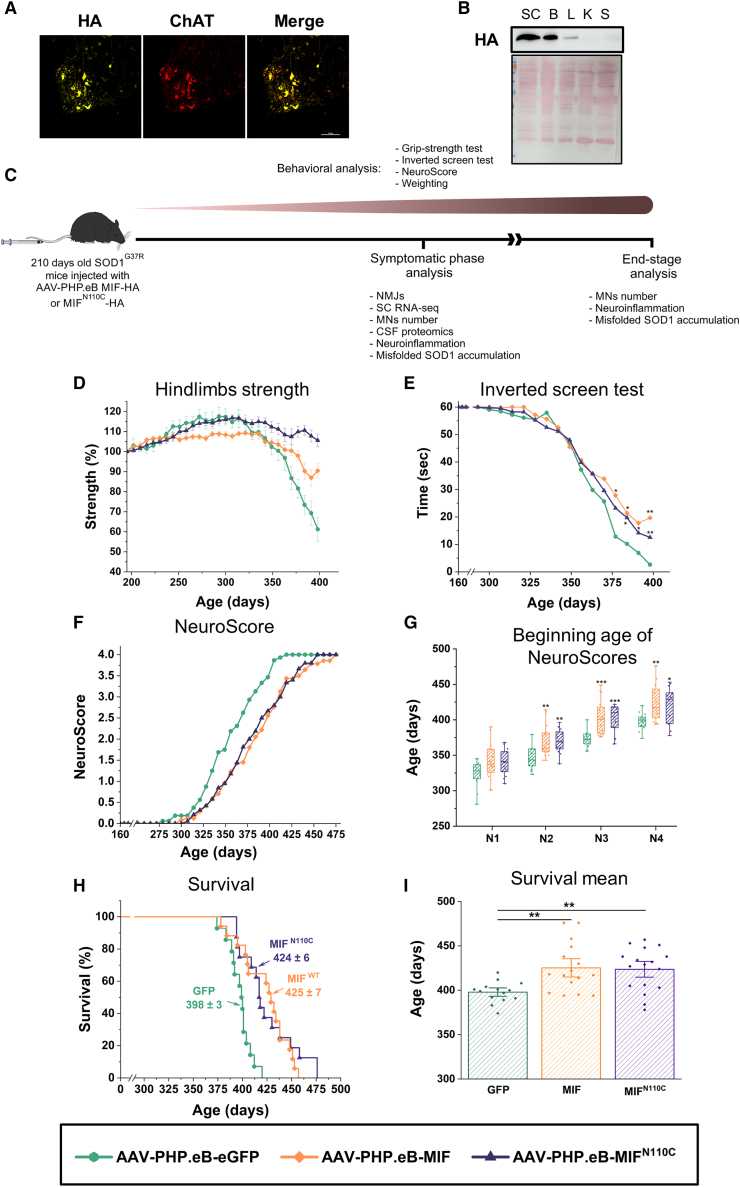
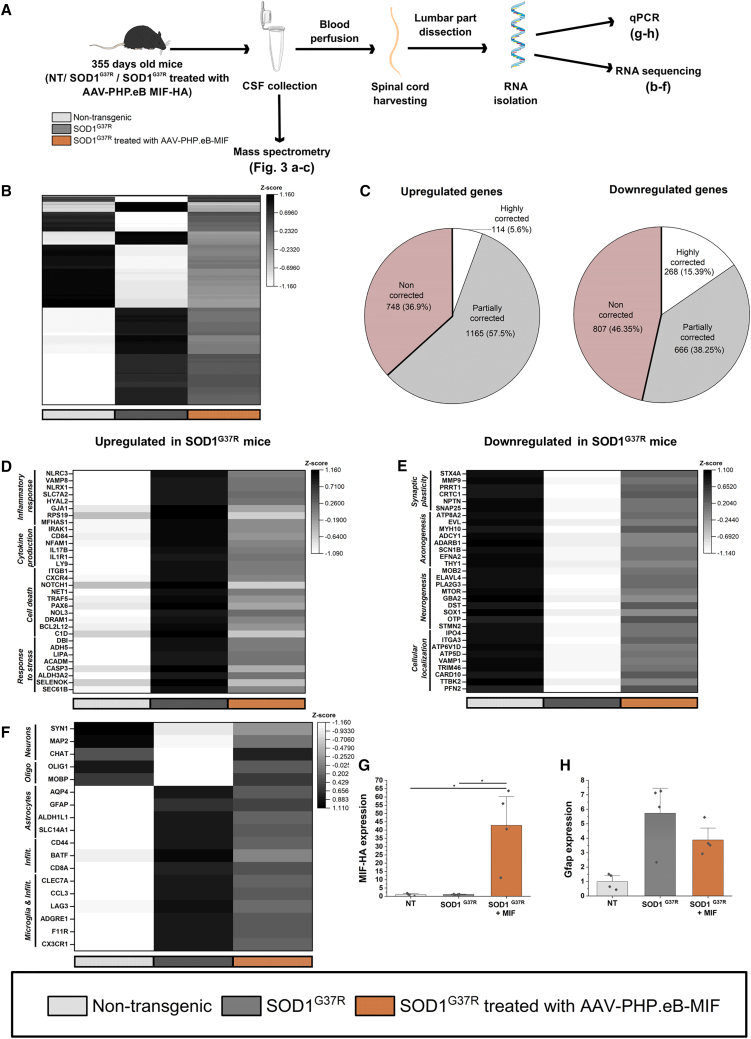
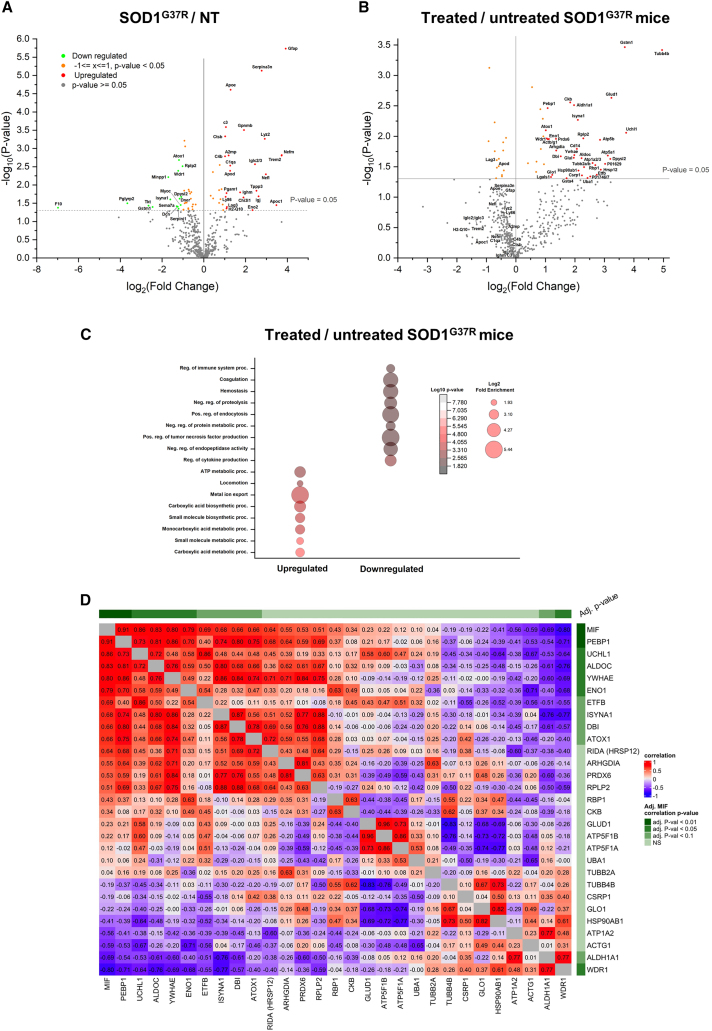
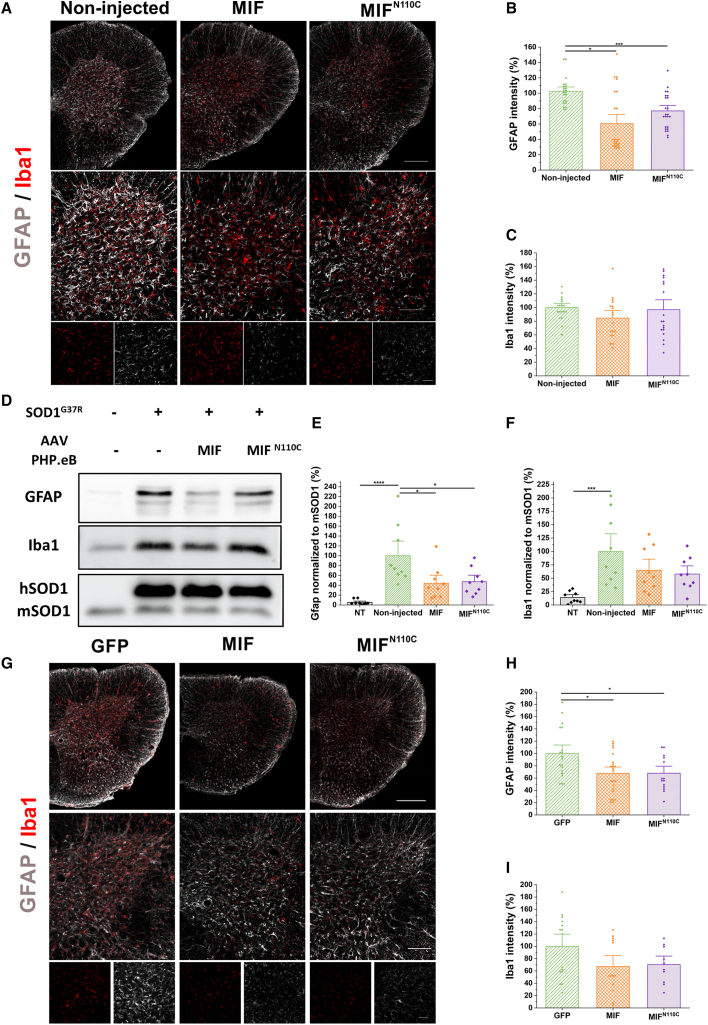
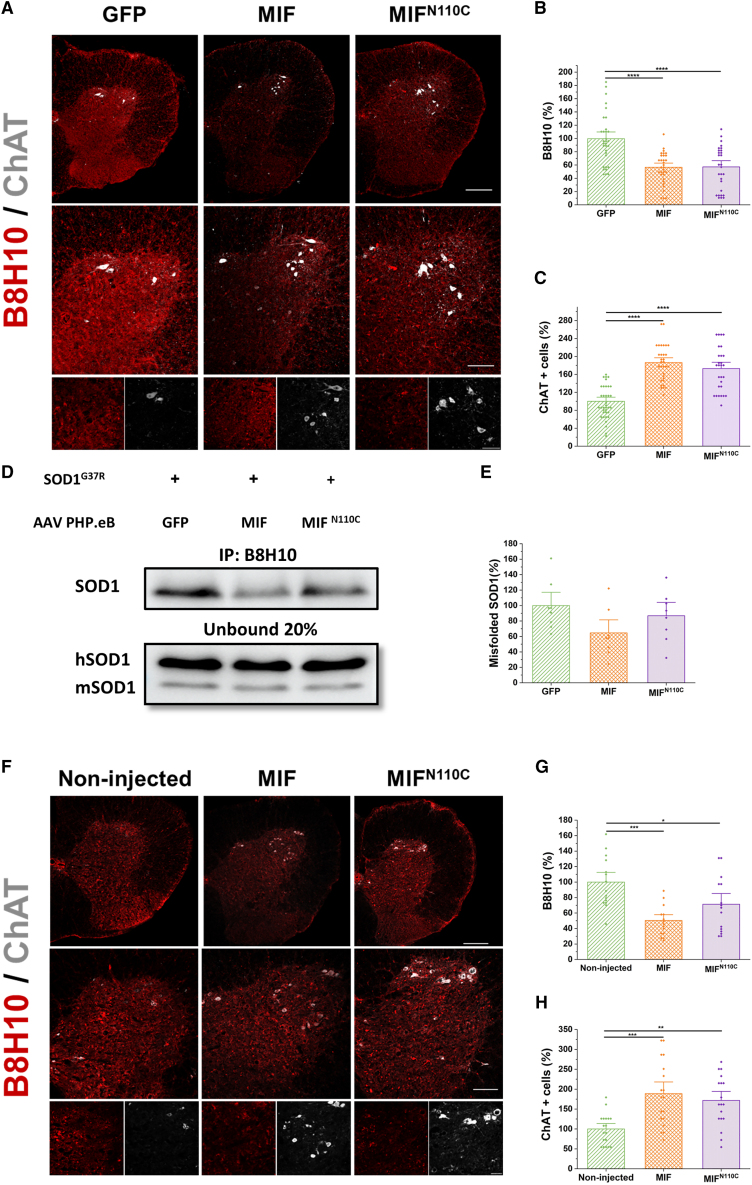
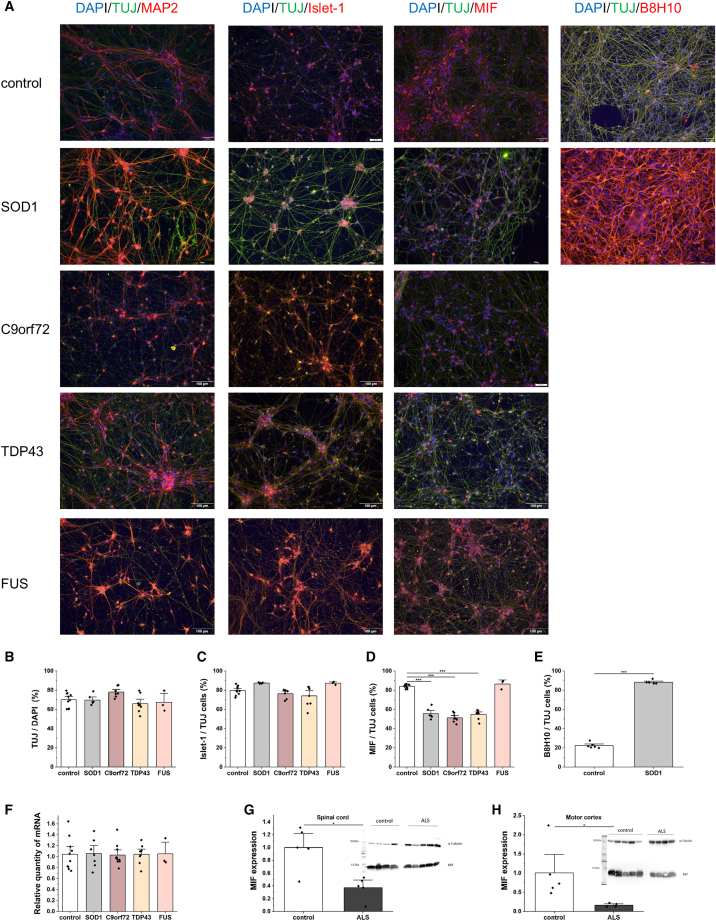
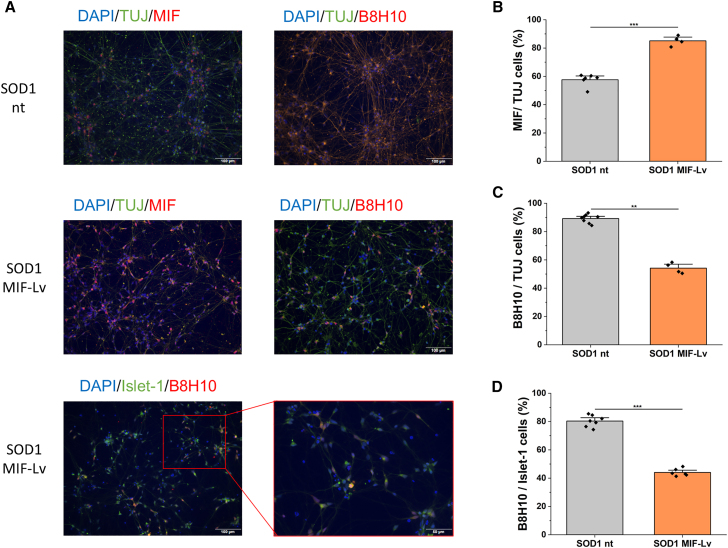
Mutations in SOD1 cause amyotrophic lateral sclerosis (ALS), a neurodegenerative disease characterized by motor neuron (MN) loss. We previously discovered that macrophage migration inhibitory factor (MIF), whose levels are extremely low in spinal MNs, inhibits mutant SOD1 misfolding and toxicity. In this study, we show that a single peripheral injection of adeno-associated virus (AAV) delivering MIF into adult SOD1G37R mice significantly improves their motor function, delays disease progression, and extends survival. Moreover, MIF treatment reduces neuroinflammation and misfolded SOD1 accumulation, rescues MNs, and corrects dysregulated pathways as observed by proteomics and transcriptomics. Furthermore, we reveal low MIF levels in human induced pluripotent stem cell-derived MNs from familial ALS patients with different genetic mutations, as well as in post mortem tissues of sporadic ALS patients. Our findings indicate that peripheral MIF administration may provide a potential therapeutic mechanism for modulating misfolded SOD1 in vivo and disease outcome in ALS patients.

Keywords: AAV; ALS; MIF; familial ALS; iPSCs; misfolded SOD1; motor neurons; mutant SOD1; mutant SOD1 mouse; sporadic ALS.


Conflict of interest statement

Declaration of interests The authors declare no competing interests.

Figures

None
Graphical abstract
Figure 1
Figure 1
Peripheral delivery of AAV-PHP.eB-MIF or AAV-PHP.eB-MIFN110C to mutant SOD1G37R mice after disease onset improves their motor function and neurological symptoms and extends their survival (A) Immunofluorescence staining of the lumbar spinal cord of AAV-PHP.eB-MIF-HA-treated mice 3 weeks following tail-vein injection was detected by anti-HA antibody (yellow) co-stained with anti-ChAT antibody (red). Scale bar: 100 μM. (B) Immunoblot detection of AAV-PHP.eB-MIF-HA using anti-HA antibody in the spinal cord (SC), brain (B), liver (L), kidney (K), and spleen (S) 3 weeks following tail-vein injection. (C) Schematic representation of the experimental design using smart Servier Medical Art, licensed under a Creative Commons Attribution 3.0 Unported License. AAV PHP.eB-MIF-HA, AAV PHP.eB-MIFN110C-HA, or AAV PHP.eB-eGFP were delivered via tail-vein injection after disease onset. (D) Hindlimb strength (%) measured by a grip-strength meter. (E) Hanging time (seconds) in inverted screen test. (F and G) NeuroScore measurement (F) and the age at the beginning of each NeuroScore (G). (H and I) Survival (%) (H) and mean survival ± SEM (I) of SOD1G37R mice injected with AAV-PHP.eB-eGFP, green, n = 16 (D–G), n = 14 (H and I); SOD1G37R mice injected with AAV PHP.eB-MIF, orange, n = 15 (D–G), n = 16 (H and I); SOD1G37R mice injected with AAV-PHP.eB-MIFN110C, purple, n = 14 (D–G), n = 17 (H and I). Statistics were performed using one-way ANOVA followed by Tukey’s multiple comparison test. ∗∗∗p < 10−3, ∗∗p < 0.01, ∗p < 0.05. See also Figures S1, S2, S3.
Figure 2
Figure 2
Overexpression of MIF in the nervous system partially corrects the expression of several genes that were altered in symptomatic mutant SOD1G37R mice (A) Experimental design for CSF isolation for proteomics and RNA isolation for RNA sequencing analysis from 355-day-old mice using smart Servier Medical Art, licensed under a Creative Commons Attribution 3.0 Unported License. (B) Heatmap of all the genes that were significantly altered in SOD1G37R (gray, n = 10) compared to non-transgenic (NT) mice (white, n = 10) and were at least partially corrected in the MIF-treated mice (orange, n = 4). (C) Pie charts of all the upregulated or downregulated genes in the spinal cord of the mutant SOD1G37R compared to NT mice, representing the portion of highly corrected, partially corrected, and non-corrected genes in AAV-PHP.eB-MIF-treated compared to -untreated SOD1G37R mice. (D and E) Heatmaps of the expression of representative genes that were significantly upregulated (D) or downregulated (E) in SOD1G37R compared to NT mice, ordered according to their Gene Ontology (GO) pathways. (F) Heatmaps of the expression of representative genes related to microglia, astrocytes, neurons, oligodendrocytes (Oligo), or infiltrated cells (Infilt.). (G and H) qPCRs for relative expression of MIF-HA (G) or GFAP (H) in the NT (n = 4), SOD1G37R (n = 4), or SOD1G37R treated with MIF (n = 4), normalized to GAPDH expression. Graphs represent mean ± SEM. The heatmaps were generated using the Z score of the gene expression. Statistics were performed using one-way ANOVA followed by Tukey’s multiple comparison test. p < 0.05. See also Figure S4 and Table S1.
Figure 3
Figure 3
Upregulation of MIF in the nervous system partially corrects the expression of altered proteins in the CSF of symptomatic mutant SOD1G37R mice (A and B) Volcano plots of proteomics data. The –log (p value) plotted against the log2 of the fold change of proteins in the CSF of SOD1G37R (n = 3) compared to NT mice (n = 4) (A) or proteins in the CSF of AAV-PHP.eB-MIF-treated (n = 4) compared to -untreated SOD1G37R mice (n = 4) (B). (C) Colored bubble plot representing the upregulated and downregulated GO pathways in the AAV-PHP.eB-MIF-treated compared to -untreated SOD1G37R mice. The color of the bubble represents the log10 of the p value of the pathway, and the bubble size represents the fold enrichment of the pathways. (D) Heatmap showing correlation across protein expression in iPSC MNs derived from SOD1 patients in the Answer ALS dataset (n = 10) for proteins that were significantly upregulated following MIF treatment in (B). Columns and rows sorted by expression correlation with MIF. Green annotation bar (top) indicates significance (FDR adjusted) of Pearson correlation of protein in column with MIF expression. See also Figures S5, and S6.
Figure 4
Figure 4
Overexpression of MIF or MIFN110C in the nervous system of mutant SOD1G37R mice after disease onset reduces astrogliosis in the spinal cord (A and G) Immunofluorescence staining of the ventral region of the lumbar spinal cord at the symptomatic stage (A) or end-stage (G) of the disease stained for activated astrocytes (GFAP, gray) and microglia (Iba-1, red). (B and H) Quantification of the intensity of GFAP in the ventral horn of the lumbar spinal cord at the symptomatic (n = 3) (B) or end-stage (n = 4) (H) of the disease, normalized to the non-injected (n = 3) or GFP-injected group (n = 4). (C and I) Quantification of the intensity of Iba-1 in the ventral horn of the lumbar spinal cord at the symptomatic (n = 3) (B) or end-stage (n = 4) (H) of the disease, normalized to the non-injected (n = 3) or GFP-injected group (n = 4). (D) Immunoblot analysis of activated astrocytes (GFAP) and microglia (Iba-1) in the lumbar spinal cord of NT, non-injected, MIF-treated, or MIFN110C-treated SOD1G37R mice. (E and F) Quantification of GFAP (E) and Iba-1 (F) in the spinal cord normalized to non-injected group (n = 4). Endogenous SOD1 (mSOD1) was used as loading control. Graphs represent mean ± SEM.Statistics were performed using one-way ANOVA followed by Tukey’s multiple comparison test or using Kruskal-Wallis one-way ANOVA followed by Dunn’s multiple comparison test. Scale bars, 200, 100, and 50 μm. ∗∗∗∗p < 10−4, ∗∗∗p < 10−3, ∗p < 0.05. See also Figure S7.
Figure 5
Figure 5
MIF or MIFN110C upregulation in the nervous system of mutant SOD1G37R mice after disease onset reduces misfolded SOD1 accumulation and rescues spinal motor neurons (A and F) Immunofluorescence staining of the ventral region of the lumbar spinal cord at the end stage (A) or symptomatic stage (F) of the disease stained for MNs (ChAT, white) and misfolded SOD1 (B8H10, red). (B and G) Quantification of misfolded SOD1 intensity in the ventral horn of the lumbar spinal cord at disease end-stage (n = 4) (B) or symptomatic stage (n = 3) (G), normalized to GFP-treated group (n = 4) or to non-injected group (n = 3). (C and H) Numerical quantification of ChAT-positive neurons in the ventral horn of the lumbar spinal cord at disease end-stage (n = 4) (C) or symptomatic stage (n = 3) (H), normalized to GFP-treated group or to non-injected group. (D) Immunoprecipitation using B8H10 antibody to detect misfolded SOD1 in the lumbar spinal cord of GFP-, MIF-, or MIFN110C-treated SOD1G37R mice. (E) Quantification of the bound misfolded SOD1 normalized to the level of endogenous SOD1 (mSOD1) (n = 4). Graphs represent mean ± SEM. Statistics were performed using one-way ANOVA followed by Tukey’s multiple comparison test. Scale bars, 200, 100, and 50 μm. ∗∗∗∗p < 10−4,∗∗∗p < 10-3, ∗∗p < 0.01, ∗p < 0.05.
Figure 6
Figure 6
Reduced MIF protein expression in ALS-patient-derived motor neurons and human ALS post mortem tissue (A–E) Immunocytochemistry of typical neuronal (TUJ) and MN (Islet-1) markers, MIF, and misfolded SOD1 (B8H10) in human iPSC-derived control and ALS MNs after DIV 38. (D) ∗∗∗p < 0.001, one-way ANOVA followed by Tukey’s multiple comparison test; (E) ∗∗∗p < 0.001, unpaired two-tailed t test. (F) MIF mRNA expression of iPSC-derived MNs using RT-qPCR; scale bars, 100 μm. (G and H) MIF expression normalized to α-tubulin in human post mortem tissue samples from spinal cord (G) or motor cortex (H) of sporadic ALS patients and healthy controls determined by immunoblots, n = 4–5; two or three technical replicates. Graphs represent mean ± SEM. Statistics were performed using Mann-Whitney U test or two-tailed t test. ∗p < 0.05. See also Figure S8.
Figure 7
Figure 7
Lentiviral transduction of mutant SOD1 iPSC-derived motor neurons with MIF reduces SOD1 misfolding (A) ICC staining for MIF and misfolded SOD1 before and after transduction of iPSC-derived mutant SOD1 MNs. (B–D) Quantitative analysis of MIF and misfolded SOD1 protein expression in human IPSC-derived mutant SOD1 MNs. MIF expression (B) and misfolded SOD1 accumulation after MIF transduction in relation to TUJ-positive cells (C), and in relation to Islet-1-positive cells (D).>2 biological and >2 technical replicates. Graphs represent mean ± SEM. Statistics were performed using unpaired two-tailed t test. ∗∗p < 0.01; ∗∗∗p < 0.001); scale bars, 100 μm, 50 μm.

Similar articles

Cited by

References

    1. Bonafede R., Mariotti R. ALS Pathogenesis and Therapeutic Approaches: The Role of Mesenchymal Stem Cells and Extracellular Vesicles. Front. Cell. Neurosci. 2017;11:80. - PMC - PubMed
    1. Cleveland D.W., Rothstein J.D. From Charcot to Lou Gehrig: deciphering selective motor neuron death in ALS. Nat. Rev. Neurosci. 2001;2:806–819. - PubMed
    1. Da Cruz S., Cleveland D.W. Understanding the role of TDP-43 and FUS/TLS in ALS and beyond. Curr. Opin. Neurobiol. 2011;21:904–919. - PMC - PubMed
    1. Abu-Hamad S., Kahn J., Leyton-Jaimes M.F., Rosenblatt J., Israelson A. Misfolded SOD1 Accumulation and Mitochondrial Association Contribute to the Selective Vulnerability of Motor Neurons in Familial ALS: Correlation to Human Disease. ACS Chem. Neurosci. 2017;8:2225–2234. - PubMed
    1. Wang Q., Johnson J.L., Agar N.Y.R., Agar J.N. Protein aggregation and protein instability govern familial amyotrophic lateral sclerosis patient survival. PLoS Biol. 2008;6 - PMC - PubMed

MeSH terms

Substances