. 2024 May 21;5(5):101549.
doi: 10.1016/j.xcrm.2024.101549. Epub 2024 May 3.

Assessing personalized responses to anti-PD-1 treatment using patient-derived lung tumor-on-chip

Affiliations

Assessing personalized responses to anti-PD-1 treatment using patient-derived lung tumor-on-chip

Irina Veith et al. Cell Rep Med. .

Abstract

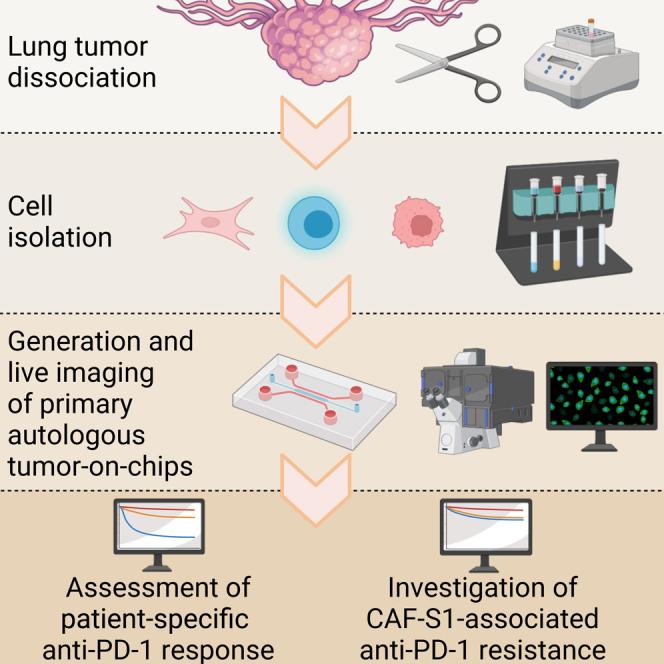
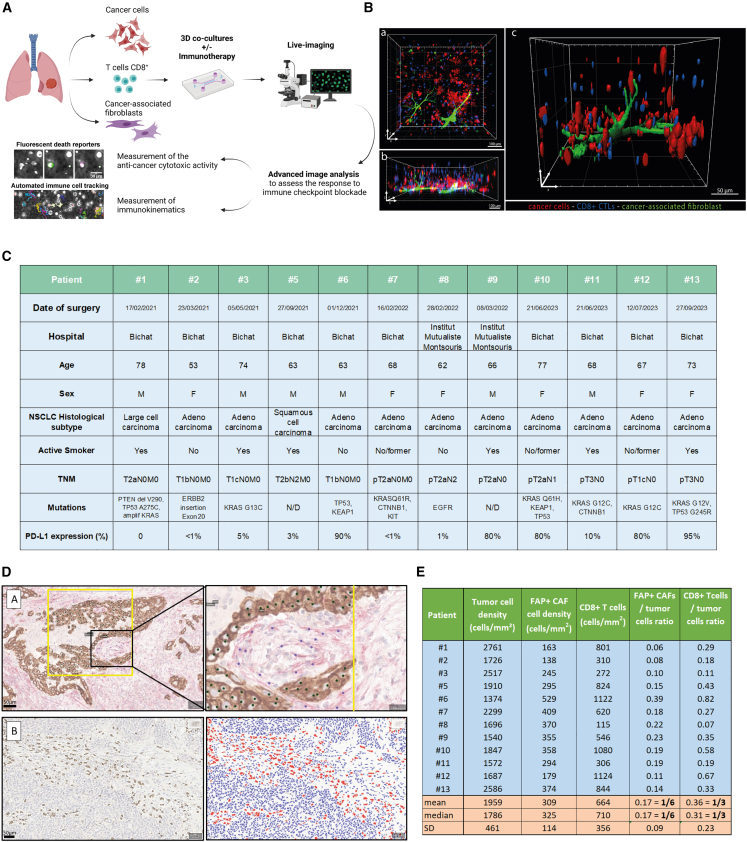
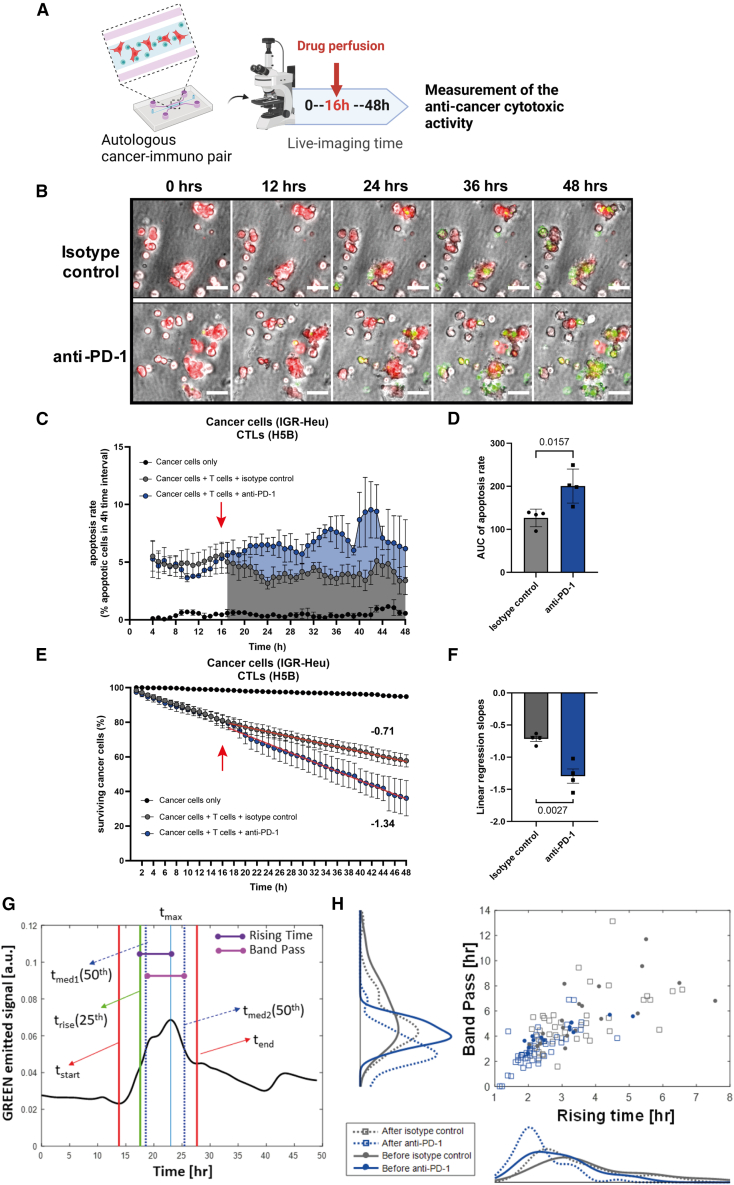
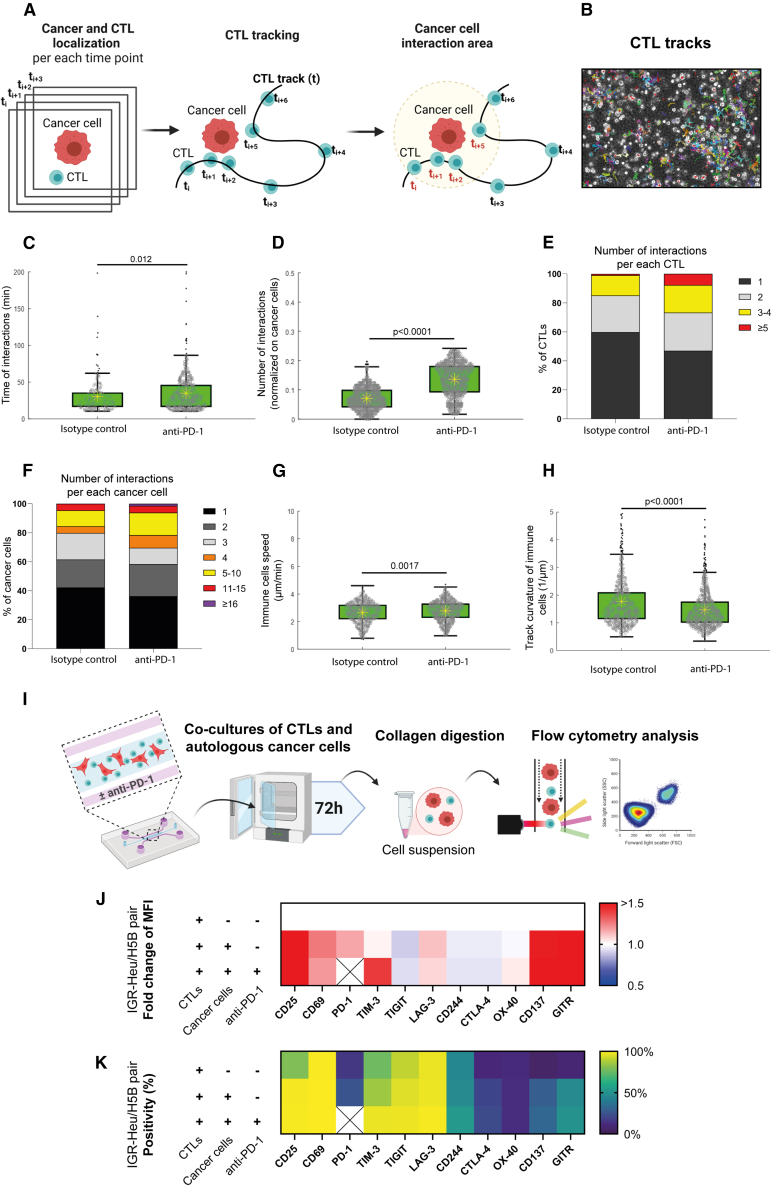
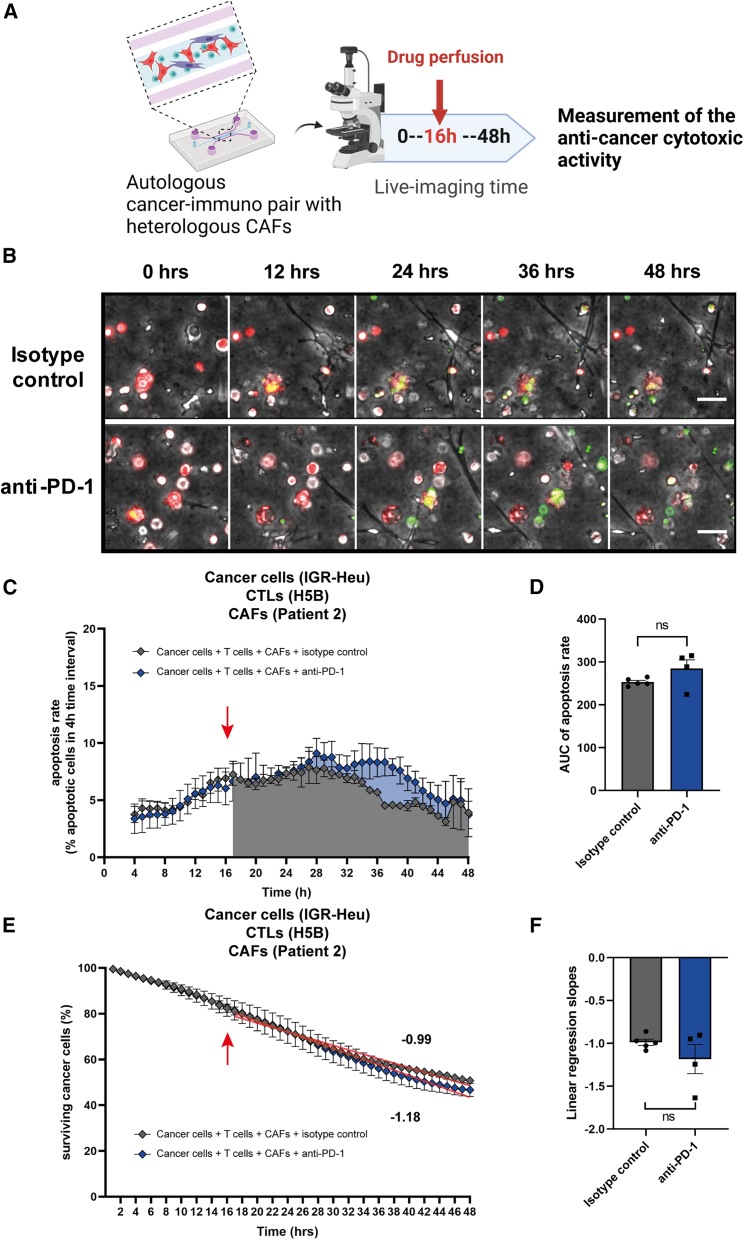
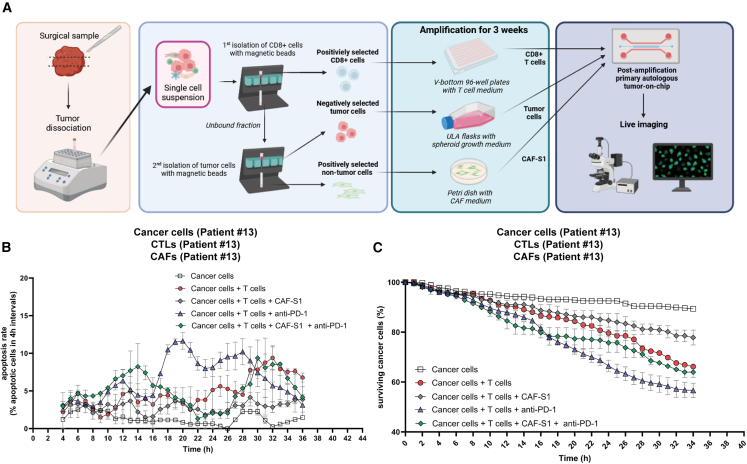
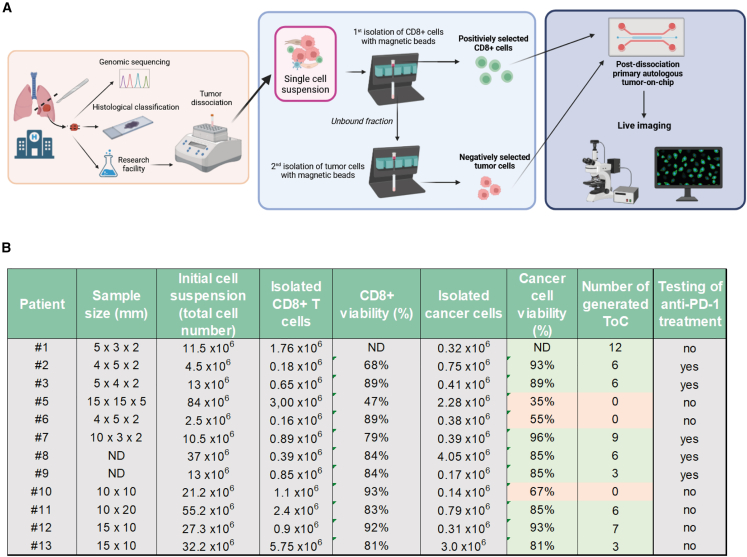
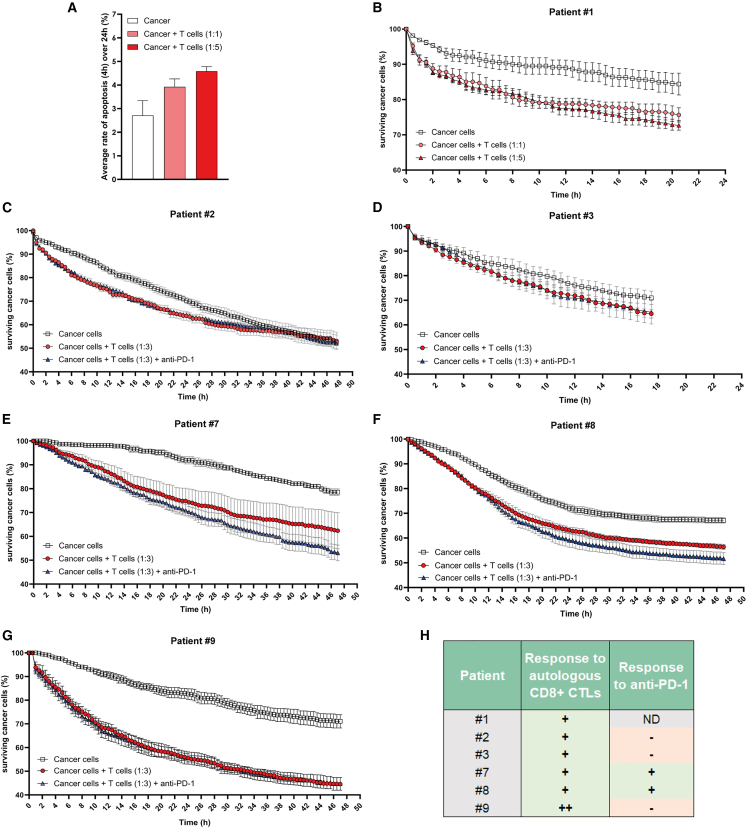
There is a compelling need for approaches to predict the efficacy of immunotherapy drugs. Tumor-on-chip technology exploits microfluidics to generate 3D cell co-cultures embedded in hydrogels that recapitulate simplified tumor ecosystems. Here, we present the development and validation of lung tumor-on-chip platforms to quickly and precisely measure ex vivo the effects of immune checkpoint inhibitors on T cell-mediated cancer cell death by exploiting the power of live imaging and advanced image analysis algorithms. The integration of autologous immunosuppressive FAP+ cancer-associated fibroblasts impaired the response to anti-PD-1, indicating that tumors-on-chips are capable of recapitulating stroma-dependent mechanisms of immunotherapy resistance. For a small cohort of non-small cell lung cancer patients, we generated personalized tumors-on-chips with their autologous primary cells isolated from fresh tumor samples, and we measured the responses to anti-PD-1 treatment. These results support the power of tumor-on-chip technology in immuno-oncology research and open a path to future clinical validations.

Keywords: anti-PD-1; cancer models; cancer-associated fibroblasts; immuno-oncology; immunotherapy; lung cancer; microfluidics; patient-derived; tumor microenvironment; tumor-on-chip.


Conflict of interest statement

Declaration of interests H.S. and I.V. are Roche employees. The STAMP method used in this work has been patented by I.V., A.M., E.M., and M.C.P.

Figures

None
Graphical abstract
Figure 1
Figure 1
Lung tumor-on-chip (ToC) platforms for personalized immunotherapy response profiling (A) Workflow for lung ToC generation and analysis. Cancer cells, T cells, and fibroblasts are isolated from the tumor and co-cultured embedded in a biomimetic collagen gel within microfluidics devices. The microfluidics setup allows us to perfuse the immunotherapy drugs into the ToC, which is live imaged by video microscopy. Automated advanced methods of image analysis are used to measure the anti-cancer cytotoxic activity and the kinematics of immune cells. (B) Representative confocal images of the reconstituted 3D lung tumor microenvironment. Autologous cancer cells (IGR-Heu) and CD8+ CTLs (H5B) are labeled in red and blue (Cell Trace), respectively. CAFs (heterologous) are labeled in green. a: top view. b: lateral view. c: magnified view. (C) Patients’ clinical data. N/D, not determined. (D) Representative immunostaining of human lung adenocarcinoma. Top: co-immunostaining of pancytokeratin (brown), highlighting tumor cells, and FAP (red), highlighting CAFs, with a magnified view on the right, used for manual counting. Bottom: CD8 immunostaining before (left) and after (right) supervised automated quantification using QuPath software (red, CD8+ T lymphocytes; blue, CD8lymphocytes and tumor cells). (E) Density of tumor cells, FAP+ CAFs, and CD8+ T cells for all patients and cell ratio calculation.
Figure 2
Figure 2
Direct visualization and quantification of ex vivo CTL-mediated anti-tumor cytotoxic activity upon anti-PD-1 treatment (A) Experimental design. Autologous 3D co-cultures at a 2:1 ratio of lung cancer cells (IGR-Heu) and CTLs (H5B) were generated in the central chamber of microfluidics devices and imaged by video microscopy for 48 h. Anti-PD-1 immunotherapy drug (nivolumab) is perfused in the lateral medium chamber after 16 h of co-culture. (B) Representative time-lapse images of co-cultures at the indicated time points, before and after the addition of control isotype antibodies (top) or of anti-PD-1 immunotherapy (bottom). Cancer cells are stained in red (Cell Trace). CTLs are not stained. A green apoptosis reporter (Cell Event) is added to the medium; cells dying by apoptosis become green. Scale bar, 50 μm. See also Video S1. (C) Quantification of the CTL-mediated anti-tumor cytotoxic activity upon anti-PD-1 treatment. The apoptosis rates of cancer cells (i.e., the percentage of cancer cells dying at 4-h time intervals) are computed using the STAMP method. The averages are computed every 1 h using a 4-h sliding window. The red arrow indicates the moment of drug injection (16 h). The graph reports means ± SEM from n = 4 independent experiments. (D) Statistical analysis of apoptosis rates. The areas under the curve from 16 h to 48 h were measured for the control and treated conditions from the 4 experiments. Unpaired Student’s t test was used. (E) Quantification of the CTL-mediated anti-tumor cytotoxic activity upon anti-PD-1 treatment. The survival curves of cancer cells (i.e., the percentage of surviving cancer cells calculated with respect to the initial number of living cells) are computed using the STAMP method. The red arrow indicates the moment of drug injection (16 h). The graph reports means ± SEM from 4 independent experiments. (F) Statistical analysis of survival curves. The linear regression slopes were measured for the control and treated conditions from the 4 experiments. Unpaired Student’s t test was used. (G) Temporal analysis of the death signal at the single-cell level. The green signal (Cell Event apoptosis reporter) of one representative dying cell is shown. By automatic signal analysis, characteristic times (tstart, tend, tmax, trise, tmed1, and tmed2) are computed. Then, the rising time and the band pass are measured. (H) Plot of the rising time and of the band pass from 4 conditions: before and after isotype control injection and before and after anti-PD-1 injection. The distribution for each condition, represented by kernel density, is also shown. n = 121 cells total. Student’s t test showed that differences are statistically significant before versus after anti-PD-1 for rising time (p = 0.01) and band pass (p = 0.026) but not before versus after isotype control.
Figure 3
Figure 3
Impact of effective anti-PD-1 treatment on the kinetics and plasticity of CTL immune cells (A) Tracking strategy. ToC videos of lung cancer cells (IGR-Heu) and autologous CTLs (H5B) were acquired with high temporal resolution (every 30 s) for 6 h. A cancer cell and an immune were considered to interact when their distance was closer than the interaction radius (here defined as 34 μm, twice the sum of the average radius of detected CTLs and cancer cells). See also Video S2. (B) Representative output of the Cell Hunter tracking algorithm. (C) Quantification of the time of interaction between cancer cells and CTLs. 669 time events with a duration longer than 10 min were counted in total. Statistical significance was assessed using Mann-Whitney test. (D) Quantification of the number of interactions between cancer cells and CTLs. The number of interactions counted for each cancer cell was normalized by the total number of cancer cell trajectories detected along the video. 2,880 interaction events were counted in total. Mann-Whitney statistical test was used. (E) Number of interactions per each immune CTL. 625 interactions in total were counted. (F) Number of interactions per each cancer cell. 382 interactions in total were counted. (G) Quantification of the speeds of immune CTLs. 1,542 speed values were counted in total. Mann-Whitney test was used. (H) Quantification of the track curvatures of immune CTLs. 1,542 curvature values were counted in total. Mann-Whitney test was used. (I) Experimental design for analysis of T cell plasticity in ToC co-cultures. CTLs were co-cultured in microfluidics devices with or without autologous cancer cells and treated with the isotype control or with anti-PD-1 (nivolumab). After 3 days, the cells were retrieved from the gel by collagenase digestion, stained, and analyzed by flow cytometry. The following markers were measured: CD25 and CD69 (activation markers); PD-1, TIM-3, TIGIT, LAG-3, CD244, and CTL-4 (inhibitory immune checkpoints); and OX-40, CD137, and GITR (activatory immune checkpoints). It was not possible to measure the PD-1 marker in the presence of anti-PD-1 treatment because of antibody competition. Three conditions were assessed: CTLs only, with cancer cells without anti-PD-1, and with cancer cells with anti-PD-1. Heatmaps report averages from 2–4 independent experiments depending on the condition. (J) Fold change of specific MFI for CTL markers of H5B cells. The specific MFI for the condition CTLs only is set as 1. (K) Percentage of positive H5B cells for CTL markers. See Figure S1 for full datasets.
Figure 4
Figure 4
CAFs promote resistance to anti-PD-1 immunotherapy in lung ToC (A) Experimental design. Tri-cultures of lung cancer cells (IGR-Heu), autologous CTLs (H5B), and heterologous lung CAFs (CAF#2), at ratios of 5:1 cancer to CAF and 2:1 cancer to immune cells, were generated in the central chamber of microfluidics devices and imaged by video microscopy for 48 h. An anti-PD-1 immunotherapy drug (nivolumab) is perfused in the lateral medium chamber after 16 h of co-culture. (B) Representative time-lapse images of tri-cultures at the indicated time points, before and after the addition of control isotype antibodies (top) or of anti-PD-1 immunotherapy (bottom). Cancer cells are stained in red (Cell Trace). CAFs and CTLs are not stained. A green apoptosis reporter (Cell Event) is added to the medium; cells dying by apoptosis become green. Scale bar, 50 μm. See also Video S3. (C) Quantification of the CTL-mediated anti-tumor cytotoxic activity upon anti-PD-1 treatment. The apoptosis rates of cancer cells (i.e., the percentage of cancer cells dying at 4-h time intervals) are computed using the STAMP method. The averages are computed every 1 h using a 4-h sliding window. The red arrow indicates the moment of drug injection (16 h). The graph reports means ± SEM from 4–5 independent experiments. (D) Statistical analysis of apoptosis rates. The areas under the curve from 16 h to 48 h were measured for the control and treated conditions from 4–5 experiments. Unpaired Student’s t test was used. (E) Quantification of the CTL-mediated anti-tumor cytotoxic activity upon anti-PD-1 treatment. The survival curves of cancer cells (i.e., the percentage of surviving cancer cells calculated with respect to the initial number of living cells) are computed using the STAMP method. The red arrow indicates the moment of drug injection (16 h). The graph reports means ± SEM from 4–5 independent experiments. (F) Statistical analysis of survival curves. The linear regression slopes were measured for the control and treated conditions from 4–5 experiments. Unpaired Student’s t test was used.
Figure 5
Figure 5
Personalization of ToCs using patient-derived cells isolated from fresh lung cancer samples (A) Strategy to generate primary autologous ToCs. Right after the surgery, the tumor sample is transferred from the hospital to the research facility and mechanically and enzymatically dissociated. Cancer cells, tumor-infiltrating CD8+ CTLs, and CAFs are isolated by MACS and amplified ex vivo before ToC generation. (B) Apoptosis rates for patient #13 post amplification. Autologous cancer cells, CD8+ CTLs, and CAF-S1 were co-cultured at ratios of 1:1 cancer to CAF and 1:1 cancer to immune cells. The anti-PD-1 drug was added at the beginning of the on-chip co-culture (t0). The graph reports means ± SEM of >200 cells from 2–3 view fields. For this specific experiment, the counting of apoptosis was done manually to precisely distinguish cancer cells from CAFs. (C) Cancer cell survival curves for patient #13 post amplification.
Figure 6
Figure 6
Efficiency of patient-derived ToC generation (A) Workflow from surgery to ToCs and live-imaging microscopy. Right after the surgery, the tumor sample is transferred from the hospital to the research facility. Autologous cancer cells and tumor-infiltrating CD8+ CTLs are isolated by MACS and immediately used to generate ToC platforms. (B) Efficiency of patient-derived cell isolation. For each patient, the tumor sample size, the number and viability of CD8+ CTLs and cancer living cells retrieved, the number of generated ToC, and the drug treatment are indicated.
Figure 7
Figure 7
Quantification of CTL-mediated anti-tumor cytotoxic activity in autologous patient-derived lung ToCs (A) Apoptotic death induced by autologous CD8+ CTLs as function of CTL density. ToC data shown correspond to patient #1 using primary cancer cells alone or co-cultured with autologous CD8+ TILs at a 1:1 or 1:5 ratio. The apoptosis rates of cancer cells were computed over 24 h using the TM-STAMP method and averaged. The graph reports mean ± SEM from 4 view fields. (B) Cancer cell survival curves for patient #1. The percentage of surviving cancer cells, calculated with respect to the initial number of living cells, was computed using the TM-STAMP method. The anti-PD-1 drug was added at the beginning of the on-chip co-culture (t0). The graph reports means ± SEM from 4 view fields. (C) Cancer cell survival curves for patient #2 (1:3 cancer to immune cell ratio). (D) Cancer cell survival curves for patient #3. (E) Cancer cell survival curves for patient #7. (F) Cancer cell survival curves for patient #8. (G) Cancer cell survival curves for patient #9. (H) Summary of observed responses in all patients.

References

    1. Mestas J., Hughes C.C.W. Of mice and not men: differences between mouse and human immunology. J. Immunol. 2004;172:2731–2738. doi: 10.4049/jimmunol.172.5.2731. - DOI - PubMed
    1. Sung K.E., Beebe D.J. Microfluidic 3D models of cancer. Adv. Drug Deliv. Rev. 2014;79–80:68–78. doi: 10.1016/j.addr.2014.07.002. - DOI - PMC - PubMed
    1. Boussommier-Calleja A., Li R., Chen M.B., Wong S.C., Kamm R.D. Microfluidics: A new tool for modeling cancer-immune interactions. Trends Cancer. 2016;2:6–19. doi: 10.1016/j.trecan.2015.12.003. - DOI - PMC - PubMed
    1. Sontheimer-Phelps A., Hassell B.A., Ingber D.E. Modelling cancer in microfluidic human organs-on-chips. Nat. Rev. Cancer. 2019;19:65–81. doi: 10.1038/s41568-018-0104-6. - DOI - PubMed
    1. Bouquerel C., Dubrova A., Hofer I., Phan D.T.T., Bernheim M., Ladaigue S., Cavaniol C., Maddalo D., Cabel L., Mechta-Grigoriou F., et al. Bridging the gap between tumor-on-chip and clinics: a systematic review of 15 years of studies. Lab Chip. 2023;23:3906–3935. doi: 10.1039/d3lc00531c. - DOI - PubMed

MeSH terms

Substances