. 2024 May 4;15(1):3764.
doi: 10.1038/s41467-024-48106-6.

Diet-omics in the Study of Urban and Rural Crohn disease Evolution (SOURCE) cohort

Affiliations

Diet-omics in the Study of Urban and Rural Crohn disease Evolution (SOURCE) cohort

Tzipi Braun et al. Nat Commun. .

Abstract

Crohn disease (CD) burden has increased with globalization/urbanization, and the rapid rise is attributed to environmental changes rather than genetic drift. The Study Of Urban and Rural CD Evolution (SOURCE, n = 380) has considered diet-omics domains simultaneously to detect complex interactions and identify potential beneficial and pathogenic factors linked with rural-urban transition and CD. We characterize exposures, diet, ileal transcriptomics, metabolomics, and microbiome in newly diagnosed CD patients and controls in rural and urban China and Israel. We show that time spent by rural residents in urban environments is linked with changes in gut microbial composition and metabolomics, which mirror those seen in CD. Ileal transcriptomics highlights personal metabolic and immune gene expression modules, that are directly linked to potential protective dietary exposures (coffee, manganese, vitamin D), fecal metabolites, and the microbiome. Bacteria-associated metabolites are primarily linked with host immune modules, whereas diet-linked metabolites are associated with host epithelial metabolic functions.


Conflict of interest statement

The following authors have no conflict of interest: T.B., R.F., A.A., N.L., H.S., R.M., R.H., I.T., Y.A., K.A.S., S.Z., G.E., A.M., O.P., M.Y., B.A., T.S.S., L.D., O.K.L., E.G., E.B., M.C., S.B.H. and Y.H. The following authors report conflict of interest: E.E. is a scientific cofounder of DayTwo and BiomX, and an advisor to Hello Inside, Igen, Purposebio and Aposense, an editorial board member of CHM. T.C.L. is an advisor to and receives research contracts from Denali Therapeutics and Interline Therapeutics.

Figures

Fig. 1
Fig. 1. Diet-omics SOURCE cohort demographics, sampling, and dietary and environmental exposures.
The SOURCE cohort included 380 participants. In China, 40 newly-diagnosed Crohn disease (CD) patients and 121 healthy residents of Guangzhou (urban Ctl) and 162 healthy residents of Shaoguan district (all rural controls), a rural underdeveloped community 300 km north of Guangzhou. In Israel, 25 newly-diagnosed pre-treatment CD patients and 32 healthy controls. a Scheme (BioRender) illustrating SOURCE demographics, sampling, and metadata including exposures. b Cohort figure showing Israel and China data types and availability colored as indicated. Each row represents a subject. c Mosaic plots showing exposure rates between the different groups in China, and Israel. Full data in Supplementary Dataset 1. Two-sided *p < 0.05, **p < 0.01, ***p < 0.001, chi-square tests test. IOIBD Q International Organization of IBD questionnaire, FFQ food frequency questionnaire, MGX metagenomics, TI terminal ileum, Ctl controls.
Fig. 2
Fig. 2. Gut microbial and metabolites are affected by time spent by rural residents in urban environments in China.
a Unweighted UniFrac PCoA plot of 182 rural Chinese 16S microbiome fecal samples, colored by “rural” (n = 88) and “rural-urban” (n = 74) that spends more than half of their time in urban environments. Histograms show the distribution per group on PC1/2. Unweighted unifrac distances (b, beta diversity, permanova p = 0.002), Faith’s phylogenetic alpha diversity (c, Mann–Whitney p = 0.004), and our previously defined health index (d, Mann–Whitney p = 0.09) between rural (n = 88) and rural-urban (n = 74). e Heatmap showing ASVs with significant differential abundance between rural and urban samples (dsFDR < 0.1), using an independent cohort (BioProject PRJNA349463) from Hunan province in Southern China. Each row represents ASV and each column is a different sample. ASVs are ordered by the effect size. Those taxa were used to generate a “rural index” applied to our cohort. f Violin plot of rural index between rural and rural-urban (Mann–Whitney p = 0.0001) and Crohn Disease (CD, n = 40) and urban (right, n = 121, Mann–Whitney p = 0.0007). g Volcano plots of significantly different (FDR ≤ 0.1) taxa between rural (n = 88) and rural-urban (n = 74), using a maaslin2 controlling for age and gender (full list in Supplementary Dataset 3). h Boxplot showing the relative abundance of significant taxa from (g). i Canberra distance PCoA plot of 40 rural and rural-urban Chinese fecal metabolites samples colored by group, showing significant separation on PC2. j Boxplot showing the relative abundance of 22 significantly different (FDR ≤ 0.25, *indicates FDR ≤ 0.1) metabolites between rural and rural-urban samples, using a maaslin2 analysis controlling for age and gender (left, n = 40). We indicated the relative abundance in the CD and urban control groups (n = 79) (Supplementary Dataset 3). k Scatter plots of maaslin2 analysis coefficients, indicating that 20 of the 22 metabolites shown in (j) were also similarly significantly different in CD vs. urban controls with similar directionality (red: 8 metabolites higher in rural-urban and CD, blue: 10 higher in rural and urban controls, gray; 2 higher only in rural vs rural-urban). Two-sided *p < 0.05, **p < 0.01, ***p < 0.001. Boxplot center line and limit; median, upper and lower quartiles; whiskers, 1.5x interquartile range. The Violon plot center line represents the median and the kernel density estimation is in blue.
Fig. 3
Fig. 3. Exposures and diet are linked with microbial variations.
a PCA figure based on food frequency questionnaire (FFQ) data and showing variations of the different groups in China (28 FFQ features, sample n = 308). Colors indicate the specific groups. Histograms show the distribution of samples and groups on PC1 and PC2. (right). FFQ components were correlated to the PCAs PC1 (x axis) and PC2 (y axis) values (left). Spearman’s rho values are shown as the head of the arrow for the top 10 FFQ components with the highest PC1 or PC2 rho values. b Same as (a) for the Israeli cohort (62 FFQ feature, sample n = 47). c PERMANOVA analysis of 16S microbial variance explained by FFQ and questionnaire data, using each group and sub-cohort separately (n is shown in brackets). x indicates two-sided p ≤ 0.1, * indicates two-sided p ≤ 0.05. Only variables that were significant in at least two groups are shown here (full list in Supplementary Dataset 4). d Venn plots showing the overlap between the taxa decreased in fat and iron, and the taxa increased with fat and iron from Supplementary Fig. 3a. d dbBact term associations for the fat/iron associated ASVs. e Number of ASVs observed (in dbBact experiments) to be associated with saliva or lower abundance in Crohn Disease (CD, right and left subpanels respectively). Red circles show the set of ASVs positively correlated with iron and/or fat consumption, and green circles show the ASVs negatively correlated with iron and/or fat. Gray circles show the total number of dbBact ASVs associated with the term, with overlaps showing the subset of ASVs from each group that is associated with the term. 47/48 of negatively correlated ASVs have been associated at least once with decreased frequency in CD, compared to 10/19 in the positively correlated ASVs (Two-sided p = 3E−6, chi-square test). Similarly, 9/48 negatively associated ASVs compared to 10/19 positively associated ASVs have been observed in dbBact saliva samples (Two-sided p = 0.005, chi-square test). MUFA monounsaturated fatty acid, PUFA polyunsaturated fatty acid.
Fig. 4
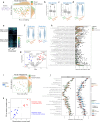
Fig. 4. Specific dietary factors and metabolites show correlations with Crohn disease (CD) ileal mucosal transcriptomics signals.
WGCNA co-expression modules based on the Israel ileal (n = 41) and applied to the China transcriptomics (n = 40). Modules that were correlated with Crohn disease (CD) (p ≤ 0.05) in either Israel or China are shown. a 4 modules showed reduced and 5 were induced in CD. For each module, representative genes and enriched cells/pathways are marked. Heatmap represents the correlation between each module and different features; numbers represent the correlation p value, and color the coefficient for each comparison. b ToppFun functional annotation enrichment of genes within each module. FDR is shown as the circle size; manually selected annotations origin database is marked on the y-axis (full list in Supplementary Dataset 6). c Heatmap of the correlations between each module and dietary factors, with numbers representing the correlation p value and color for the coefficient. Only factors with p ≤ 0.05 (two-sided) in at least one module are shown, and correlations with Benjamini–Hochberg FDR ≤ 0.25 are marked with a black square. d Heatmap of the correlation between each module and stool metabolites, colored by correlation coefficient. Only metabolites with Benjamini–Hochberg FDR ≤ 0.25 in at least one module are shown, and those significant correlations (two-sided p < 0.05 and FDR ≤ 0.1, or p < 0.1 and FDR ≤ 0.25) are marked with black and gray dots respectively. e Bar graph showing the number of metabolites significantly correlated with each of the modules, separated by CD- or control-associated correlations defined by the direction of the metabolite-module correlation and the direction of the module compared to disease. The colors represent the metabolites class based on Human Metabolome Database (HMDB). f Heatmap of the correlation between each module and the 32 stool metabolites (of 91 common metabolites in the SYS and Sheba datasets) that showed significant correlation in the same direction with CD in Israel and China, colored by correlation coefficient (detailed heatmap in Supplementary Fig. 5c, full list in Supplementary Dataset 7). Metabolite’s direction is defined as the direction of the strongest correlation between all the modules. MUFA monounsaturated fatty acid, PUFA polyunsaturated fatty acid, ECM extracellular matrix.
Fig. 5
Fig. 5. Host epithelial-linked metabolites were associated with diet while host immune-linked metabolites were correlated with the microbiome.
The correlations between metabolites associated with each ileal transcriptomics module in the Israeli subcohort (n = 41) were tested against FFQ and microbiome data separately using HAllA (Hierarchical All-against-All Association Testing) with p < 0.05, FDR ≤ 0.25. a Bar plot of the number of significant correlations between metabolites associated with the different modules and food frequency questionnaire (FFQ, n = 33), 16S taxonomy (n = 36), and metagenomics (MGX) taxonomy (n = 37). Full lists in Supplementary Dataset 8. b Sankey figure shows significant correlations between pink module-associated metabolites and FFQ. On the right are scatterplots of 3 example metabolites and FFQ components. c Sankey figure of up to top 50 significant correlations for control-associated metabolites (blue) and disease-associated metabolites (red), for metabolites associated with black (left), brown (middle), and salmon (right) modules, and MGX taxonomy. Only positive correlations are shown. d Scatter plots of example metabolites and MGX species correlations. e, f Pairwise sparse Partial Least Squares (sPLS) regression between fecal metabolomics, host transcriptomics WGCNA modules, FFQ, MGX taxonomic, and functional profiles (pathway and ECs). Spearman correlation between the first sPLS components the defined two omics (e) and p values calculated based on shuffled data (f) are shown. Pairs with two-sided p < 0.1 are marked with an asterisk. g Ordination DIABLO analysis according to omics (shape) and disease state (Crohn—red; healthy—blue). Each sample is described by 4 omics, FFQ components, metabolomics, metagenomics, and host transcriptomics PC1. Sample centroids are plotted in bold solid dots and connected by a line to all omics measurements. h Correlation circle plot for the DIABLO analysis, where each point represents a molecular feature. The point position is defined according to its correlation with the first and second components. Only MGX taxonomy is included as the MGX EC and pathway profiles were highly correlated with the taxonomy profiles. An interactive version of this plot can be found in the Supplementary Information in Supplementary Dataset 8 and 9. CD Crohn disease, ECM extracellular matrix, MGX metagenomics, TI terminal ileum, ECs enzymes classes.

References

    1. Kaplan GG, Ng SC. Understanding and preventing the global increase of inflammatory bowel disease. Gastroenterology. 2017;152:313–321.e12. doi: 10.1053/j.gastro.2016.10.020. - DOI - PubMed
    1. Belkaid Y, Hand TW. Role of the microbiota in immunity and inflammation. Cell. 2014;157:121–141. doi: 10.1016/j.cell.2014.03.011. - DOI - PMC - PubMed
    1. Singh, S. Positioning therapies for the management of inflammatory bowel disease. Nat. Rev. Gastroenterol. Hepatol.20, 411–412 (2023). - PubMed
    1. Qiu Y, et al. Disease burden of inflammatory bowel disease in China from 1990 to 2017: findings from the global burden of diseases 2017. EClinicalMedicine. 2020;27:100544. doi: 10.1016/j.eclinm.2020.100544. - DOI - PMC - PubMed
    1. Winglee K, et al. Recent urbanization in China is correlated with a Westernized microbiome encoding increased virulence and antibiotic resistance genes. Microbiome. 2017;5:121. doi: 10.1186/s40168-017-0338-7. - DOI - PMC - PubMed

Publication types