. 2024 May 4;10(1):217.
doi: 10.1038/s41420-024-01976-7.

Targeting senescent cells with NKG2D-CAR T cells

Affiliations

Targeting senescent cells with NKG2D-CAR T cells

Yushuang Deng et al. Cell Death Discov. .

Abstract

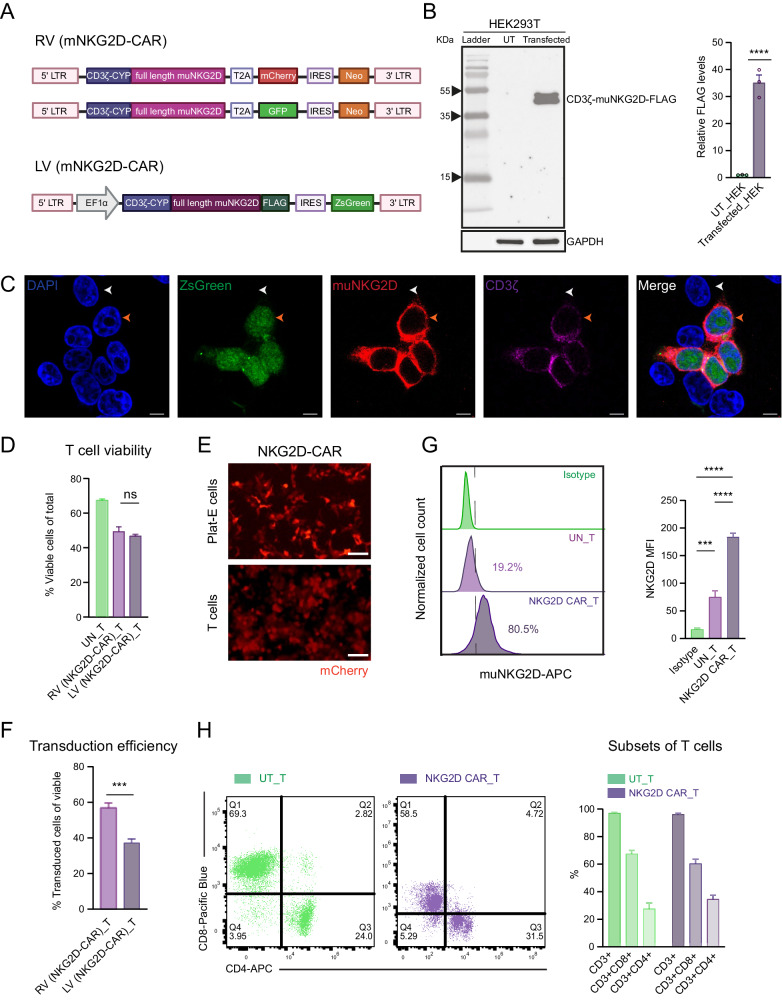
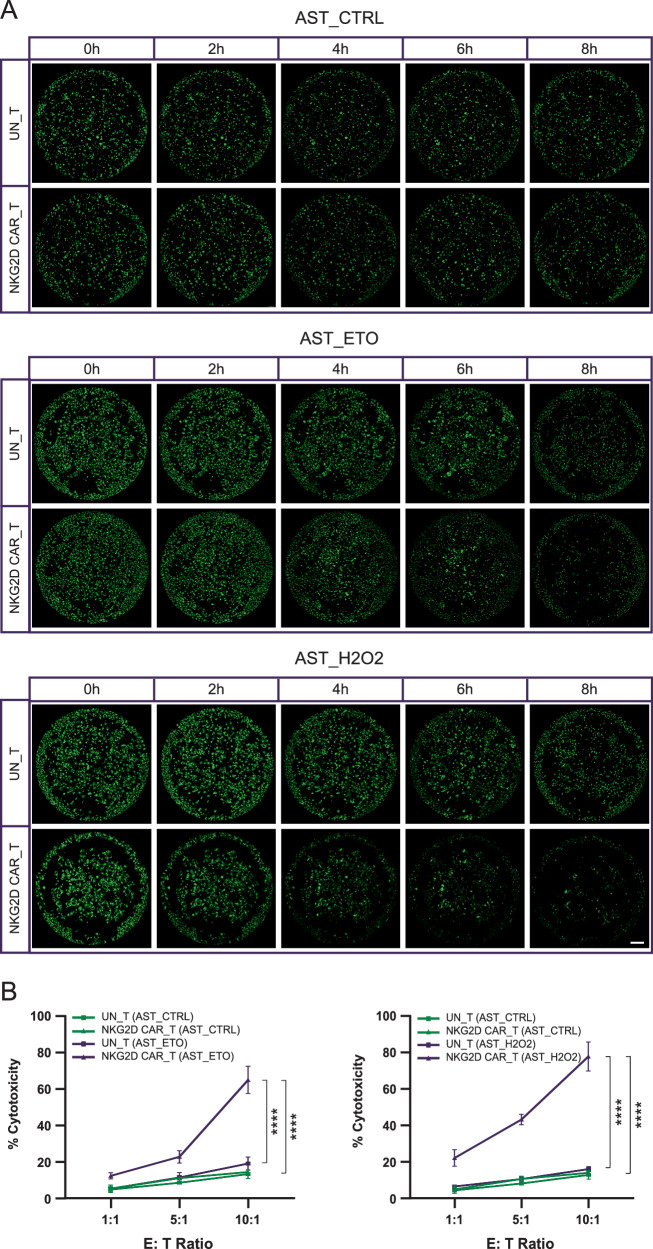
This study investigates the efficacy of NKG2D chimeric antigen receptor (CAR) engineered T cells in targeting and eliminating stress-induced senescent cells in vitro. Cellular senescence contributes to age-related tissue decline and is characterized by permanent cell cycle arrest and the senescence-associated secretory phenotype (SASP). Immunotherapy, particularly CAR-T cell therapy, emerges as a promising approach to selectively eliminate senescent cells. Our focus is on the NKG2D receptor, which binds to ligands (NKG2DLs) upregulated in senescent cells, offering a target for CAR-T cells. Using mouse embryonic fibroblasts (MEFs) and astrocytes (AST) as senescence models, we demonstrate the elevated expression of NKG2DLs in response to genotoxic and oxidative stress. NKG2D-CAR T cells displayed potent cytotoxicity against these senescent cells, with minimal effects on non-senescent cells, suggesting their potential as targeted senolytics. In conclusion, our research presents the first evidence of NKG2D-CAR T cells' ability to target senescent brain cells, offering a novel approach to manage senescence-associated diseases. The findings pave the way for future investigations into the therapeutic applicability of NKG2D-targeting CAR-T cells in naturally aged organisms and models of aging-associated brain diseases in vivo.


Conflict of interest statement

The authors declare no competing interests.

Figures

Fig. 1
Fig. 1. Construction of NKG2D‑based CAR‑T cells.
A Schematic representation of retroviral (RV) and lentiviral (LV) NKG2D-CAR constructs encoding full-length mouse NKG2D receptor and cytoplasmic CD3ζ. B Western blot analysis of protein expression of FLAG-tagged NKG2D-CAR using anti-FLAG antibody in LV NKG2D-CAR construct-transfected and untransfected (UT) HEK293T cells. Data are presented as the mean ± SEM of three biological replicates; normalized to GAPDH protein level. ****P < 0.0001, determined by unpaired two-tailed Student’s t-test analysis. C Immunofluorescence co-staining of LV NKG2D-CAR construct-transfected HEK293T cells. Cells were co-stained with mouse NKG2D (red) and CD3ζ (purple) antibodies. Cell nuclei were stained with DAPI (blue). Orange and white arrows point to examples of NKG2D-CAR+ and NKG2D-CAR- cells, respectively. Scale bar = 10 μm. Cell viabilities (D) and transduction efficiencies (F) of RV and LV NKG2D-CAR-transduced T cells labelled with cell viability dye, analyzed by FACS, three to 4 days post-second round of transduction. The transduction efficiency was calculated as % mCherry/GFP/ZsGreen+ cells among viable cells. Data are presented as the mean ± SEM of six biological replicates. ns not significant, determined by one-way ANOVA followed by Tukey’s post-hoc tests. E Fluorescence microscopy images of packaging Plat-E cells (upper row) and T cells transduced with RV NKG2D-CAR 24 h post-second round of transduction (lower row). Scale bar = 200 μm. G Surface expression of NKG2D assessed by FACS. Histograms show the percentage of positive cells stained with APC-conjugated anti-mouse NKG2D antibody (purple) or isotype antibody (green). MFI of APC are presented as the mean ± SEM of six biological replicates. ***P < 0.001; ****P < 0.0001, determined by one-way ANOVA followed by Tukey’s post-hoc tests. H CD8 and CD4 subtypes of CD3 + UN-T cells and NKG2D-CAR T cells analyzed by FACS. NKG2D-CAR T cells were sorted by viable GFP+ or mCherry+ cells prior to analysis. Data are presented as the mean ± SEM of two biological replicates and determined by two-way ANOVA followed by Tukey’s post-hoc tests.
Fig. 2
Fig. 2. Functional validation of NKG2D-CAR T cells.
A Schematic representation of PiggyBac construct encoding individual mouse NKG2DLs. B The surface expression of each mouse NKG2DL determined by FACS. Flow plots (upper panel) and histograms (lower panel) show the percentage of positive cells and MFI of PE-labeled mouse NKG2DL in UT-B16F10 cells (control) and NKG2DLs stably transfected B16F10 cells. The results are based on four independent technical experiments for each transfected cell colony. FSC-A, Forward-scatter area. C Schematic of Calcein-AM-based cytotoxicity assay. D Representative whole-well images of NKG2DL-transfected and UT-B16F10 target cells stained with Calcein-AM before (0 h) and after 4 h of co-culture with NKG2D-CAR T cells or UN-T cells at an E: T ratio of 20:1. Live cells labeled by Calcein-AM are shown in green. Scale bar = 800 μm. E Quantification of cytotoxicity of NKG2D-CAR T cells and UN-T cells against NKG2DLs over-expressing B16F10 cells and B16F10 control target cells at E: T ratios of 1:1, 10:1, and 20:1 after 4 h of co-culture. Data are presented as the mean ± SD of three biological replicates. **P < 0.01; ***P < 0.001; ****P < 0.0001, determined by two-way ANOVA followed by Tukey’s post-hoc tests. BF, B16F10.
Fig. 3
Fig. 3. NKG2D ligands are expressed in senescent cells induced by DNA damage and oxidative stress.
A Representative images of SA-β-gal staining of MEFs (upper panel) and AST (lower panel) treated with or without ETO or H2O2 visualized under bright-field microscopy. Blue cells indicate SA-β-gal positive cells. Scale bar = 100 μm. Quantification of % SA-β-gal positive cells was performed in randomly selected view fields. Data are presented as the mean ± SEM of six biological replicates. B Western blot analysis (left panel) and quantification (right panel) of protein expression of senescence markers in MEFs and AST with or without ETO or H2O2 treatment. The band intensity of a given target protein was normalized to the corresponding actin signal for each sample. Data were normalized to the average of the corresponding control group and are presented as the mean ± SEM, based on n = 4 biological replicates. Statistical significance was assessed using one-way ANOVA followed by Tukey’s post-hoc tests, where appropriate, to compare each senescence marker within a specific cell type across various conditions (control and treatments). C qPCR analysis of mRNA expression of mouse NKG2DLs in senescent MEFs and AST induced by ETO or H2O2 treatment. Data are presented as the mean ± SEM of three or four biological replicates; normalized to β-actin mRNA level. D Cell surface expression of each mouse NKG2DL in senescent MEFs and AST (filled purple) compared to the corresponding proliferative control cells (green lines) determined by FACS. MFI of PE-labeled mouse NKG2DLs are presented as mean ± SEM of three biological replicates. *P < 0.05; **P < 0.01; ***P < 0.001; ****P < 0.0001, determined by one-way ANOVA followed by Tukey’s post-hoc tests (AD).
Fig. 4
Fig. 4. Cytotoxicity of NKG2D-CAR T cells against stress-induced senescent MEFs.
A Representative whole-well images of senescent MEFs induced by ETO or H2O2 treatment and untreated proliferative MEFs, stained with Calcein-AM, captured every 2 h during the 8 h of co-culture with NKG2D-CAR T cells or UN-T cells at an E: T ratio of 10:1. Live cells were labeled by Calcein-AM in green. Scale bar = 800 μm. B Quantification of cytotoxicity of NKG2D-CAR T cells and UN-T cells against senescent MEFs and proliferative MEFs at E: T ratios of 1:1, 5:1, and 10:1 after 8 h of co-culture. Data are presented as the mean ± SD of four biological replicates. ***P < 0.001; ****P < 0.0001, determined by two-way ANOVA followed by Tukey’s post-hoc tests.
Fig. 5
Fig. 5. Cytotoxicity of NKG2D-CAR T cells against stress-induced senescent mouse AST.
A Representative whole-well images of senescent AST induced by ETO or H2O2 treatment and untreated proliferative AST, stained with Calcein-AM, captured every 2 h during the 8 h of co-culture with NKG2D-CAR T cells or UN-T cells at an E: T ratio of 10:1. Scale bar = 800 μm. B Quantification of cytotoxicity of NKG2D-CAR T cells and UN-T cells against senescent AST and proliferative AST at E: T ratios of 1:1, 5:1, and 10:1 after 8 h of co-culture. Data are presented as the mean ± SD of four biological replicates. ****P < 0.0001, determined by two-way ANOVA followed by Tukey’s post-hoc tests.
Fig. 6
Fig. 6. Selective elimination of NKG2DLs-expressing senescent MEFs and mouse AST by NKG2D-CAR T cells.
NKG2D-CAR consists of an antigen recognition domain-NKG2D receptor fused to a CD3ζ cytoplasmic signaling domain. T cells are engineered with NKG2D-CAR-encoding retroviral or lentiviral vectors. Genotoxic insults and oxidative stress induce surface expression of NKG2DLs on MEFs and AST. Activated NKG2D-CAR T cells specifically recognize NKG2DLs expressed on the surface of senescent MEFs and AST, subsequently exerting cytotoxic effects on the target cells. SEN senescence.

References

    1. Hayflick L, Moorhead PS. The serial cultivation of human diploid cell strains. Exp Cell Res. 1961;25:585–621. doi: 10.1016/0014-4827(61)90192-6. - DOI - PubMed
    1. Kuilman T, Michaloglou C, Mooi WJ, Peeper DS. The essence of senescence. Genes Dev. 2010;24:2463–79. doi: 10.1101/gad.1971610. - DOI - PMC - PubMed
    1. Wiley CD, Campisi J. The metabolic roots of senescence: mechanisms and opportunities for intervention. Nat Metab. 2021;3:1290–301. doi: 10.1038/s42255-021-00483-8. - DOI - PMC - PubMed
    1. López-Otín C, Blasco MA, Partridge L, Serrano M, Kroemer G. Hallmarks of aging: an expanding universe. Cell. 2023;186:243–78. doi: 10.1016/j.cell.2022.11.001. - DOI - PubMed
    1. Coppé JP, Desprez PY, Krtolica A, Campisi J. The senescence-associated secretory phenotype: the dark side of tumor suppression. Annu Rev Pathol. 2010;5:99–118. doi: 10.1146/annurev-pathol-121808-102144. - DOI - PMC - PubMed