. 2024 May 4;15(1):3771.
doi: 10.1038/s41467-024-48144-0.

Mutation characteristics and molecular evolution of ovarian metastasis from gastric cancer and potential biomarkers for paclitaxel treatment

Affiliations

Mutation characteristics and molecular evolution of ovarian metastasis from gastric cancer and potential biomarkers for paclitaxel treatment

Pengfei Yu et al. Nat Commun. .

Abstract

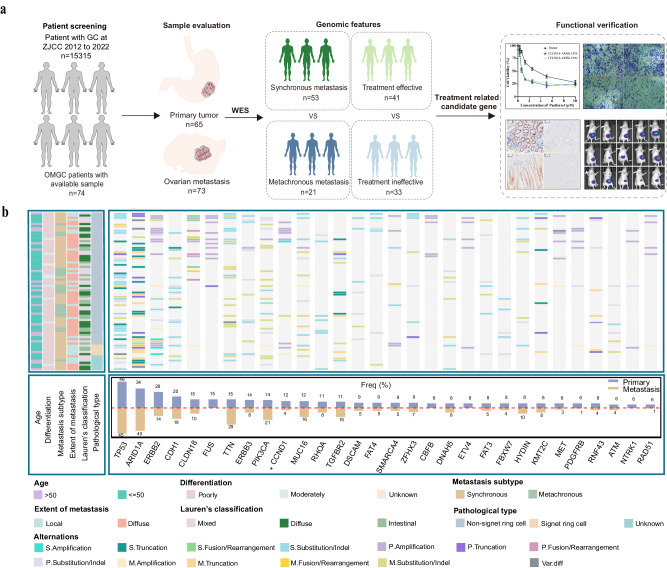
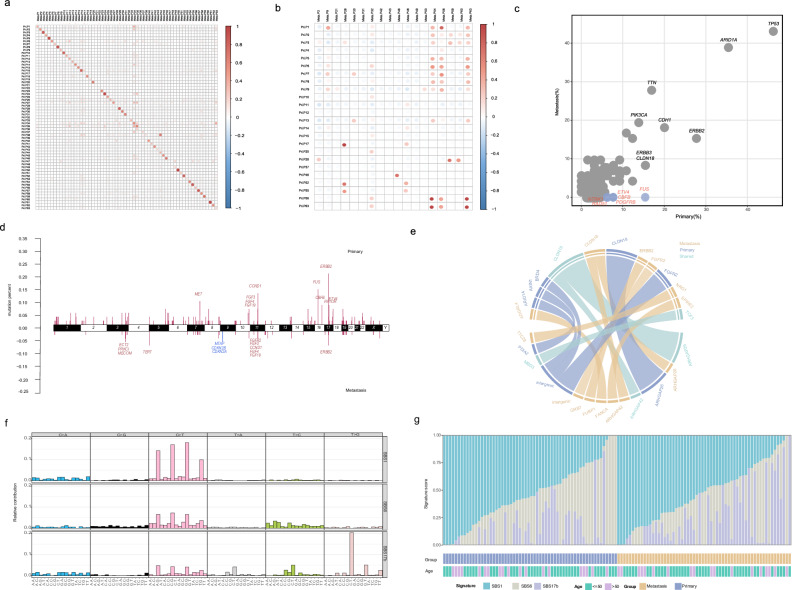
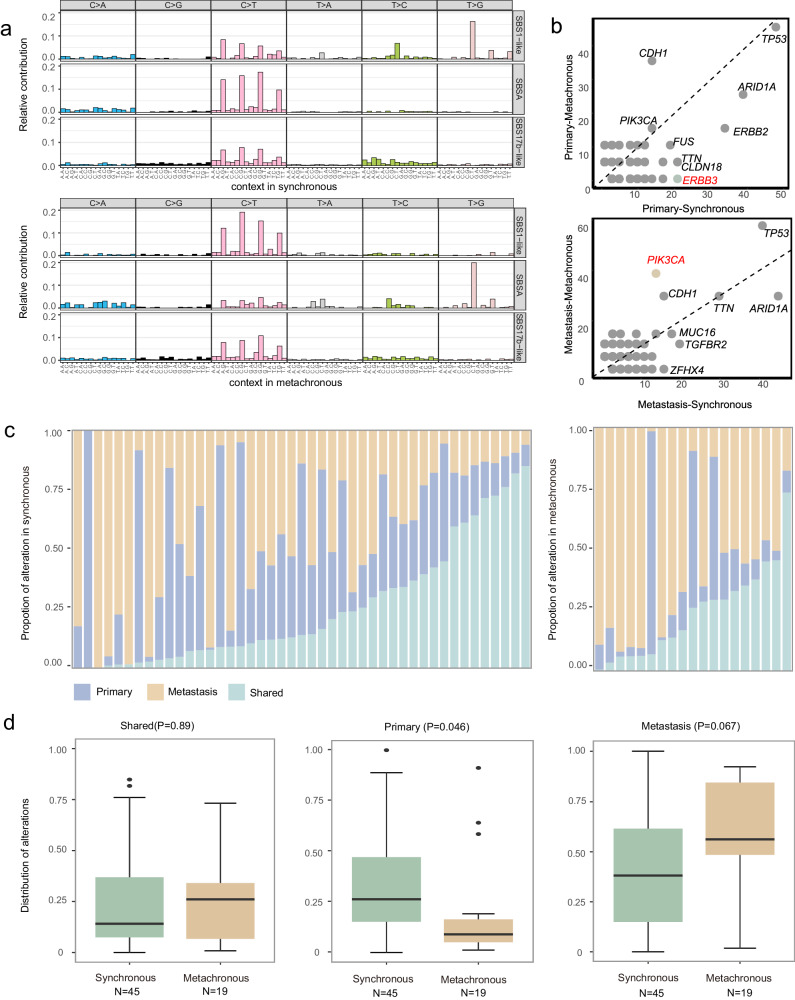
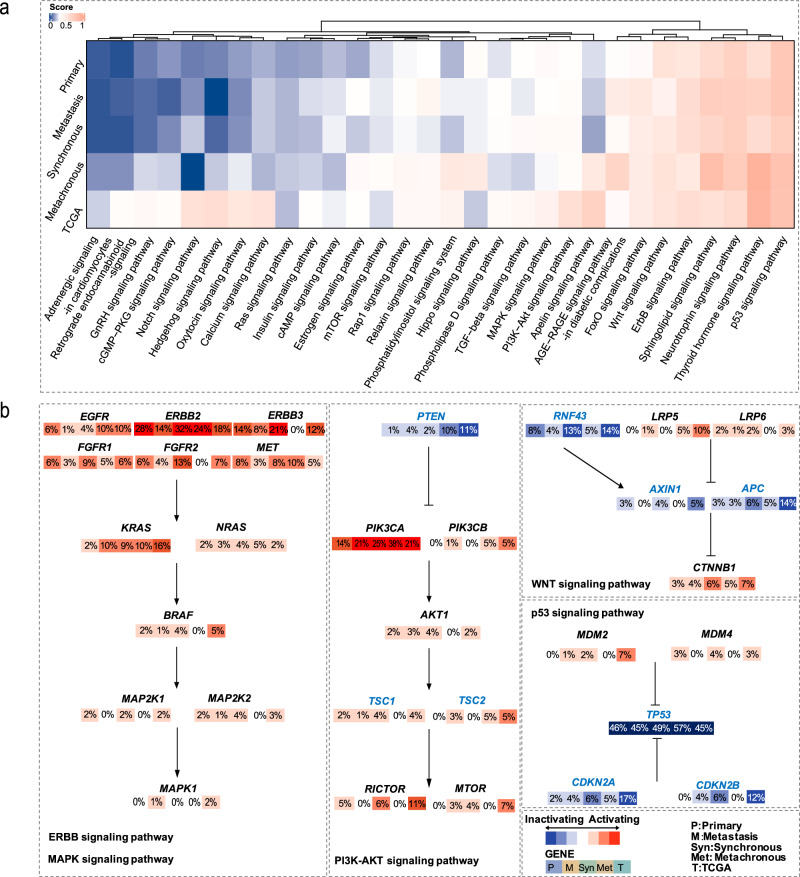
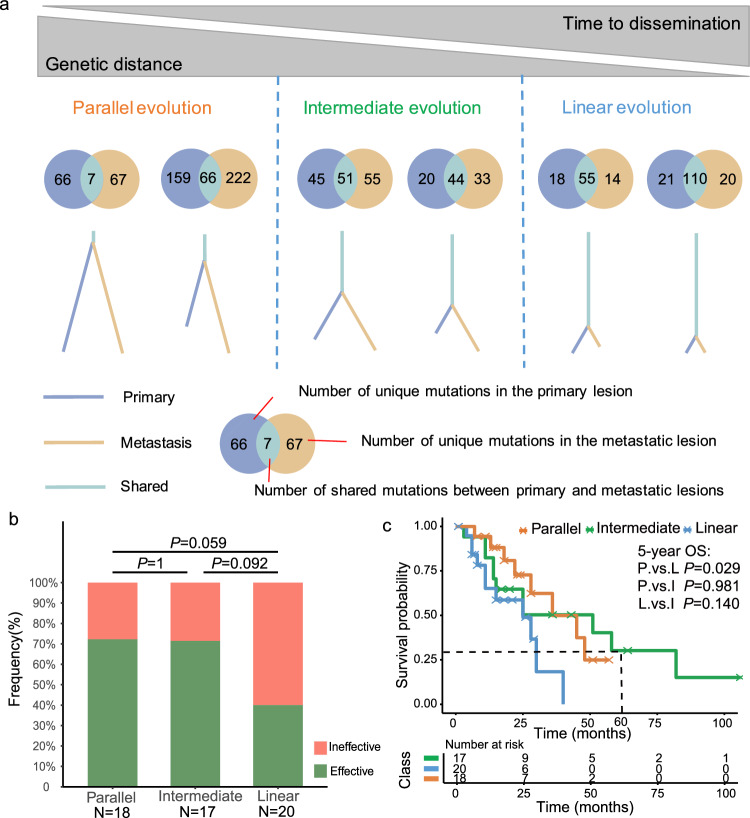
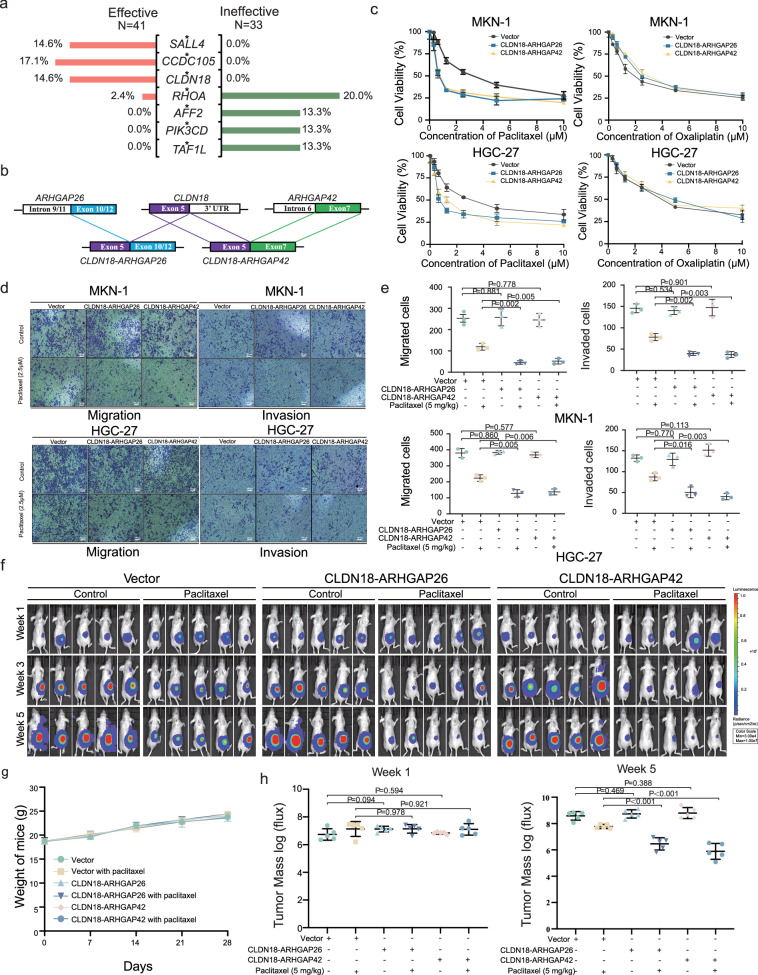
Ovarian metastasis is one of the major causes of treatment failure in patients with gastric cancer (GC). However, the genomic characteristics of ovarian metastasis in GC remain poorly understood. In this study, we enroll 74 GC patients with ovarian metastasis, with 64 having matched primary and metastatic samples. Here, we show a characterization of the mutation landscape of this disease, alongside an investigation into the molecular heterogeneity and pathway mutation enrichments between synchronous and metachronous metastasis. We classify patients into distinct clonal evolution patterns based on the distribution of mutations in paired samples. Notably, the parallel evolution group exhibits the most favorable prognosis. Additionally, by analyzing the differential response to chemotherapy, we identify potential biomarkers, including SALL4, CCDC105, and CLDN18, for predicting the efficacy of paclitaxel treatment. Furthermore, we validate that CLDN18 fusion mutations improve tumor response to paclitaxel treatment in GC with ovarian metastasis in vitro and vivo.


Conflict of interest statement

The authors declare no competing interests.

Figures

Fig. 1
Fig. 1. Study protocol flow chart and mutational landscape of our cohort.
a Study protocol flow chart. From a cohort of 74 patients with ovarian metastases from GC, 65 primary tumor samples and 73 metastatic lesion samples were obtained. Analyses were conducted to investigate the correlation between gene characteristics and synchronous or metachronous metastasis groups, as well as the therapeutic efficacy of paclitaxel treatment. Furthermore, immunohistochemistry and in vitro and vivo functional studies validation were performed to assess the expression and functional relevance of potential gene biomarkers associated with treatment response. ZJCC, Zhejiang Cancer Center. OMGC, ovarian metastases from gastric cancer. b The mutational landscape of primary GC and metastatic ovarian cancer. The middle panel shows somatic gene alterations by patient (row) and by gene (column) (The prefix S means shared alterations, the prefix M means alterations only in metastasis, and the prefix P means alterations only in primary). The histogram on the bottom shows the number of alterations accumulated on top 30 listed genes in each individual sample. The trajectory on the left displays histopathological features, such as age, differentiation, pathological type, metastasis subtype, extent of metastasis and Lauren’s classification. Freq, frequency. S., same. P. primary. M., metastasis. Var.diff, the variation is different between primary and metastatic lesions.
Fig. 2
Fig. 2. Comparison of mutation characteristics between primary and metastatic lesions in patients with ovarian metastasis of gastric cancer.
a A pearson’s correlation analysis of individual SNVs in primary gastric and metastatic ovarian lesions. Pri, primary. Meta, metastasis. b A pearson’s correlation analysis of individual CNVs in primary gastric and metastatic ovarian lesions. Pri, primary. Meta, metastasis. c The comparison of alterations in primary and metastatic ovarian lesions. Chi-squared test (χ²) and Fisher’s exact test were used in the comparison. d Comparison of chromosome distribution of CNVs in primary gastric and metastatic ovarian lesions. The upper half (primary) represents the CNV distribution in primary gastric lesions and the lower half (metastasis) represents the CNV distribution in metastatic ovarian lesions. Chi-squared test (χ²) and Fisher’s exact test were used in the comparison. e A comparison of fusion events in primary gastric and metastatic ovarian lesions. Blue indicates specific fusions in primary lesions, orange indicates specific fusions in metastatic lesions, and cyan indicates shared fusions. f Ninety-six substitutions were derived from WES data obtained from 64 pairs of primary gastric and metastasis ovarian tumor samples. The horizontal axis represents the mutation patterns for 96 substitutions using different colors. The vertical axis depicts estimated mutations attributed to a specific mutation type. g The distribution of mutation signatures in the cohort. SBS, single base substitution.
Fig. 3
Fig. 3. Comparative analysis of mutation characteristics between synchronous and metachronous ovarian metastasis.
a Ninety-six substitutions were derived from WES data obtained from synchronous and metachronous ovarian metastasis tumor samples. SBS, single base substitution. b The enrichment of alterations in primary or metastatic ovarian lesions between synchronous and metachronous ovarian metastasis. Chi-squared test (χ²) and Fisher’s exact test were used in the comparison. c The distribution of primary, metastatic, and shared genetic changes in patients with synchronous and metachronous ovarian metastasis. d Comparative analysis of mutation composition in synchronous (n = 45) and metachronous ovarian metastasis (n = 19). P-values were calculated using a one-way ANOVA analysis of variance with two-side. The boxplot elements indicate the maxima, 75th percentile, median, 25th percentile, and minima. Source data are provided as a Source Data file.
Fig. 4
Fig. 4. Genomic alterations in signaling pathways in primary gastric lesions, ovarian metastasis and between synchronous and metachronous ovarian metastasis.
a The heatmap shows the enrichment of KEGG pathway mutations in the four groups of our cohort in comparison to TCGA GC. Scores ranging from 0 to 0.25 were colored to varying degrees in blue based on their size, scores 0.25 were marked as white, and scores ranging from 0.25 to 1 were marked as varying degrees in red. b The distribution of mutational frequencies in the ErbB, MAPK, PI3K-Akt, Wnt and p53 signaling pathways across four groups and TCGA database. Red indicates predicted activation, blue indicates predicted inactivation. The numerical value superimposed on each box corresponds the frequency of gene mutations in the corresponding groups. The intensity of the color saturation within each box is directly proportional to the mutational frequency. P., primary. M., metastasis. Syn., synchronous. Meta., metachronous. T., TCGA.
Fig. 5
Fig. 5. Inferred phylogeny and migration patterns of ovarian metastatic GC with genomic similarity and the resulting prognosis.
a Phylogenetic relationships in paired primary tumors and metastatic tumors. The phylogenetic intermediate trunk represents shared mutations between primary and metastatic lesions, left branches represent unique mutations in primary lesions, and right branches represent unique mutations in metastatic lesions. b Response of ovarian lesions with different evolutionary patterns to paclitaxel treatment. P-values were calculated using Fisher’s exact test between any two cohorts. Source data are provided as a Source Data file. c Kaplan-Meier’s curves for overall survival based on patients with different evolutionary patterns after diagnosis. P, parallel evolution. I, intermediate evolution. L, linear evolution. Differences between groups were assessed by the log-rank test. P value < 0.05 was considered statistically significant.
Fig. 6
Fig. 6. CLDN18 fusion mutations were associated with paclitaxel efficacy.
a A correlation analysis between mutated genes and paclitaxel efficacy. The percentages represent the proportion of patients harboring mutations within each respective group. Chi-squared test (χ²) and Fisher’s exact test were used in the comparison. b A schematic diagram of CLDN18 fusion in metastatic ovarian lesion. c The results of CCK-8 assays following treatment with paclitaxel (0, 0.3125, 0.625, 1.25, 2.50, 5.0, 10.0 uM) or oxaliplatin (0, 0.3125, 0.625, 1.25, 2.50, 5.0, 10.0 uM) for 48 h in MNK-1 and HGC-27 GC cell lines with CLDN18-ARHGAP26/42 fusion mutations (n = 3 biological replicates). Source data are provided as a Source Data file. d The results of transwell following treatment with paclitaxel (2.5 uM) or oxaliplatin (2.5 uM) for 72 h in MNK-1 and HGC-27 GC cell lines with CLDN18-ARHGAP26/42 fusion mutations (n = 3 biological replicates). e Quantitation of the transwell (n = 3 biological replicates). P, two-sided Student’s t-test. Source data are provided as a Source Data file. f MKN-1 GC cells stably transfected with CLDN18-ARHGAP26/42 fusion mutations or empty vector were subcutaneously inoculated into the left ovary nude mice (n = 5 biological replicates). One week later, mice were treated with 10 mg/kg/tiw paclitaxel for 4 weeks. The luciferase signals in the mice were detected and images were obtained using an IVIS imaging system. P, two-sided Student’s t-test. g The mice were monitored for changes in body weight as a surrogate marker for toxicity. There is no significant difference between any two groups at the same time point. P, two-sided Student’s t-test. Source data are provided as a Source Data file. h The average tumor mass (determined by the detected photons/sec) of mice in different groups at week 1 (beginning of intervention) and week 5 (end of intervention, n = 5 biological replicates). P, two-sided Student’s t-test. In c, e, g and h, error bars represent mean ± standard deviations. In e, h, the boxplot elements indicate the maxima, 75th percentile, median, 25th percentile, and minima. Source data are provided as a Source Data file.

Similar articles

Cited by

References

    1. Smyth EC, Nilsson M, Grabsch HI, van Grieken NC, Lordick F. Gastric cancer. Lancet. 2020;396:635–648. doi: 10.1016/S0140-6736(20)31288-5. - DOI - PubMed
    1. Namikawa T, et al. Frequency and therapeutic strategy for patients with ovarian metastasis from gastric cancer. Langenbecks Arch. Surg. 2022;407:2301–2308. doi: 10.1007/s00423-022-02543-3. - DOI - PubMed
    1. Ma F, et al. Metastasectomy improves the survival of gastric cancer patients with Krukenberg tumors: a retrospective analysis of 182 patients. Cancer Manag. Res. 2019;11:10573–10580. doi: 10.2147/CMAR.S227684. - DOI - PMC - PubMed
    1. Yuen ST, Leung SY. Genomics study of gastric cancer and its molecular subtypes. Adv. Exp. Med. Biol. 2016;908:419–439. doi: 10.1007/978-3-319-41388-4_21. - DOI - PubMed
    1. Network CGAR. Comprehensive molecular characterization of gastric adenocarcinoma. Nature. 2014;513:202–209. doi: 10.1038/nature13480. - DOI - PMC - PubMed

Publication types

MeSH terms