. 2024 May 4;15(1):3763.
doi: 10.1038/s41467-024-48199-z.

Ozone as an environmental driver of influenza

Affiliations

Ozone as an environmental driver of influenza

Fang Guo et al. Nat Commun. .

Abstract

Under long-standing threat of seasonal influenza outbreaks, it remains imperative to understand the drivers of influenza dynamics which can guide mitigation measures. While the role of absolute humidity and temperature is extensively studied, the possibility of ambient ozone (O3) as an environmental driver of influenza has received scant attention. Here, using state-level data in the USA during 2010-2015, we examined such research hypothesis. For rigorous causal inference by evidence triangulation, we applied 3 distinct methods for data analysis: Convergent Cross Mapping from state-space reconstruction theory, Peter-Clark-momentary-conditional-independence plus as graphical modeling algorithms, and regression-based Generalised Linear Model. The negative impact of ambient O3 on influenza activity at 1-week lag is consistently demonstrated by those 3 methods. With O3 commonly known as air pollutant, the novel findings here on the inhibition effect of O3 on influenza activity warrant further investigations to inform environmental management and public health protection.


Conflict of interest statement

The authors declare no competing interests.

Figures

Fig. 1
Fig. 1. Weekly time series of environmental measurements and influenza activity in 46 states of the USA during 2010–2015.
Influenza activity is indicated by the variable “Flu” which is the product of two proportions: the proportion of influenza-like-illness cases among all clinical consultations in the community and the proportion of laboratory confirmed influenza-positive specimens among all specimens tested. Long stretches of 0 values for “Flu” in non-influenza season (June to September), shaded in gray columns, contain little information for causal inference and thus are omitted from data analysis.
Fig. 2
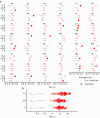
Fig. 2. Causality tests by convergent cross-mapping (CCM) for the effect of environmental factors (ozone [O3], absolute humidity [AH], temperature [T]) at 1-week lag on influenza activity in the states of USA.
a State-specific observed CCM skills (as circles), ΔρCCM, and their null distribution in 1000 seasonal surrogates (as line ranges). Circles are filled to signify the measured ΔρCCM for each state exceeding 95% of its null values. b Summary of state-specific ΔρCCM values in violin plots. Meta-significance estimate for the nation (pmeta) is tested by summing the logs of state-level p values; CCM causality is deemed significant with pmeta<1.0×10³.
Fig. 3
Fig. 3. State-specific effect strength estimates for ozone (O3) affecting influenza activity at 1-week lag.
Multivariate S-map technique is used to estimate the effect size, along with CCM test on causality. With normalization of data, the effect magnitude is in a standardized metric. A diverging palette centered at 0 is used to distinguish between positive (red) and negative values (blue). The darker the color, the stronger the effect size in either direction. Four states (FL, NJ, RI, and VT) shaded in gray are excluded from analysis due to influenza data missingness. Map was plotted using “usmap” R package (version 0.6.1).
Fig. 4
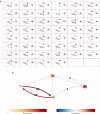
Fig. 4. Graphical modeling by PCMCI+ based on dynamic data of environmental factors (ozone [O3], absolute humidity [AH], temperature [T]) and influenza activity (Flu) in the states of USA.
a State-specific causal graph estimates. Curved and straight edges represent the lagged and contemporaneous causal dependencies, respectively; the number on the curve indicates a lagged relationship in weeks. Node color denotes autocorrelation strength (i.e., auto-MCI [Momentary Conditional Independence] value); edge color depicts the causal strength (i.e., cross-MCI) estimated via partial correlation. b Nationwide causal graph estimate. The hyperparameter significance level (αPC) is set as 0.05 for individual states and 0.001 for the nationwide analysis.
Fig. 5
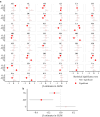
Fig. 5. Effects of environmental factors on influenza activity, at 1-week lag, estimated by generalized linear model (GLM).
a State-level point estimates of regression coefficients (β) and their 95% confidence intervals shown as circles and line ranges, respectively (n = 173 weeks of dynamic data); Circles are filled when the p value for statistical significance test is <0.05 (two-sided). b Nationwide point risk estimates with the corresponding 99.9% confidence intervals shown as circles and line ranges, respectively, after pooling state-level coefficients (n = 46). Circles are filled when the p value is <0.001 (two-sided) during meta-analysis. O3 ozone, AH absolute humidity, T temperature.

References

    1. Lafond KE, et al. Global role and burden of influenza in pediatric respiratory hospitalizations, 1982–2012: a systematic analysis. PLoS Med. 2016;13:e1001977. doi: 10.1371/journal.pmed.1001977. - DOI - PMC - PubMed
    1. Iuliano AD, et al. Estimates of global seasonal influenza-associated respiratory mortality: a modelling study. Lancet. 2018;391:1285–1300. doi: 10.1016/S0140-6736(17)33293-2. - DOI - PMC - PubMed
    1. Lam EKS, Morris DH, Hurt AC, Barr IG, Russell CA. The impact of climate and antigenic evolution on seasonal influenza virus epidemics in Australia. Nat. Commun. 2020;11:2741. doi: 10.1038/s41467-020-16545-6. - DOI - PMC - PubMed
    1. Grantz KH, et al. Disparities in influenza mortality and transmission related to sociodemographic factors within Chicago in the pandemic of 1918. Proc. Natl Acad. Sci. USA. 2016;113:13839–13844. doi: 10.1073/pnas.1612838113. - DOI - PMC - PubMed
    1. Tamerius JD, et al. Environmental predictors of seasonal influenza epidemics across temperate and tropical climates. PLoS Pathog. 2013;9:e1003194. doi: 10.1371/journal.ppat.1003194. - DOI - PMC - PubMed

Publication types