

Metritis and the uterine disease microbiome are associated with long-term changes in the endometrium of dairy cows†
- PMID: 38704744
- PMCID: PMC12097902
- DOI: 10.1093/biolre/ioae067
Metritis and the uterine disease microbiome are associated with long-term changes in the endometrium of dairy cows†
Abstract
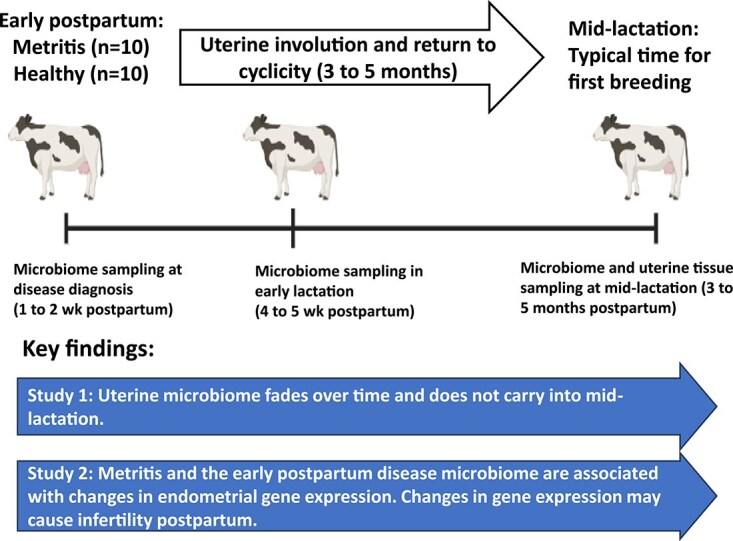
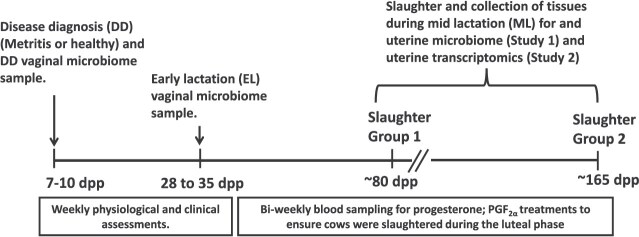
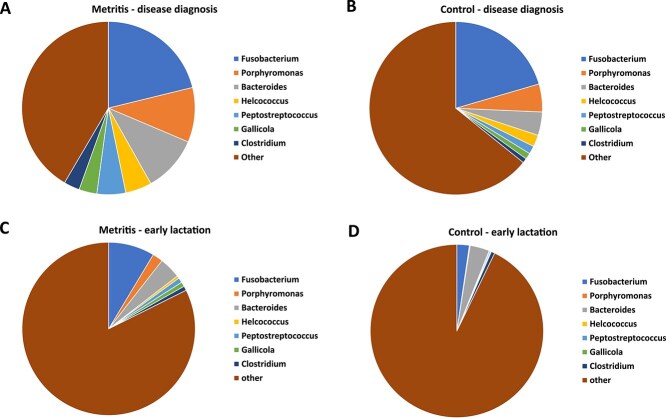
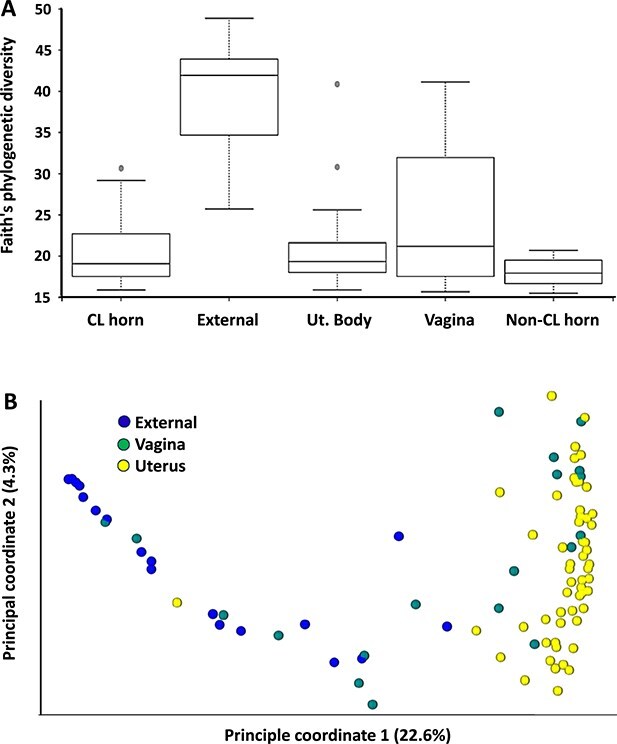
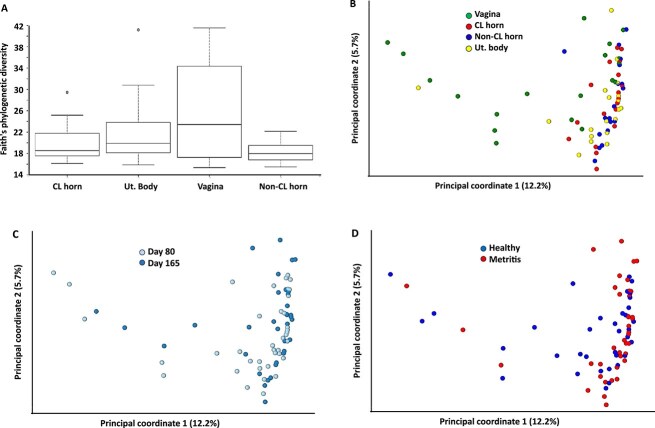
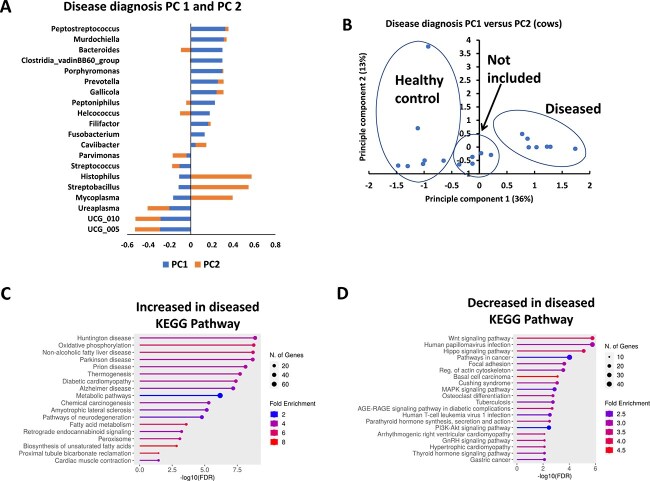
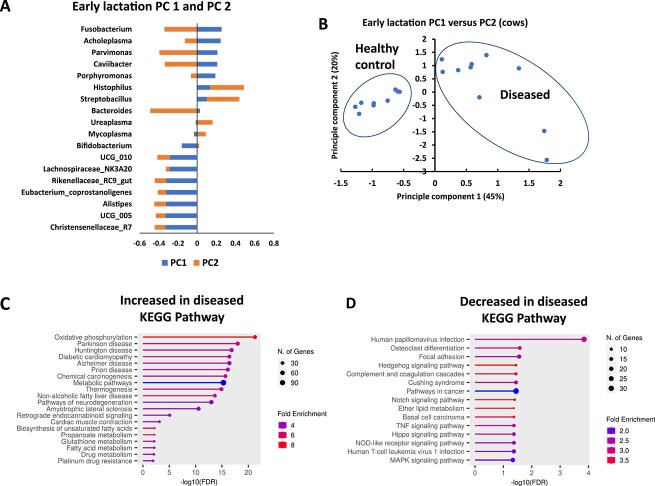
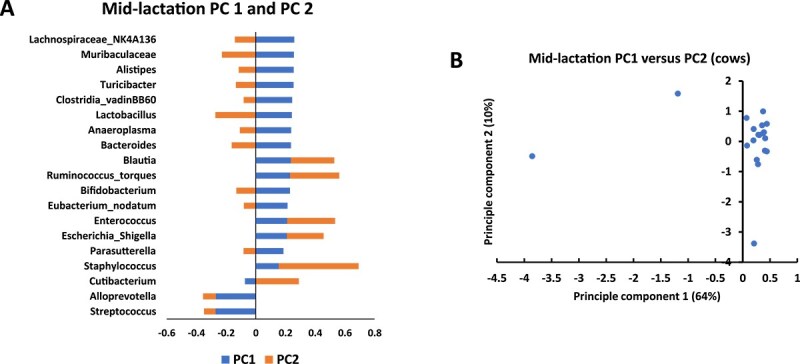
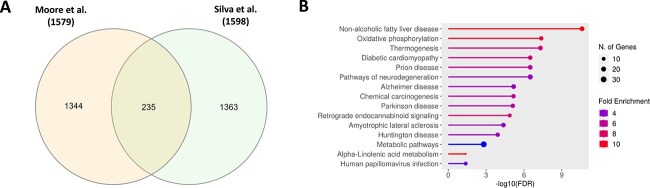
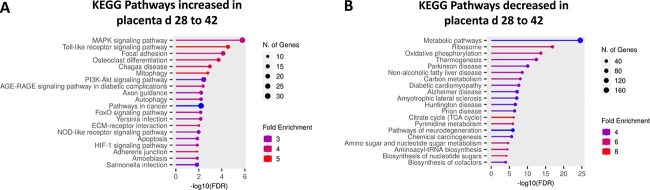
Cows with metritis (uterine disease) during the first 1 to 2 weeks postpartum have lower pregnancy rates when inseminated later postpartum (typically >10 weeks). We hypothesized that metritis and the disease-associated uterine microbiome have a long-term effect on endometrial gene expression. Changes in gene expression may inform a mechanism through which disease lowers pregnancy rates. A total of 20 cows were enrolled at 1 to 2 weeks postpartum to either metritis (clinical disease; n = 10) or healthy (control; n = 10) groups and randomly assigned to be slaughtered at approximately 80 and 165 dpp (mid-lactation). The microbiome of the reproductive tract was sampled to confirm the presence of pathogens that are typical of metritis. In addition to the original clinical diagnosis, study cows were retrospectively assigned to uterine-disease and control groups based on the composition of their microbiome. There was no effect of early postpartum uterine disease on the uterine microbiome at mid-lactation (time of slaughter). Nonetheless, early postpartum metritis and the disease microbiome were associated with a large number of differentially-expressed genes at mid-lactation primarily in the caruncular compared with the inter-caruncular endometrium. Gene enrichment analysis identified oxidative phosphorylation as the primary pathway increased in caruncular endometrium of diseased cows whereas growth factor signaling pathways were reduced. The current study demonstrated that metritis and a uterine disease microbiome leave a sustained imprint on gene expression in the caruncular endometrium that may explain lower fertility in cows with postpartum uterine disease.
Keywords: cow; endometrium; metritis; microbiome.
© The Author(s) 2024. Published by Oxford University Press on behalf of Society for the Study of Reproduction. All rights reserved. For permissions, please e-mail: journals.permissions@oup.com.
Figures
Similar articles
-
Symposium review: The uterine microbiome associated with the development of uterine disease in dairy cows.J Dairy Sci. 2019 Dec;102(12):11786-11797. doi: 10.3168/jds.2019-17106. Epub 2019 Oct 3. J Dairy Sci. 2019. PMID: 31587913 Review.
-
Systemic antibiotic treatment of cows with metritis early postpartum does not change the progression of uterine disease or the uterine microbiome at 1 month postpartum.Res Sq [Preprint]. 2024 Apr 12:rs.3.rs-4233045. doi: 10.21203/rs.3.rs-4233045/v1. Res Sq. 2024. PMID: 38659779 Free PMC article. Preprint.
-
Mucin 1 and cytokines mRNA in endometrium of dairy cows with postpartum uterine disease or repeat breeding.Theriogenology. 2014 Apr 15;81(7):952-958.e2. doi: 10.1016/j.theriogenology.2014.01.018. Epub 2014 Jan 31. Theriogenology. 2014. PMID: 24576715
-
Genetic and functional analysis of the bovine uterine microbiota. Part I: Metritis versus healthy cows.J Dairy Sci. 2017 May;100(5):3850-3862. doi: 10.3168/jds.2016-12058. Epub 2017 Mar 2. J Dairy Sci. 2017. PMID: 28259404
-
Tolerance and Innate Immunity Shape the Development of Postpartum Uterine Disease and the Impact of Endometritis in Dairy Cattle.Annu Rev Anim Biosci. 2019 Feb 15;7:361-384. doi: 10.1146/annurev-animal-020518-115227. Epub 2018 Oct 25. Annu Rev Anim Biosci. 2019. PMID: 30359085 Free PMC article. Review.
Cited by
-
Short- and long-term effects of uterine disease on oocyte developmental capacity in postpartum dairy cows.Theriogenology. 2025 Jul 1;240:117413. doi: 10.1016/j.theriogenology.2025.117413. Epub 2025 Mar 29. Theriogenology. 2025. PMID: 40179568
-
Adenomyosis and fibrosis define the morphological memory of the postpartum uterus of dairy cows previously exposed to metritis.JDS Commun. 2024 Oct 30;6(2):250-255. doi: 10.3168/jdsc.2024-0633. eCollection 2025 Mar. JDS Commun. 2024. PMID: 40405988 Free PMC article.
References
-
- Lucy MC. Symposium review: selection for fertility in the modern dairy cow—current status and future direction for genetic selection. J Dairy Sci 2019; 102:3706–3721. - PubMed
-
- Lima FS, Vieira-Neto A, Snodgrass JA, De Vries A, Santos JEP. Economic comparison of systemic antimicrobial therapies for metritis in dairy cows. J Dairy Sci 2019; 102:7345–7358. - PubMed
-
- Bromfield JJ, Santos JEP, Block J, Williams RS, Sheldon IM. PHYSIOLOGY AND ENDOCRINOLOGY SYMPOSIUM: uterine infection: linking infection and innate immunity with infertility in the high-producing dairy cow. J Anim Sci 2015; 93:2021–2033. - PubMed
-
- Wagener K, Gabler C, Drillich M. A review of the ongoing discussion about definition, diagnosis and pathomechanism of subclinical endometritis in dairy cows. Theriogenology 2017; 94:21–30. - PubMed
-
- Giuliodori MJ, Magnasco RP, Becu-Villalobos D, Lacau-Mengido IM, Risco CA, de la Sota RL. Metritis in dairy cows: risk factors and reproductive performance. J Dairy Sci 2013; 96:3621–3631. - PubMed
MeSH terms
Grants and funding
LinkOut - more resources
Full Text Sources
Medical
