. 2024 Jun 15:196:106522.
doi: 10.1016/j.nbd.2024.106522. Epub 2024 May 3.

LRRK2 kinase inhibition protects against Parkinson's disease-associated environmental toxicants

Affiliations

LRRK2 kinase inhibition protects against Parkinson's disease-associated environmental toxicants

Neda M Ilieva et al. Neurobiol Dis. .

Abstract

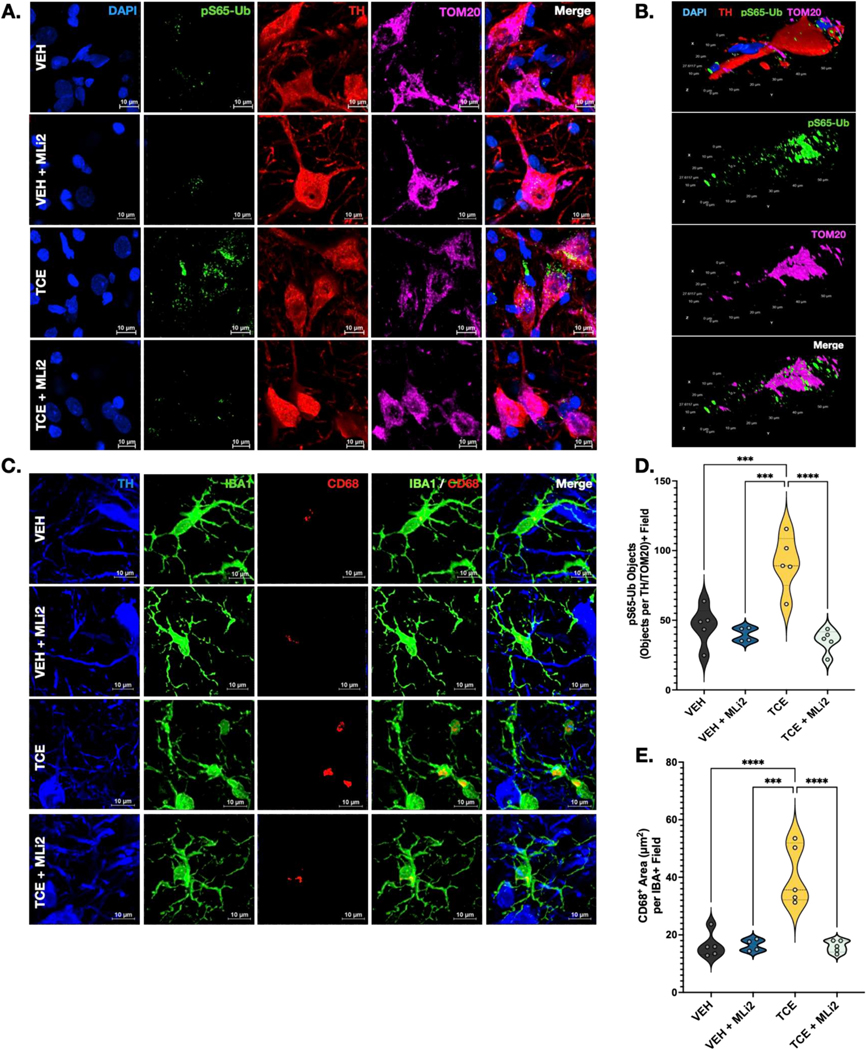
Idiopathic Parkinson's disease (PD) is epidemiologically linked with exposure to toxicants such as pesticides and solvents, which comprise a wide array of chemicals that pollute our environment. While most are structurally distinct, a common cellular target for their toxicity is mitochondrial dysfunction, a key pathological trigger involved in the selective vulnerability of dopaminergic neurons. We and others have shown that environmental mitochondrial toxicants such as the pesticides rotenone and paraquat, and the organic solvent trichloroethylene (TCE) appear to be influenced by the protein LRRK2, a genetic risk factor for PD. As LRRK2 mediates vesicular trafficking and influences endolysosomal function, we postulated that LRRK2 kinase activity may inhibit the autophagic removal of toxicant damaged mitochondria, resulting in elevated oxidative stress. Conversely, we suspected that inhibition of LRRK2, which has been shown to be protective against dopaminergic neurodegeneration caused by mitochondrial toxicants, would reduce the intracellular production of reactive oxygen species (ROS) and prevent mitochondrial toxicity from inducing cell death. To do this, we tested in vitro if genetic or pharmacologic inhibition of LRRK2 (MLi2) protected against ROS caused by four toxicants associated with PD risk - rotenone, paraquat, TCE, and tetrachloroethylene (PERC). In parallel, we assessed if LRRK2 inhibition with MLi2 could protect against TCE-induced toxicity in vivo, in a follow up study from our observation that TCE elevated LRRK2 kinase activity in the nigrostriatal tract of rats prior to dopaminergic neurodegeneration. We found that LRRK2 inhibition blocked toxicant-induced ROS and promoted mitophagy in vitro, and protected against dopaminergic neurodegeneration, neuroinflammation, and mitochondrial damage caused by TCE in vivo. We also found that cells with the LRRK2 G2019S mutation displayed exacerbated levels of toxicant induced ROS, but this was ameliorated by LRRK2 inhibition with MLi2. Collectively, these data support a role for LRRK2 in toxicant-induced mitochondrial dysfunction linked to PD risk through oxidative stress and the autophagic removal of damaged mitochondria.

Keywords: Environmental toxicants; Gene x environment (GxE); Leucine rich repeat kinase 2 (LRRK2); Mitochondria; Parkinson's disease (PD).


Conflict of interest statement

Declaration of competing interest The authors declare no conflicts of interest.

Figures

Fig. 1.
Fig. 1.
LRRK2 mediates toxicant induced ROS generation. A WT or CRISPR-edited HEK-293T cells (G2019S, LRRK2 KO) were treated with 500 nM ROT, 500 μM PQ, 1 mM TCE or PERC alone or in combination with 1 μM MLi2 as per previously identified time points (4 h for ROT & PQ, and 24 h for TCE & PERC). ROS were measured with dihydroethidium (DHE) and DHE signal is represented in a pseudocolored gradient (blue is lowest ROS and white is highest ROS)⋅B-E DHE signal was increased in all toxicant-treated groups and exacerbated in G2019S cells. DHE was significantly decreased in the MLi2-treated groups and in LRRK2 KO cells. Significant treatment effects were found. ROT (F(3,32) = 135.4, p < 0.0001); PQ (F(3,33) = 63.61, p < 0.0001); TCE (F(3,34) = 47.79, p < 0.0001); PERC (F(3,33) = 74.59, p < 0.0001). F – I. DHE signal was significantly elevated in G2019S cells compared to WT 293-T for ROT and PQ treatments, but not for TCE and PERC. MLi2 restored DHE signal to WT and LRRK2 KO levels in G2019S cells. Significant effects of genotype were found. ROT (F(2,32) = 188.0, p < 0.0001); PQ (F(2,33) = 61.18, p < 0.0001); TCE (F(2,34) = 39.12, p < 0.0001); PERC (F(2,33) = 56.93, p < 0.0001). Significant interaction effects of treatment and genotype were found. ROT (F(6,32) = 50.55, p < 0.0001); PQ (F(6,33) = 14.60, p < 0.0001); TCE (F(6,34) = 18.59, p < 0.0001); PERC (F(6, 33) = 26.65, p < 0.0001). N = 3–5 biological replicates, 120–160 cells per technical replicate, two-way ANOVAs with post-hoc Tukey test for multiple comparisons adjustment. ANOVA tables, descriptive statistics, and post-hoc comparisons are provided in Supplemental Table 1. Bar graphs represent mean values for each group, with error bars. Significance values as indicated: **p < 0.01, ***p < 0.001, ****p < 0.0001. (For interpretation of the references to colour in this figure legend, the reader is referred to the web version of this article.)
Fig. 2.
Fig. 2.
LRRK2 mediated effects on toxicant induced ROS are threshold dependent. A. Representative images of CRISPR-edited 293-T cells (LRRK2 knockout; LRRK2 KO) treated with either 0.10% DMSO, 1 μM MLi2, or scaled doses of rotenone (ROT; 500 nM, 1 μM, 2 μM, 4 μM, and 8 μM ROT). B. ROS quantification using DHE signal intensity of LRRK2 KO cells. ROS formation was significantly increased only in LRRK2 KO cells treated with >1 μM ROT (p < 0.0001) with no significant differences between 1 and 8 μM ROT; (F(6,20) = 42.97, p < 0.0001), one-way ANOVA. C. Representative images of LRRK2 KO cells treated with 0.10% DMSO, 1 μM MLi2, 500 nM ROT, or 1 μM ROT alone or in conjunction with 1 μM MLi2. D. ROS quantification using DHE signal intensity of LRRK2 KO cells. No significant differences were shown between 500 nM or 1 μM ROT alone or with MLi2 (p > 0.9999, and p = 0.1239 respectively). One-way ANOVA, (F(5,17) = 148.2, p < 0.0001). E. Representative images WT 293-T cells treated with 0.10% DMSO, 1 μM MLi2, 500 nM ROT, or 1 μM ROT alone or in conjunction with 1 μM MLi2. F. ROS quantification using DHE signal intensity in WT 293-T cells. While co-treatment with MLi2 significantly reduced ROS from exposure to 500 nm ROT (p = 0.0048), it could not attenuate ROS resulting from 1 μM ROT treatment (p = 0.2740).One-way ANOVA with Tukey post-hoc for multiple comparisons, N = 3–4 biological independent replicates, 150–200 cells per technical replicate, *p < 0.05, **p < 0.01, ***p < 0.001, ****p < 0.0001.
Fig. 3.
Fig. 3.
LRRK2 inhibition protects against toxicant-induced mitophagy deficits. A. Representative images of WT 293-T, G2019S, or LRRK2 KO treated with 0.10% DMSO, 1 μM MLi2, 500 nM ROT, and 500 μM TCE alone or in combination with 1 μM MLi2. Mitophagy was measured via a quantification of the number of intersecting objects between LC3b (autophagosomal membrane marker, green) and TOM20 (outer mitochondrial membrane marker, red). B. Quantification of number of LC3b/TOM20 intersecting objects per cell in each genotype. Two-way ANOVA revealed a significant interaction between genotype and treatment (F(10,60) = 9.612, p < 0.0001), suggesting that LRRK2 plays a role in mitophagy deficits associated with toxicant exposure. Post-hoc Dunn’s multiple comparisons revealed genotype differences in DMSO, ROT, TCE, and TCE + MLi2 treated groups. C-E. Statistical comparisons between treatments in each individual genotype. Two-way ANOVA with Dunn’s multiple comparisons. MLi2 co-treatment reduced toxicant-induced mitophagy deficits for ROT (WT 293-T p = 0.0037, G2019S p < 0.0001) and TCE (WT 293-T and G2019S p < 0.0001). LRRK2 KO cells were protected from mitophagy deficits and LRRK2 inhibition with MLi2 has no off-target effects. One-way ANOVAs with post-hoc Tukey’s multiple-comparisons. WT 293-T F(5,21) = 14.75, p < 0.0001, G2019S F(5,20) = 38.63, p < 0.0001, LRRK2 KO F(5,19) = 2.266, p = 0.0893. N = 3–4 biological replicates, n = 150–200 cells per technical replicate, *p < 0.05, **p < 0.01, ***p < 0.001, ****p < 0.0001. (For interpretation of the references to colour in this figure legend, the reader is referred to the web version of this article.)
Fig. 4.
Fig. 4.
LRRK2 kinase inhibition attenuates TCE-induced neurodegeneration. A. Aged female Lewis rats were treated with 200 mg/kg of TCE for 6 weeks. Beginning at 3 weeks post-exposure, a cohort of rats was treated with 10 mg/kg MLi2 or vehicle. B-C. TH-positive cells from 3-week VEH and TCE exposed rats within the SN, N = 5 animals per group. Unpaired Mann-Whitney U Test (p = 0.5952) indicates no differences between TCE and VEH animals at 3 weeks. D. Representative images of Nissl-stained VEH and TCE-exposed mice at 6 weeks with SN highlighted. E. Representative images of TH-positive cells within the SN of VEH or TCE-treated rats for 6 weeks. F. Stereological counts of TH+ cells in each group. MLi2 post-lesion administration significantly rescued neuronal loss in TCE-treated animals, p = 0.0003 (F = 23.47, p < 0.0001). G. Analysis of Nissl+ objects in the SN. MLi2 post-lesion administration significantly rescued cell loss in the SN in TCE-treated animals, p = 0.0007 (F = 16.40, p < 0.0001). ANOVA tables, descriptive statistics, and post-hoc comparisons are provided in Supplemental Table 1. N = 4–5 animals per group. Violin plots represent the data distribution with its probability density, with dashed lines representing mean. Significance values as indicated: ***p < 0.001, ****p < 0.0001.
Fig. 5.
Fig. 5.
LRRK2 kinase inhibition reduced oxidative stress in dopaminergic neurons of TCE-exposed rats. A-B. Representative images of dopaminergic neurons (60×) within the SN of VEH of TCE-exposed animals for 6 weeks, with or without post-lesion treatment with 10 mg/kg MLi2. Oxidative damage was measured using 3-nitrotyrosine (3-NT, white) and 4-hydroxynonenal (4-HNE) cyan. C. Quantification of 3-NT per TH+ neuron. TCE animals treated with post-lesion administration of MLi2 had reduced oxidative stress compared to TCE animals with vehicle (methyl cellulose), p = 0.0003, F (3.00, 6.734) = 219.9, p < 0.0001, Brown-Forsythe ANOVA with post-hoc Dunnett’s for multiple comparisons). D. Quantification of 4-HNE per TH+ SN field. MLi2 treatment significantly reduced oxidative stress in DA neurons of TCE animals at 6 weeks (p < 0.0001) with significant differences in oxidative stress from the peroxidation of fatty acids (F(3,15) = 36.04, p < 0.0001, one-way ANOVA with Tukey post-hoc multiple comparisons). N = 4–5 animals per group. ANOVA tables, descriptive statistics, and post-hoc comparisons are provided in Supplemental Table 1. Violin plots represent the data distribution with its probability density, with dashed lines representing means of groups. Significance values as indicated: ***(p < 0.001), ****(p < 0.0001). (For interpretation of the references to colour in this figure legend, the reader is referred to the web version of this article.)
Fig. 6.
Fig. 6.
LRRK2 kinase inhibition reduced mitochondrial damage and neuroinflammation from TCE exposure. A. Representative images of ps65-Ub, TOM20, and TH in DA neurons of SNPc show a reduction of mitochondrial damage in TCE-treated animals with post-lesion LRRK2 kinase inhibition at 6 weeks. B. Volumetric re-composition of a DA neuron in SNPc of a TCE-treated animal demonstrating the intersection of TOM20 and pS65-Ub within the neuron. Scale bars are depicted on the side of each plane. C. Representative images of CD68, IBA1, and TH in SN. D. Quantification of ps65-Ub intersecting objects per TH/TOM20+ field in SNPc demonstrated differences in mitochondrial damage with MLi2 treatment at 6 weeks (F(3, 15) = 17.89, p < 0.0001, one-way ANOVA with post-hoc Tukey’s for multiple comparisons). TCE animals treated with MLi2 had reduced mitochondrial damage compared to TCE animals treated with vehicle (methyl cellulose), p < 0.0001. E. Quantification of CD68+ objects per IBA1 field demonstrated significant differences in microglial activation with MLi2 treatment (F(3,15) = 20.72, p < 0.0001, one-way ANOVA with Tukey post-hoc multiple comparisons). MLi2 treatment significantly reduced microglial activation in SNPc of TCE-exposed animals compared to TCE animals treated with methyl cellulose at 6 weeks, p < 0.0001. N = 4–5 animals per group. ANOVA tables, descriptive statistics, and post-hoc comparisons are provided in the Supplemental Table 1. Violin plots represent the data distribution with its probability density, with dashed lines representing means of groups. Significance values as indicated: ***(p < 0.001), ****(p < 0.0001).

References

    1. Adamson A, Ilieva N, Stone WJ, De Miranda BR, 2023. Low-dose inhalation exposure to trichloroethylene induces dopaminergic neurodegeneration in rodents. Toxicol Sci. 196 (2), 218–228. 10.1093/toxsci/kfad090. PMID: 37669148. - DOI - PMC - PubMed
    1. Alessi DR, Sammler E, 2018. LRRK2 kinase in Parkinson’s disease. Science 360, 36–37. - PubMed
    1. Ascherio A, et al., 2006. Pesticide exposure and risk for Parkinson’s disease. Ann. Neurol. 60, 197–203. - PubMed
    1. Baltazar MT, et al., 2014. Pesticides exposure as etiological factors of Parkinson’s disease and other neurodegenerative diseases—a mechanistic approach. Toxicol. Lett 230, 85–103. - PubMed
    1. Bellou V, et al., 2016. Environmental risk factors and Parkinson’s disease: an umbrella review of meta-analyses. Parkinsonism Relat. Disord 23, 1–9. - PubMed

Publication types

MeSH terms