

High-fat diet, microbiome-gut-brain axis signaling, and anxiety-like behavior in male rats
- PMID: 38705984
- PMCID: PMC11071217
- DOI: 10.1186/s40659-024-00505-1
High-fat diet, microbiome-gut-brain axis signaling, and anxiety-like behavior in male rats
Abstract
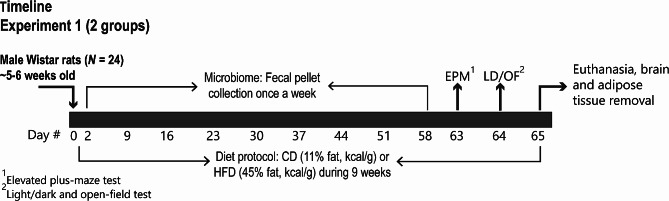
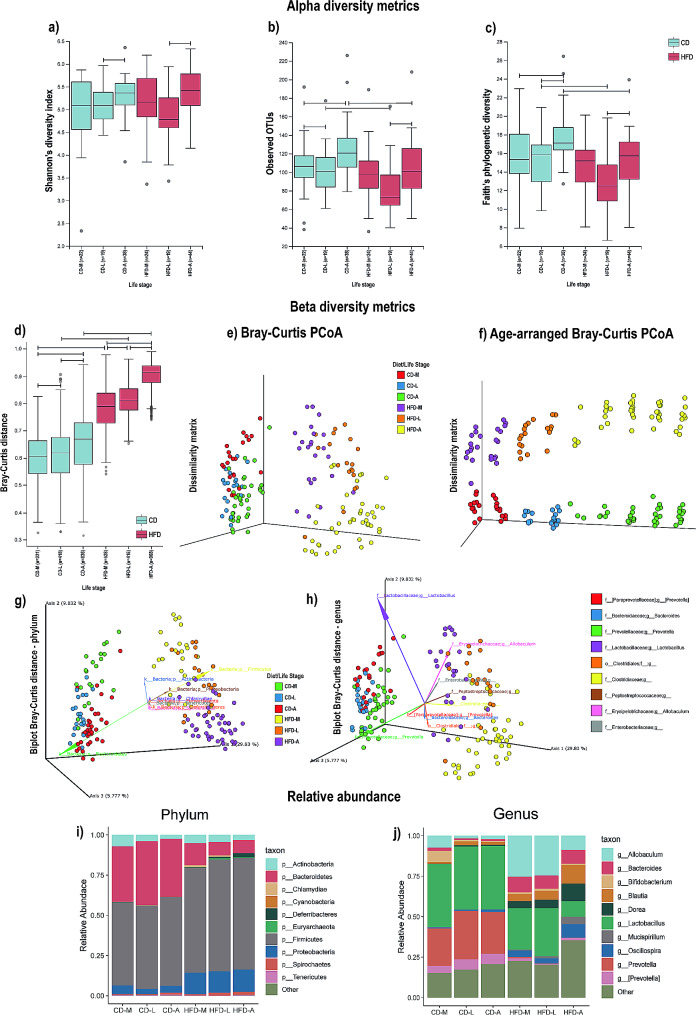
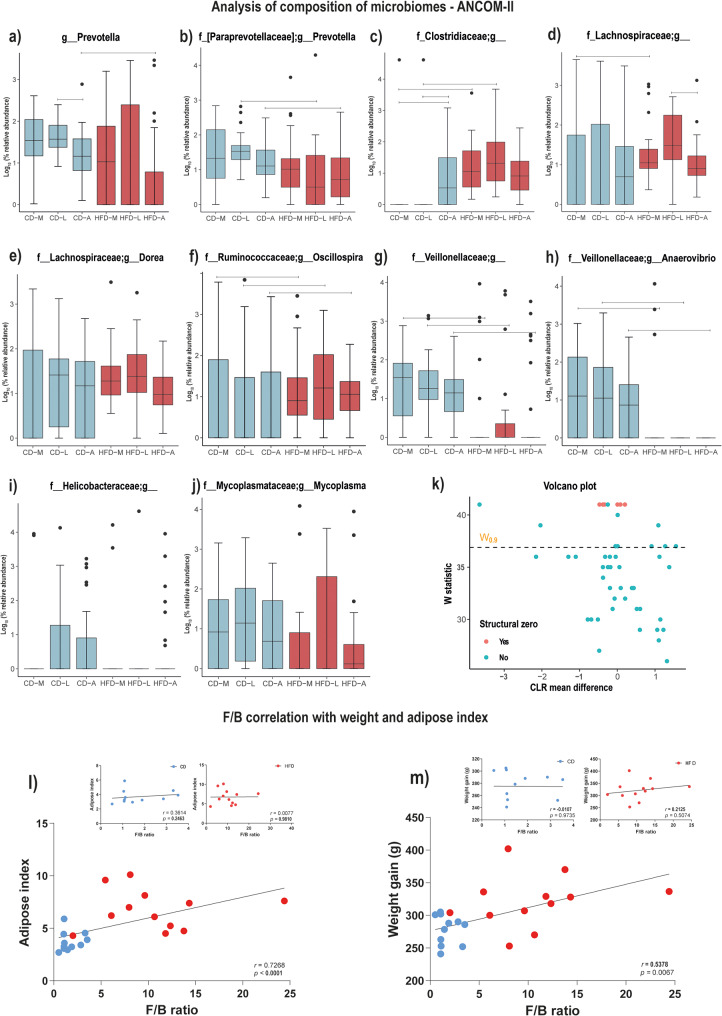
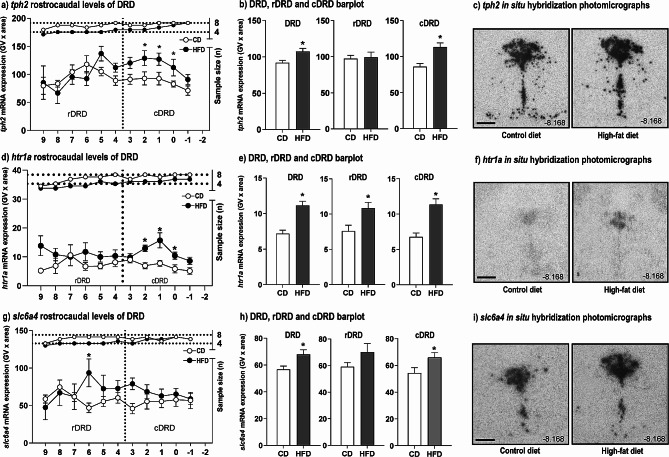
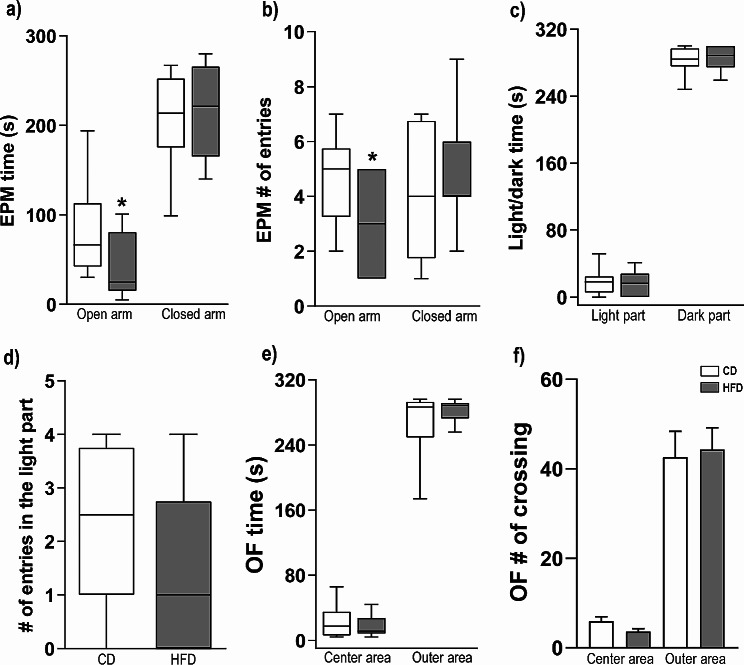
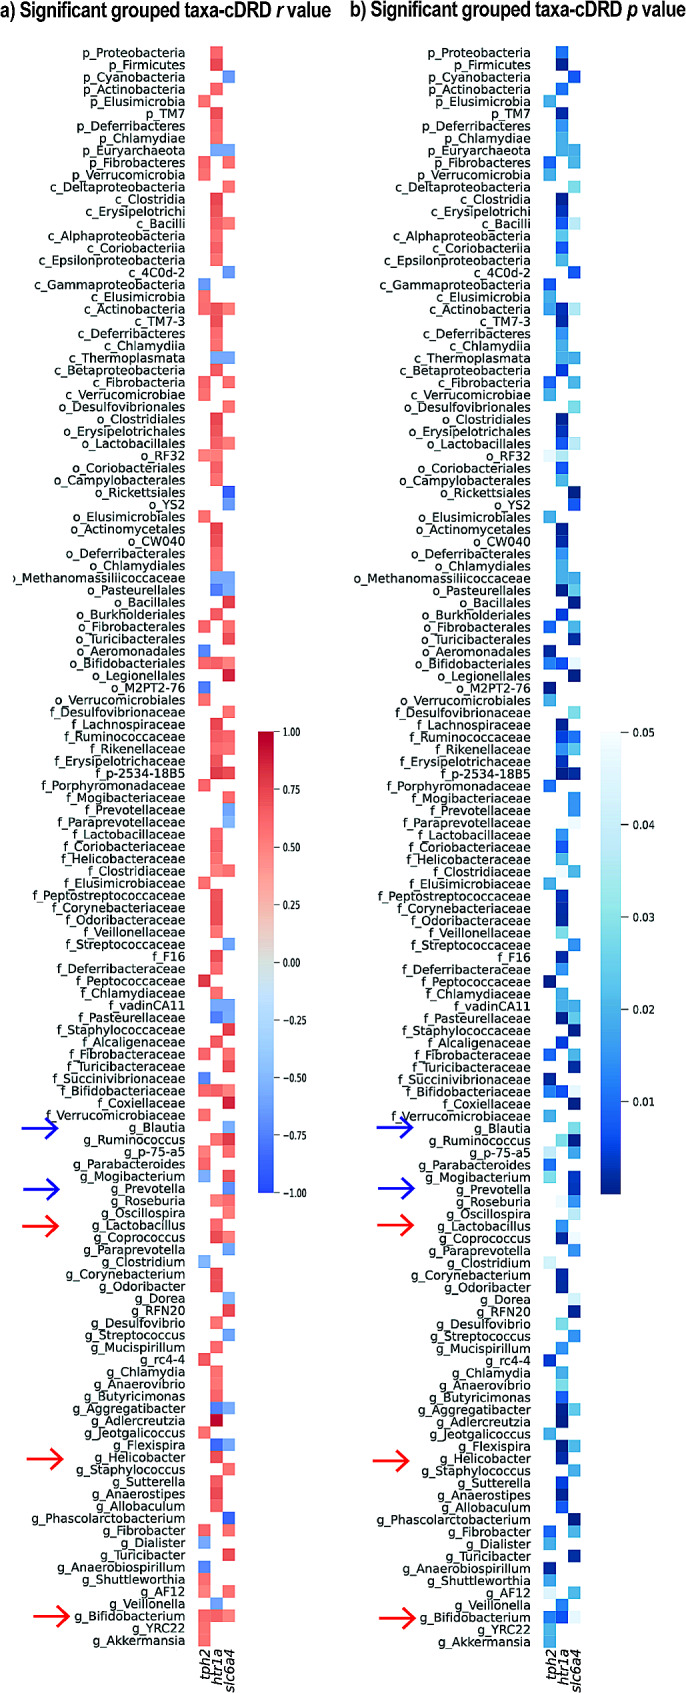
Obesity, associated with the intake of a high-fat diet (HFD), and anxiety are common among those living in modern urban societies. Recent studies suggest a role of microbiome-gut-brain axis signaling, including a role for brain serotonergic systems in the relationship between HFD and anxiety. Evidence suggests the gut microbiome and the serotonergic brain system together may play an important role in this response. Here we conducted a nine-week HFD protocol in male rats, followed by an analysis of the gut microbiome diversity and community composition, brainstem serotonergic gene expression (tph2, htr1a, and slc6a4), and anxiety-related defensive behavioral responses. We show that HFD intake decreased alpha diversity and altered the community composition of the gut microbiome in association with obesity, increased brainstem tph2, htr1a and slc6a4 mRNA expression, including in the caudal part of the dorsomedial dorsal raphe nucleus (cDRD), a subregion previously associated with stress- and anxiety-related behavioral responses, and, finally, increased anxiety-related defensive behavioral responses. The HFD increased the Firmicutes/Bacteroidetes ratio relative to control diet, as well as higher relative abundances of Blautia, and decreases in Prevotella. We found that tph2, htr1a and slc6a4 mRNA expression were increased in subregions of the dorsal raphe nucleus in the HFD, relative to control diet. Specific bacterial taxa were associated with increased serotonergic gene expression in the cDRD. Thus, we propose that HFD-induced obesity is associated with altered microbiome-gut-serotonergic brain axis signaling, leading to increased anxiety-related defensive behavioral responses in rats.
Keywords: tph2; Anxiety; Dorsal raphe nucleus; High-fat diet; Microbiome; Microbiome-gut-brain axis; Obesity; Raphe nuclei; Serotonergic system; Serotonin.
© 2024. The Author(s).
Conflict of interest statement
C.A.L. is Cofounder, Board Member, and Chief Scientific Officer of Mycobacteria Therapeutics Corporation, and is a member of the faculty of the Integrative Psychiatry Institute, Boulder, Colorado, the Institute for Brain Potential, Los Banos, California, and Intelligent Health Ltd, Reading, UK. All other authors declare that the research was conducted in the absence of any commercial or financial relationships that could be construed as a potential conflict of interest.
Figures
Similar articles
-
Association of high-fat diet with neuroinflammation, anxiety-like defensive behavioral responses, and altered thermoregulatory responses in male rats.Brain Behav Immun. 2019 Aug;80:500-511. doi: 10.1016/j.bbi.2019.04.030. Epub 2019 Apr 22. Brain Behav Immun. 2019. PMID: 31022457
-
A High-Fat Diet Increases Gut Microbiota Biodiversity and Energy Expenditure Due to Nutrient Difference.Nutrients. 2020 Oct 20;12(10):3197. doi: 10.3390/nu12103197. Nutrients. 2020. PMID: 33092019 Free PMC article.
-
High-fat diet alters stress behavior, inflammatory parameters and gut microbiota in Tg APP mice in a sex-specific manner.Neurobiol Dis. 2021 Nov;159:105495. doi: 10.1016/j.nbd.2021.105495. Epub 2021 Aug 31. Neurobiol Dis. 2021. PMID: 34478848
-
Maternal exposure to high-fat diet modifies anxiety-like/depression-like behaviors and compounds of Serotonergic System in offspring: A preclinical systematic review.Int J Dev Neurosci. 2021 Aug;81(5):371-385. doi: 10.1002/jdn.10110. Epub 2021 May 2. Int J Dev Neurosci. 2021. PMID: 33788300
-
Gut microbes participate in food preference alterations during obesity.Gut Microbes. 2021 Jan-Dec;13(1):1959242. doi: 10.1080/19490976.2021.1959242. Gut Microbes. 2021. PMID: 34424831 Free PMC article. Review.
Cited by
-
Impact of a High-Fat Diet on the Gut Microbiome: A Comprehensive Study of Microbial and Metabolite Shifts During Obesity.Cells. 2025 Mar 20;14(6):463. doi: 10.3390/cells14060463. Cells. 2025. PMID: 40136712 Free PMC article.
-
Effect of maternal diet on gut bacteria and autism spectrum disorder in offspring.Front Cell Neurosci. 2025 Aug 6;19:1623576. doi: 10.3389/fncel.2025.1623576. eCollection 2025. Front Cell Neurosci. 2025. PMID: 40842563 Free PMC article. Review.
-
The Intersection of Ultra-Processed Foods, Neuropsychiatric Disorders, and Neurolaw: Implications for Criminal Justice.NeuroSci. 2024 Sep 23;5(3):354-377. doi: 10.3390/neurosci5030028. eCollection 2024 Sep. NeuroSci. 2024. PMID: 39483285 Free PMC article.
-
Distinct network patterns emerge from Cartesian and XOR epistasis models: a comparative network science analysis.BioData Min. 2024 Dec 28;17(1):61. doi: 10.1186/s13040-024-00413-w. BioData Min. 2024. PMID: 39732697 Free PMC article.
-
Functional Insights Into the Effect of Feralisation on the Gut Microbiota of Cats Worldwide.Mol Ecol. 2025 Mar;34(6):e17695. doi: 10.1111/mec.17695. Epub 2025 Feb 14. Mol Ecol. 2025. PMID: 39953749 Free PMC article.
References
-
- Santomauro DF, Herrera AMM, Shadid J, Zheng P, Ashbaugh C, Pigott DM, Abbafati C, Adolph C, Amlag JO, Aravkin AY. Global prevalence and burden of depressive and anxiety disorders in 204 countries and territories in 2020 due to the COVID-19 pandemic. Lancet. 2021;398:1700–12. doi: 10.1016/S0140-6736(21)02143-7. - DOI - PMC - PubMed
MeSH terms
Grants and funding
- Conselho Nacional de Desenvolvimento Científico e Tecnológico/Conselho Nacional de Desenvolvimento Científico e Tecnológico
- APQ-00359-21/Fundação de Amparo à Pesquisa do Estado de Minas Gerais
- APQ-02182-17/Fundação de Amparo à Pesquisa do Estado de Minas Gerais
- APQ-00823-21/Fundação de Amparo à Pesquisa do Estado de Minas Gerais
- Center of Animal Science (APQ-02511-22)/Fundação de Amparo à Pesquisa do Estado de Minas Gerais
- Financial Code 001 and the Programa de Doutorado Sanduíche no Exterior [PDSE], process #88881.132957/2016-01/Coordenação de Aperfeiçoamento de Pessoal de Nível Superior
- Financiadora de Estudos e Projetos/Financiadora de Estudos e Projetos
- Universidade Federal de Ouro Preto/Universidade Federal de Ouro Preto
- Foundation for the National Institutes of Health/Foundation for the National Institutes of Health
- National Science Foundation/National Science Foundation
- Institute for Cannabis Research/Institute for Cannabis Research
LinkOut - more resources
Full Text Sources
Medical
