. 2024 May 6;22(1):256.
doi: 10.1186/s12964-024-01632-8.

NRN1 interacts with Notch to increase oncogenic STAT3 signaling in melanoma

Affiliations

NRN1 interacts with Notch to increase oncogenic STAT3 signaling in melanoma

Lucia Devitt et al. Cell Commun Signal. .

Abstract

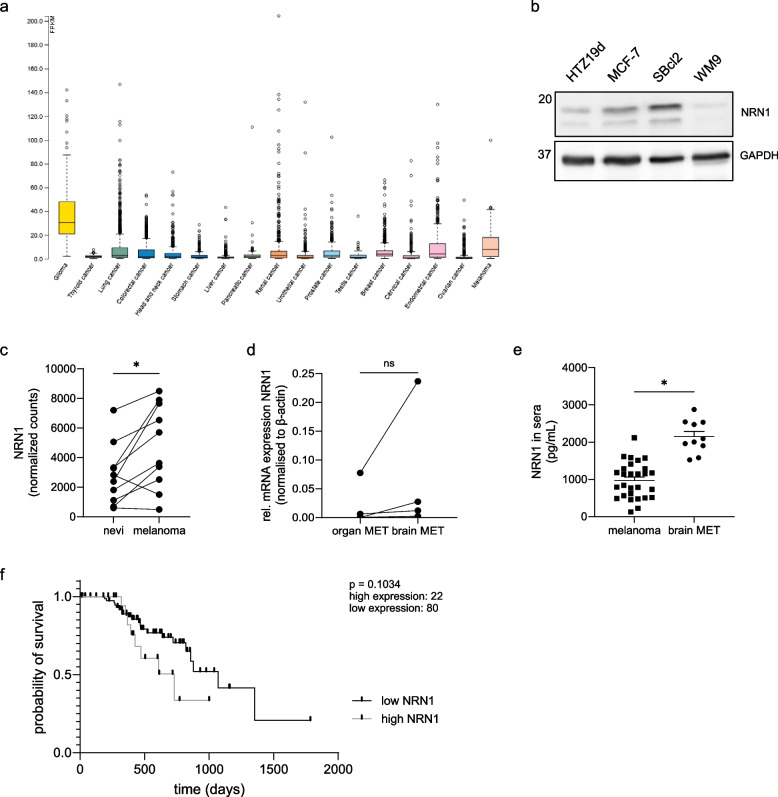
Background: Melanoma is a highly heterogeneous cancer, in which frequent changes in activation of signaling pathways lead to a high adaptability to ever changing tumor microenvironments. The elucidation of cancer specific signaling pathways is of great importance, as demonstrated by the inhibitor of the common BrafV600E mutation PLX4032 in melanoma treatment. We therefore investigated signaling pathways that were influenced by neurotrophin NRN1, which has been shown to be upregulated in melanoma.

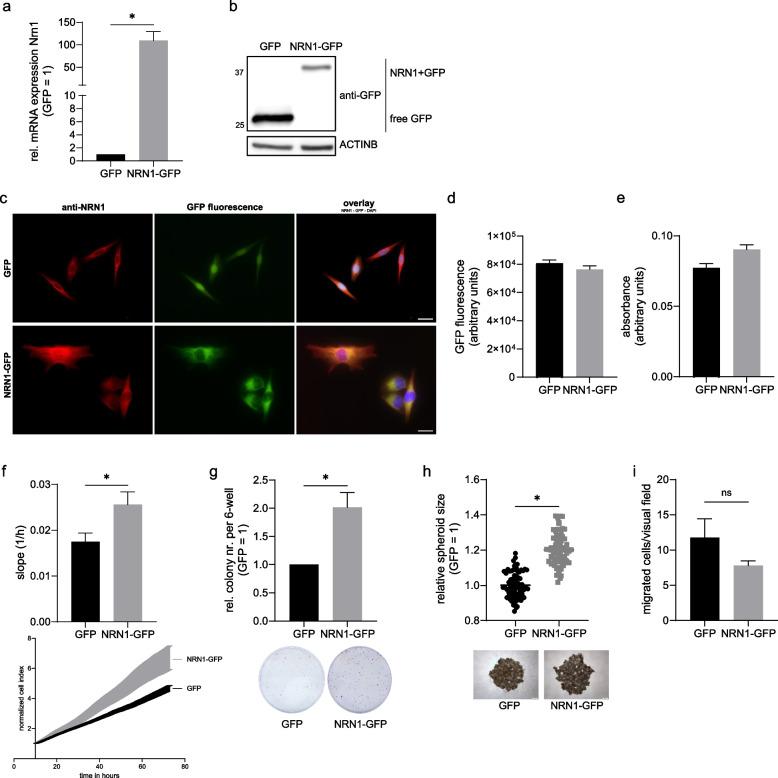
Methods: Using a cell culture model system with an NRN1 overexpression, we investigated the influence of NRN1 on melanoma cells' functionality and signaling. We employed real time cell analysis and spheroid formation assays, while for investigation of molecular mechanisms we used a kinase phosphorylation kit as well as promotor activity analysis followed by mRNA and protein analysis.

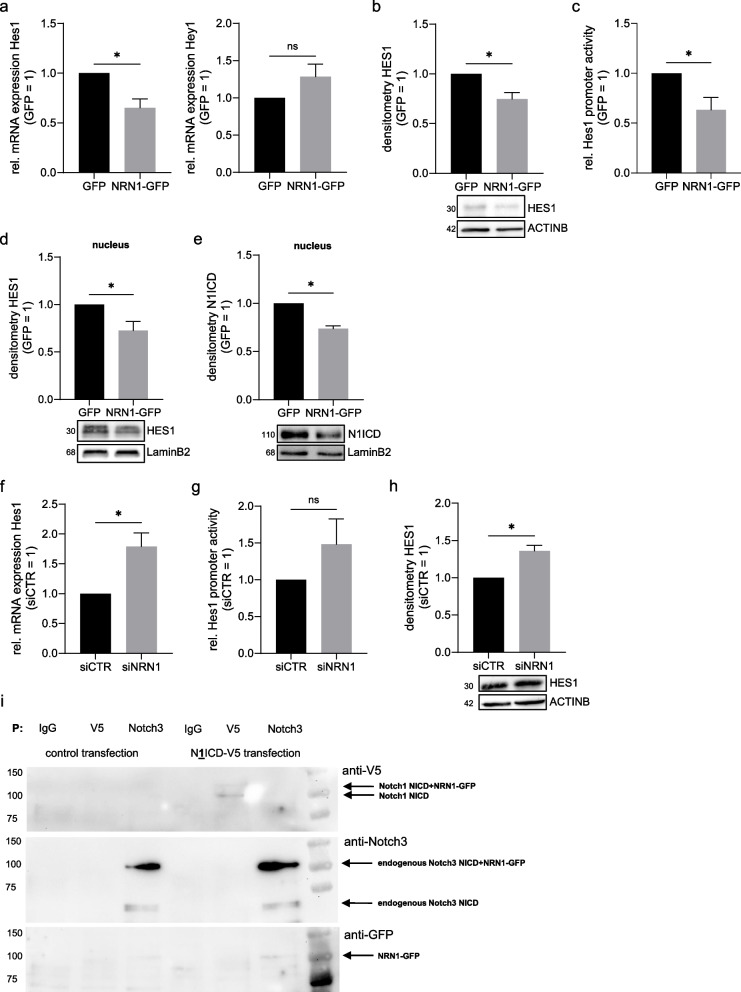
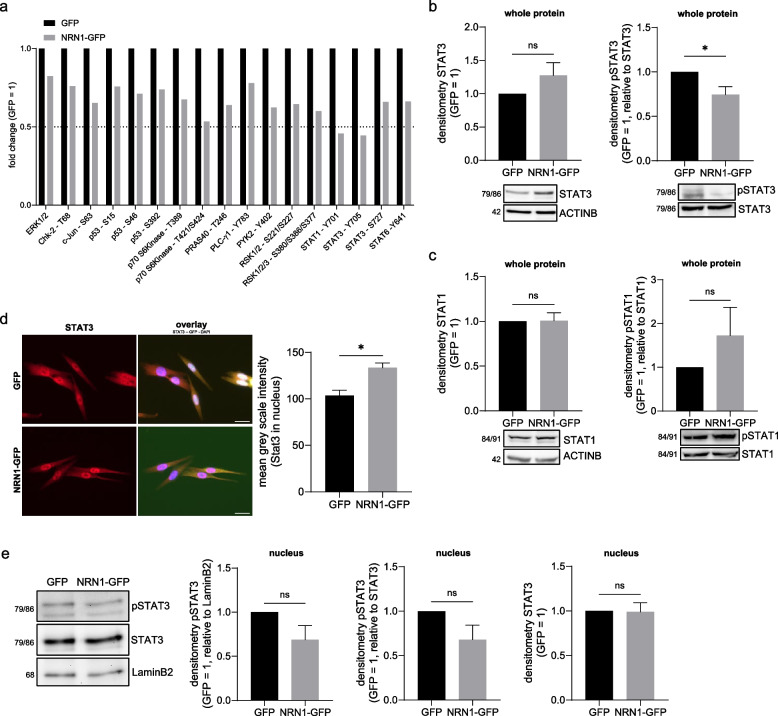
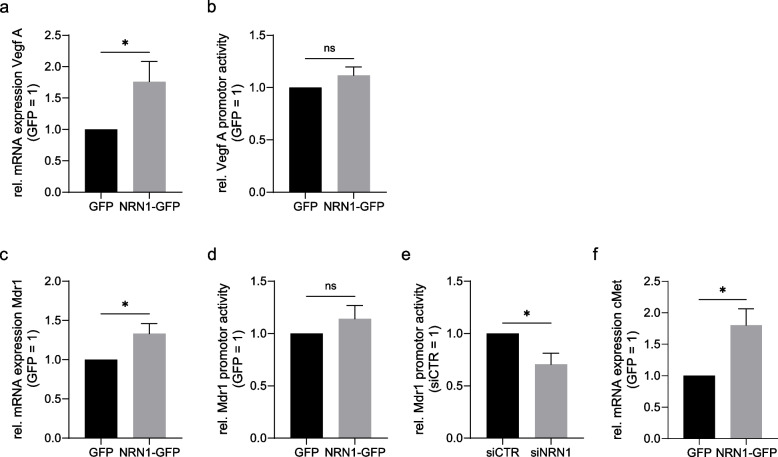
Results: We revealed that NRN1 interacts directly with the cleaved intracellular domain (NICD) of Notch1 and Notch3, causing a potential retention of NICD in the cytoplasm and thereby reducing the expression of its direct downstream target Hes1. This leads to decreased sequestration of JAK and STAT3 in a Hes1-driven phosphorylation complex. Consequently, our data shows less phosphorylation of STAT3 while presenting an accumulation of total protein levels of STAT3 in association with NRN1 overexpression. The potential of the STAT3 signaling pathway to act in both a tumor suppressive and oncogenic manner led us to investigate specific downstream targets - namely Vegf A, Mdr1, cMet - which were found to be upregulated under oncogenic levels of NRN1.

Conclusions: In summary, we were able to show that NRN1 links oncogenic signaling events between Notch and STAT3 in melanoma. We also suggest that in future research more attention should be payed to cellular regulation of signaling molecules outside of the classically known phosphorylation events.

Keywords: Melanoma; NRN1; Notch; STAT3.


Conflict of interest statement

The authors declare no competing interests.

Figures

Fig. 1
Fig. 1
Neuritin-1 expression in different cancers, progression states and in vivo. a Comparison of NRN1 RNA expression based on TCGA (The Cancer Genome Atlas) data sets of different cancers. Fragments per kilo base of transcript per million mapped reads (FPKM) displayed for cancer entities. Minimum of 134 samples (testis cancer) and maximum of 1075 samples (breast cancer) per entity. b NRN1 protein expression in cancer cell lines. Western blot of basal NRN1 protein levels of cell lines HTZ19d, MCF-7, Sbcl2 and WM9. GAPDH was used as equal loading control. c NRN1 reads in RNA sequencing of nevi-melanoma pairs. Number of reads for 10 paired sample sets from nevi and melanoma site of patients. Data obtained from Kunz et al., 2018 (GSE112509). Graph displays individual values of paired samples. Two groups were statistically analysed using paired Students t-test. * = p < 0.05, ns = p > 0.05. d qRT-PCR expression analysis of NRN1 in paired organ and brain metastasis cell lines. mRNA expression was normalized to β-actin. Samples were provided by Dana Westphal, Dresden. Graph displays individual values of paired samples. Two groups were statistically analysed using paired Students t-test. * = p < 0.05, ns = p > 0.05. e NRN1 levels in sera of melanoma patients. Concentration measured through ELISA in sera of melanoma patients with or without brain metastases. Patient sera obtained from Annette Paschen and the Dermatological Department at FAU. Graph displays individual values along with mean ± SEM. Two groups were statistically analysed using unpaired Students t-test unless stated otherwise. * = p < 0.05, ns = p > 0.05. f Kaplan-Meier survival curve analysis was performed using the GEPIA2 database for a TCGA Skin Cutaneous Melanoma (SKCM) dataset. The survival curve is depicted for the total patient cohort separated into `low NRN1` (black) versus `high NRN1` (grey) group (p = 0.1034)
Fig. 2
Fig. 2
Characterization of overexpression cell line – NRN1 expression and functional analyses. a Analysis of NRN1 mRNA levels in GFP and NRN1-GFP cell lines through qRT-PCR. Expression levels normalized to housekeeper β-actin. GFP set to 1. b Protein expression validation of NRN1-GFP through Western blot. Example blot of GFP and NRN1-GFP cell line protein extracts, probed with GFP primary antibody. Equal loading was controlled with β-actin primary antibody. c Immunofluorescence of fixed cells against NRN1. Intrinsic GFP fluorescence (green) with NRN1 primary antibody staining (red) and overlay including nuclear DAPI staining (blue). The bar in the overlay represents 20 µm. d GFP fluorescence measurement in cell culture supernatant. GFP fluorescence was measured at 515 nm. e ELISA for NRN1 with cell culture supernatants. Absorbance of staining solution was measured at 450 nm. f Proliferation analysis of model cell lines using RTCA. Proliferation was compared by slope. Growth curves of normalized cell index for GFP and NRN1-GFP. g Clonogenic assay of GFP and NRN1-GFP. Analysis of clonogenic ability of model system cell lines. GFP set to 1. Representative images of colonies 8 days after seeding, fixed and stained using crystal violet. h Spheroid formation on agar. Comparison of spheroid diameter of GFP and NRN1-GFP cells after 72 h. GFP set to 1. Representative images of spheroids after 72 h. i Migration analysis of cell lines using Boyden chambers. Comparison of number of migrated cell per visual field for GFP and NRN1-GFP. All graphs are displayed as mean ± SEM. Two groups were statistically analysed using unpaired Students t-test unless stated otherwise. * = p < 0.05, ns = p > 0.05
Fig. 3
Fig. 3
Notch signaling and downstream targets in overexpression cell line and under knock-down. a qRT-PCR of mRNA expression levels of Hes1 and Hey1. Comparison of Notch downstream target expression between GFP and NRN1-GFP. Expression levels normalized to β-actin. GFP set to 1. b Protein expression of HES1. Analysis of protein levels of HES1 in GFP and NRN1-GFP cell lines through Western blot. Equal loading was controlled with GAPDH primary antibody. GFP set to 1. c Luciferase assay for analysis of Hes1 promotor activity. Comparison of Hes1 promotor activity between GFP and NRN1-GFP. Measurements normalized to transfection control pRL-TK. GFP set to 1. d Protein expression of N1ICD in nuclear extracts. Western blot of nuclear fractions comparing GFP and NRN1-GFP. Equal loading was controlled with LaminB2 primary antibody. GFP set to 1. e Protein expression of HES1 in nuclear extracts. Western blot of nuclear fractions comparing GFP and NRN1-GFP. Equal loading was controlled with LaminB2 primary antibody. GFP set to 1. f Analysis of mRNA levels of Hes1 under siNRN1 knock-down. qRT-PCR comparing siCTR and siNRN1. Expression levels normalized to β-actin. siCTR set to 1. g Luciferase assay for analysis of Hes1 promotor activity under siNRN1 knock-down. Comparison of Hes1 promotor activity between siCTR and siNRN1. Measurements normalized to transfection control pRL-TK. siCTR set to 1. h Protein expression of HES1 under siNRN1 knock-down. Comparing protein levels of HES1 in siCTR and siNRN1 lysates through Western blot. Equal loading was controlled with β-actin primary antibody. siCTR set to 1. i Immunoprecipitation of NRN1-GFP lysates after transfection (control, N1ICD-V5). Lysates were pulled with IgG, V5 and Notch3 antibody. Western blot was probed with V5 primary antibody, Notch3 primary antibody and GFP primary antibody. Detected interaction complexes are denoted by black arrow. All graphs are displayed as mean ± SEM. Two groups were statistically analysed using unpaired Students t-test unless stated otherwise. * = p < 0.05, ns = p > 0.05
Fig. 4
Fig. 4
Influence of NRN1 overexpression on STATs and their phosphorylation status. a Downregulated targets of phosphospot array comparing GFP and NRN1-GFP lysates. Phosphorylation status of kinases and proteins with downregulation relative to GFP. Visualization line marks 0.5x fold change. GFP set to 1. b Protein expression levels of STAT3 and pSTAT3. Validation of phosphospot results using Western blot of whole cell lysates of GFP and NRN1-GFP. Equal loading for STAT3 was controlled by β-actin primary antibody. pSTAT3 expression was normalized to STAT3 expression. GFP set to 1. c Protein expression levels of STAT1 and pSTAT1 through Western blot. Comparison of STAT1 and pSTAT1 expression in whole cell lysates between GFP and NRN1-GFP. Equal loading for STAT1 was controlled by β-actin primary antibody. pSTAT1 expression was normalized to STAT1 expression. GFP set to 1. d Immunofluorescence of fixed cells against STAT3. GFP and NRN1-GFP with STAT3 primary antibody (red) and as overlay with intrinsic GFP (green) and nuclear stain DAPI (blue). Measurement of mean grey scale intensity of STAT3 fluorescence signal in nuclei (ROI defined by DAPI signal) comparing GFP with NRN1-GFP. e Protein expression analysis of pSTAT3 and STAT3 in nuclear extracts of GFP and NRN1-GFP. Western blot with pSTAT3 and STAT3 primary antibodies. LaminB2 primary antibody was used to control equal loading. Analysis of expression levels of pSTAT3 in nuclei, normalized to LaminB2 or STAT3 expression. Analysis of expression levels of STAT3 in nuclei, normalized to LaminB2. GFP set to 1. All graphs are displayed as mean ± SEM. Two groups were statistically analysed using unpaired Students t-test unless stated otherwise. * = p < 0.05, ns = p > 0.05
Fig. 5
Fig. 5
Expression of STAT3 targets under NRN1 overexpression. a qRT-PCR analysis of mRNA expression of Vegf A. Comparison of GFP and NRN1-GFP. Expression levels normalized to β-actin. GFP set to 1. b Vegf A promotor activity analysis. Luciferase-based assay comparing Vegf A promotor activity of GFP and NRN1-GFP cells. Measurements normalized to transfection control pRL-TK. GFP set to 1. c mRNA analysis of Mdr1 in GFP and NRN1-GFP cells through qRT-PCR. Expression levels normalized to β-actin. GFP set to 1. d Mdr1 promotor activity analysis using Luciferase-based assay comparing GFP and NRN1-GFP cells. Measurements normalized to transfection control pRL-TK. GFP set to 1. e Mdr1 promotor activity analysis using Luciferase-based assay comparing siCTR and siNRN1 knockdown cells. Measurements normalized to transfection control pRL-TK. siCTR set to 1. f cMet mRNA expression analysis using qRT-PCR of GFP and NRN1-GFP. GFP set to 1. All graphs are displayed as mean ± SEM. Two groups were statistically analysed using unpaired Students t-test unless stated otherwise. * = p < 0.05, ns = p > 0.05

Similar articles

Cited by

References

    1. Moschos SJ. Melanoma brain metastases: an update on the use of immune checkpoint inhibitors and molecularly targeted agents. Am J Clin Dermatol. 2022;23(4):523–45. doi: 10.1007/s40257-022-00678-z. - DOI - PubMed
    1. Patton EE, Mueller KL, Adams DJ, Anandasabapathy N, Aplin AE, Bertolotto C, et al. Melanoma models for the next generation of therapies. Cancer Cell. 2021;39(5):610–31. doi: 10.1016/j.ccell.2021.01.011. - DOI - PMC - PubMed
    1. Artinger KB, Monsoro-Burq AH. Neural crest multipotency and specification: power and limits of single cell transcriptomic approaches. Fac Rev. 2021;10:38. doi: 10.12703/r/10-38. - DOI - PMC - PubMed
    1. Nedivi E, Hevroni D, Naot D, Israeli D, Citri Y. Numerous candidate plasticity-related genes revealed by differential cDNA cloning. Nature. 1993;363(6431):718–22. doi: 10.1038/363718a0. - DOI - PubMed
    1. Naeve GS, Ramakrishnan M, Kramer R, Hevroni D, Citri Y, Theill LE. Neuritin: a gene induced by neural activity and neurotrophins that promotes neuritogenesis. Proc Natl Acad Sci U S A. 1997;94(6):2648–53. doi: 10.1073/pnas.94.6.2648. - DOI - PMC - PubMed

Publication types