. 2024 May 2;34(5):bhae179.
doi: 10.1093/cercor/bhae179.

Distinct neural markers of evidence accumulation index metacognitive processing before and after simple visual decisions

Affiliations

Distinct neural markers of evidence accumulation index metacognitive processing before and after simple visual decisions

Caleb Stone et al. Cereb Cortex. .

Abstract

Perceptual decision-making is affected by uncertainty arising from the reliability of incoming sensory evidence (perceptual uncertainty) and the categorization of that evidence relative to a choice boundary (categorical uncertainty). Here, we investigated how these factors impact the temporal dynamics of evidence processing during decision-making and subsequent metacognitive judgments. Participants performed a motion discrimination task while electroencephalography was recorded. We manipulated perceptual uncertainty by varying motion coherence, and categorical uncertainty by varying the angular offset of motion signals relative to a criterion. After each trial, participants rated their desire to change their mind. High uncertainty impaired perceptual and metacognitive judgments and reduced the amplitude of the centro-parietal positivity, a neural marker of evidence accumulation. Coherence and offset affected the centro-parietal positivity at different time points, suggesting that perceptual and categorical uncertainty affect decision-making in sequential stages. Moreover, the centro-parietal positivity predicted participants' metacognitive judgments: larger predecisional centro-parietal positivity amplitude was associated with less desire to change one's mind, whereas larger postdecisional centro-parietal positivity amplitude was associated with greater desire to change one's mind, but only following errors. These findings reveal a dissociation between predecisional and postdecisional evidence processing, suggesting that the CPP tracks potentially distinct cognitive processes before and after a decision.

Keywords: centro-parietal positivity; decision-making; electroencephalography; metacognition; motion discrimination.


Figures

Fig. 1
Fig. 1
a) Example trial sequence from the motion discrimination task. Each trial began with a period of random dot motion randomly drawn from a uniform distribution of between 350 to 650 ms in 10 ms steps. Random motion was followed by coherent motion until response or for maximally 1500 ms. If a response was made, the dots stopped moving and remained stationary at a lower opacity for the remainder of the trial. A fixation cross was then displayed for 850 ms, after which the CoM display was shown until response or for maximally 2000 ms. b) The task manipulations. During the coherent motion period, the coherence of the dot motion (i.e. the probability that the dots would move in the specified direction) and its angular offset from the criterion orientation were pseudo-randomly selected per trial to induce greater uncertainty (i.e. low coherence and/or small offset) or lesser uncertainty (i.e. high coherence and/or large offset).
Fig. 2
Fig. 2
Boxplots of a) accuracy and b) reaction time split by coherence and offset conditions. In both panels, filled circles denote the mean and semi-transparent circles denote individual participants. For visualization, between-participant variability was removed using previously described methods (Morey 2008).
Fig. 3
Fig. 3
a) Histograms of raw CoM scores for 2 example participants, highlighting substantial individual differences. b) Histogram of Z-scored CoM scores for error (orange) and correct (gray) trials. c) Boxplots of Z-scored CoM scores split by coherence and offset conditions. d) Boxplots of Z-scored CoM differences (error − correct) split by coherence and offset conditions. Note that in panels c and d conventions are as in Fig. 2.
Fig. 4
Fig. 4
a) Topographic maps of EEG activity during the stimulus-locked (top) and response-locked (bottom) epochs. b) Fronto-central positivity spilt by coherence for stimulus-locked (left) and response-locked (right) epochs. Inset shows electrode cluster used for analysis (i.e. Fz, FCz, Cz, FC1, and FC2). c) Same as b but split by offset. In all panels, the gray line shows the difference between conditions with standard errors. Vertical colored lines in stimulus-locked epochs denote mean reaction time for the color-matched condition in legend. Vertical dashed lines in response-locked epochs denote response time. Horizontal black lines denote periods of statistical significance for fixed effects of condition (P < 0.05; residual degrees of freedom for stimulus- and response-locked models were 35,122 and 33,149, respectively), FDR corrected for multiple comparisons. Error bands denote normalized 95% confidence intervals as per (Morey 2008). Data were smoothed using a Gaussian window (SD = 16 ms) for visualization only.
Fig. 5
Fig. 5
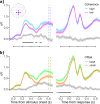
a) CPP spilt by coherence for stimulus-locked (left) and response-locked (right) epochs. Inset shows electrode cluster used for analysis (i.e. Cz, CPz, Pz, CP1, and CP2). b) Same as a but split by offset. Conventions as in Fig. 4.
Fig. 6
Fig. 6
Trial-wise regressions of CoM score onto residual CPP amplitude and response accuracy after having regressed out the influence of coherence and offset for stimulus-locked (left) and response-locked (right) epochs. Error bars denote standard error. Horizontal colored bars denote periods of statistical significance for fixed-effect of residual CPP amplitude at the color-matched level of response accuracy (P < 0.05; residual degrees of freedom for stimulus- and response-locked models were 32,835 and 32,757, respectively). Gray shading denotes periods of significant interaction between response accuracy and residual CPP amplitude. All statistical tests are FDR corrected for multiple comparisons.

References

    1. Atiya N, Zgonnikov A, O’Hora D, Schoemann M, Scherbaum S, Wong-Lin KF. Changes-of-mind in the absence of new post-decision evidence. PLoS Comput Biol. 2020:16(2):e1007149. 10.1371/journal.pcbi.1007149. - DOI - PMC - PubMed
    1. Bang D, Fleming SM. Distinct encoding of decision confidence in human medial prefrontal cortex. PNAS. 2018:115(23):6082–6087. 10.1073/pnas.1800795115. - DOI - PMC - PubMed
    1. Bang D, Kishida KT, Lohrenz T, White JP, Laxton AW, Tatter SB, Fleming SM, Montague PR. Sub-second dopamine and serotonin signaling in human striatum during perceptual decision-making. Neuron. 2020:108(5):999–1010.e6. 10.1016/j.neuron.2020.09.015. - DOI - PMC - PubMed
    1. Barca L, Pezzulo G. Tracking second thoughts: continuous and discrete revision processes during visual lexical decision. PLoS One. 2015:10(2):1–14. 10.1371/journal.pone.0116193. - DOI - PMC - PubMed
    1. Bates D, Mächler M, Bolker BM, Walker SC. Fitting linear mixed-effects models using lme4. J Stat Softw. 2015:67(1):1–48. 10.18637/jss.v067.i01. - DOI

Publication types