STZ-induced gestational diabetes exposure alters PTEN/AKT/mTOR-mediated autophagy signaling pathway leading to increase the risk of neonatal hypoxic-ischemic encephalopathy
- PMID: 38706688
- PMCID: PMC11068333
- DOI: 10.1016/j.reprotox.2023.108494
STZ-induced gestational diabetes exposure alters PTEN/AKT/mTOR-mediated autophagy signaling pathway leading to increase the risk of neonatal hypoxic-ischemic encephalopathy
Abstract
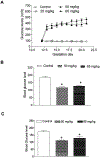
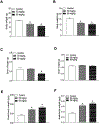
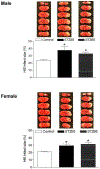
Exposure to gestational diabetes mellitus (GDM) during pregnancy has significant consequences for the unborn baby and newborn infant. However, whether and how GDM exposure induces the development of neonatal brain hypoxia/ischemia-sensitive phenotype and the underlying molecular mechanisms remain unclear. In this study, we used a late GDM rat model induced by administration of streptozotocin (STZ) on gestational day 12 and investigated its effects of GDM on neonatal brain development. The pregnant rats exhibited increased blood glucose levels in a dose-dependent manner after STZ administration. STZ-induced maternal hyperglycemia led to reduced blood glucose levels in neonatal offspring, resulting in growth restriction and an increased brain to body weight ratio. Importantly, GDM exposure increased susceptibility to hypoxia/ischemia (HI)-induced brain infarct sizes compared to the controls in both male and female neonatal offspring. Further molecular analysis revealed alterations in the PTEN/AKT/mTOR/autophagy signaling pathway in neonatal male offspring brains, along with increased ROS production and autophagy-related proteins (Atg5 and LC3-II). Treatment with the PTEN inhibitor bisperoxovanadate (BPV) eliminated the differences in HI-induced brain infarct sizes between the GDM-exposed and the control groups. These findings provide novel evidence of the development of a brain hypoxia/ischemia-sensitive phenotype in response to GDM exposure and highlight the role of the PTEN/AKT/mTOR/autophagy signaling pathway in this process.
Keywords: GDM; PTEN/AKT/mTOR; autophagy; neonatal brain ischemia-sensitive phenotype.
Conflict of interest statement
Declaration of Competing Interest The authors have declared that no known competing financial interests or personal relationships that could have appeared to influence the work reported in the paper.
Figures


Similar articles
-
Perinatal nicotine exposure alters Akt/GSK-3β/mTOR/autophagy signaling, leading to development of hypoxic-ischemic-sensitive phenotype in rat neonatal brain.Am J Physiol Regul Integr Comp Physiol. 2019 Dec 1;317(6):R803-R813. doi: 10.1152/ajpregu.00218.2019. Epub 2019 Sep 25. Am J Physiol Regul Integr Comp Physiol. 2019. PMID: 31553625 Free PMC article.
-
Fatty acid binding protein 4 knockdown improves fetal development in rats with gestational diabetes mellitus through modulating autophagy mediated by the PTEN/Akt/mTOR signaling pathway.J Mol Histol. 2025 Mar 29;56(2):124. doi: 10.1007/s10735-025-10398-3. J Mol Histol. 2025. PMID: 40156622
-
Fetal e-cigarette exposure programs a neonatal brain hypoxic-ischemic sensitive phenotype via altering DNA methylation patterns and autophagy signaling pathway.Am J Physiol Regul Integr Comp Physiol. 2021 Nov 1;321(5):R791-R801. doi: 10.1152/ajpregu.00207.2021. Epub 2021 Sep 15. Am J Physiol Regul Integr Comp Physiol. 2021. PMID: 34524928 Free PMC article.
-
Epigenetic Down-Regulation of Sirt 1 via DNA Methylation and Oxidative Stress Signaling Contributes to the Gestational Diabetes Mellitus-Induced Fetal Programming of Heart Ischemia-Sensitive Phenotype in Late Life.Int J Biol Sci. 2019 May 11;15(6):1240-1251. doi: 10.7150/ijbs.33044. eCollection 2019. Int J Biol Sci. 2019. PMID: 31223283 Free PMC article.
-
G-CSF attenuates neuroinflammation and neuronal apoptosis via the mTOR/p70SK6 signaling pathway in neonatal Hypoxia-Ischemia rat model.Brain Res. 2020 Jul 15;1739:146817. doi: 10.1016/j.brainres.2020.146817. Epub 2020 Apr 1. Brain Res. 2020. PMID: 32246916
Cited by
-
Deciphering DNA Methylation in Gestational Diabetes Mellitus: Epigenetic Regulation and Potential Clinical Applications.Int J Mol Sci. 2024 Aug 29;25(17):9361. doi: 10.3390/ijms25179361. Int J Mol Sci. 2024. PMID: 39273309 Free PMC article. Review.
-
Therapeutic Potential of Thunbergia laurifolia L. Extract in Gestational Diabetes Mellitus: Insights from a Rat Model.Chin J Integr Med. 2024 Sep;30(9):788-798. doi: 10.1007/s11655-024-3764-y. Epub 2024 Jun 28. Chin J Integr Med. 2024. PMID: 38941042
-
Potential of Pandan Root and Teak Leaf Extracts in Managing Maternal Hyperglycemia During Pregnancy: Comparative Efficacy and Mechanistic Insights.Int J Mol Sci. 2025 Jun 9;26(12):5506. doi: 10.3390/ijms26125506. Int J Mol Sci. 2025. PMID: 40564970 Free PMC article.
-
LncRNA NEAT1 sponges miR-214-3p to promote osteoblast differentiation through regulating the PI3K/AKT/mTOR pathway in aortic valve calcification.Sci Rep. 2025 Apr 21;15(1):13665. doi: 10.1038/s41598-025-98578-9. Sci Rep. 2025. PMID: 40258988 Free PMC article.
References
-
- Vuong B, Odero G, Rozbacher S, Stevenson M, Kereliuk SM, Pereira TJ, Dolinsky VW, Kauppinen TM. Exposure to gestational diabetes mellitus induces neuroinflammation, derangement of hippocampal neurons, and cognitive changes in rat offspring. J Neuroinflammation. 2017. Apr 7;14(1):80. doi: 10.1186/s12974-017-0859-9. - DOI - PMC - PubMed
Publication types
MeSH terms
Substances
Grants and funding
LinkOut - more resources
Full Text Sources
Research Materials
Miscellaneous

