. 2024 Apr 12;27(5):109735.
doi: 10.1016/j.isci.2024.109735. eCollection 2024 May 17.

Glucose starvation causes ferroptosis-mediated lysosomal dysfunction

Affiliations

Glucose starvation causes ferroptosis-mediated lysosomal dysfunction

Kenji Miki et al. iScience. .

Abstract

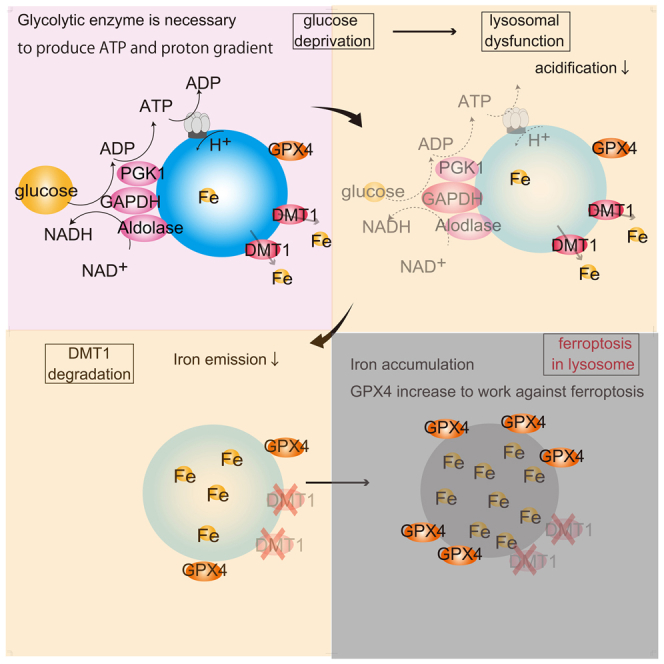
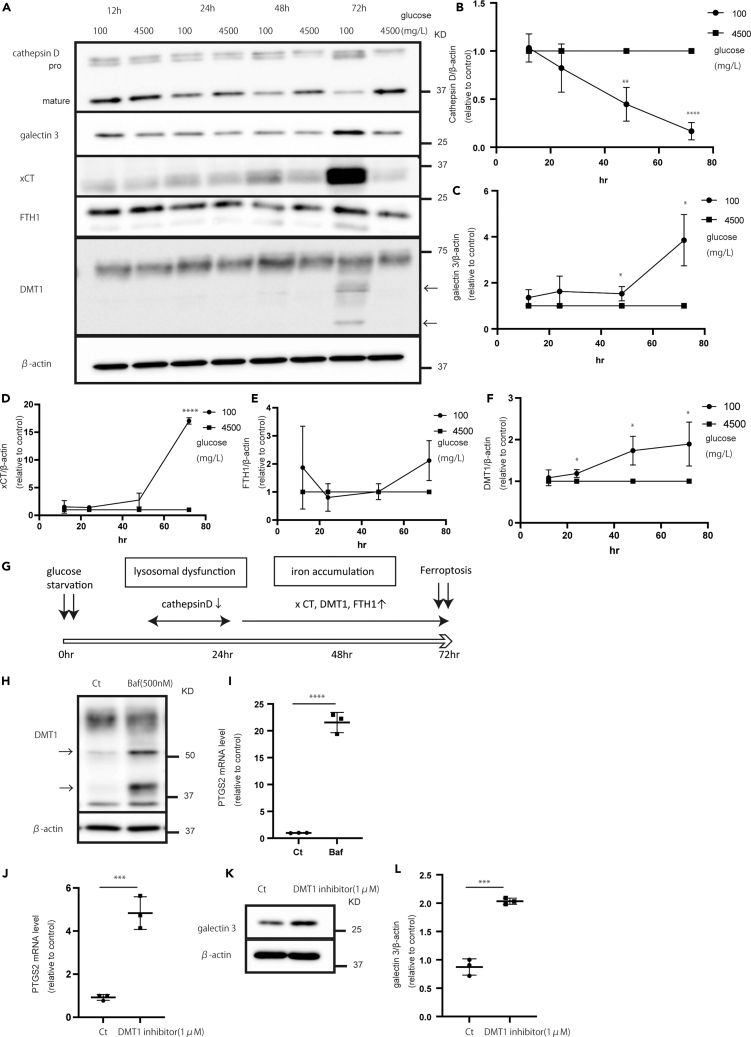
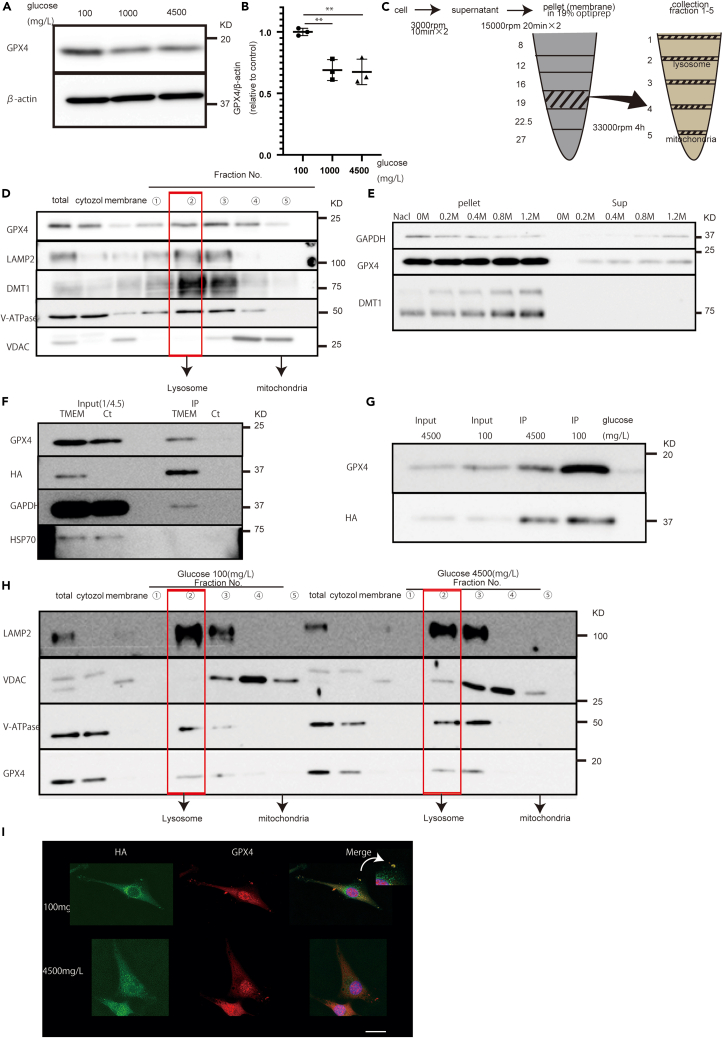
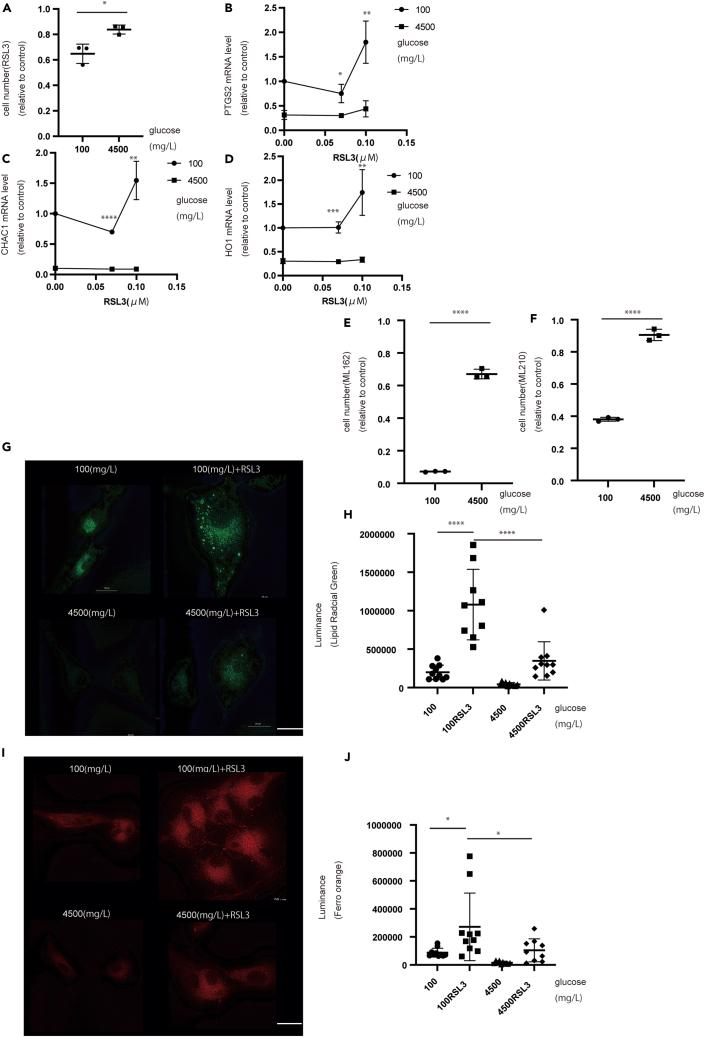
Lysosomes, the hub of metabolic signaling, are associated with various diseases and participate in autophagy by supplying nutrients to cells under nutrient starvation. However, their function and regulation under glucose starvation remain unclear and are studied herein. Under glucose starvation, lysosomal protein expression decreased, leading to the accumulation of damaged lysosomes. Subsequently, cell death occurred via ferroptosis and iron accumulation due to DMT1 degradation. GPX4, a key factor in ferroptosis inhibition located on the outer membrane of lysosomes, accumulated in lysosomes, especially under glucose starvation, to protect cells from ferroptosis. ALDOA, GAPDH, NAMPT, and PGK1 are also located on the outer membrane of lysosomes and participate in lysosomal function. These enzymes did not function effectively under glucose starvation, leading to lysosomal dysfunction and ferroptosis. These findings may facilitate the treatment of lysosomal-related diseases.

Keywords: Cell biology; Cellular physiology; Functional aspects of cell biology.


Conflict of interest statement

The authors declare that they have no conflict of interest.

Figures

None
Graphical abstract
Figure 1
Figure 1
Glucose starvation increases the expression of autophagy-related proteins and decreases the expression of lysosomal proteins in U87 cells (A) Expression of autophagy-related proteins (p62 and LC3) under each glucose concentration for 72 h. (B and C) Quantification of (B) p62 and (C) LC3. (D) Expression of lysosomal proteins (mature cathepsin B and D, LAMP2, and LGALS3). (E–H) Quantification of (E) LAMP2, (F) mature cathepsin B, (G) mature cathepsin D, and (H) LGALS3. (I) Cathepsin D activity decreased under glucose starvation in U87 cells. (J and K) DALGreen/DAPRed fluorescence (J) showed lower intensity under glucose starvation and (K) its quantification in U87 cells. (L) Morphology of p62 and LAMP2 under glucose starvation. (M) Quantification of LAMP2 area in U87 cells. Scale bars: 20 μm. Values are presented as mean ± SD. One-way ANOVA and Turkey’s multiple comparison test were performed to assess 100 vs. 1,000 vs. 4,500 mg/L of glucose. p < 0.05; ∗∗p < 0.01; ∗∗∗p < 0.001; ∗∗∗∗p < 0.0001.
Figure 2
Figure 2
Glucose starvation induces significant changes in iron-related proteins (A) Expression of iron-related proteins in U87 cells under each glucose concentration for 72 h. (B–E) Quantification of (B) TFRC, (C) XCT, (D) FTH1, and (E) DMT1. (F–H) Quantification of (F) PTGS2, (G) CHAC1, and (H) HO-1. (I–K) Quantification of (I) GSSG, (J) GSH, and (K) GSH/GSSG. (L) LipiRADICAL Green fluorescence intensity was higher under glucose starvation. (M) Quantification of LipiRADICAL Green fluorescence. (N) FerroOrange fluorescence under glucose starvation and its quantification. (O and P) LipiRADICAL Green and LysoTracker red co-localization. (Q) LysoPrime Green and FerroOrange co-localization. Scale bars: 20 μm. Values are presented as mean ± SD. One-way ANOVA and Tukey’s multiple comparison test were performed to assess 100 vs. 1,000 vs. 4,500 mg/L of glucose. p < 0.05; ∗∗p < 0.01; ∗∗∗p < 0.001; ∗∗∗∗p < 0.0001.
Figure 3
Figure 3
Time-course experiments of lysosomal function and iron dynamics (A) Expression of lysosomal- and iron-related proteins in U87 cells. (B–F) Quantification of (B) mature cathepsin D, (C) LGALS3, (D) XCT, (E) FTH1, and (F) DMT1. (G) Time-course experiments of lysosomal dysfunction and iron dynamics. Values are presented as mean ± SD. One-way ANOVA and Tukey’s multiple comparison test were performed to assess 100 vs. 4,500 mg/L of glucose. p < 0.05; ∗∗p < 0.01; ∗∗∗∗p < 0.0001. (H and I) Expression of (H) DMT1 after the addition of BafA1 (500 nM) for 48 h and (I) quantification of PTGS2. (J) Quantification of PTGS2 using DMT1 blocker (1 μM) for 72 h. (K and L) Expression of (K) LGALS3 and (L) its quantification using DMT1 blocker. Values are presented as mean ± SD. One-way ANOVA and Tukey’s multiple comparison test were performed to assess 100 vs. 4,500 mg/L of glucose. p < 0.05; ∗∗p < 0.01; ∗∗∗∗p < 0.0001.
Figure 4
Figure 4
Increased GPX4 expression and localization in the lysosomal fraction of U87 cells under glucose starvation (A) Expression of (A) GPX4 and (B) its quantification under each glucose concentration for 72 h. (C) Schematic of the purification of lysosomes by centrifugation. (D) Protein localization using fractionation experiments. (E) Protein expression at different salt concentrations. (F) Immunoprecipitation using TMEM192-transfected cells and lysosomal expression. (G) Immunoprecipitation using TMEM192-transfected cells under different glucose concentrations for 72 h. (H) Fraction difference between glucose starvation and glucose-rich conditions. (I) GPX4 immunostaining shows only glucose starvation, and co-localization of GPX4 and HA. Scale bars: 20 μm. Values are presented as mean ± SD. One-way ANOVA and Tukey’s multiple comparison test were performed to assess 100 vs. 1,000 vs. 4,500 mg/L of glucose. ∗∗p < 0.01.
Figure 5
Figure 5
GPX4 inhibitors promote cell death under glucose starvation (A) Cell number at each concentration of glucose (72 h) and RSL3 (24 h) in U87 cells. (B–D) Quantification of (B) PTGS2, (C) CHAC1, and (D) HO-1 at each concentration of glucose (72 h) and RSL3 (48 h). (E and F) Cell number at each concentration of glucose (72 h) and (E) ML162 and (F) ML210. (G) LipiRADICAL Green staining increased with RSL3, especially under glucose starvation. (H) Quantification of LipiRADICAL Green staining after 72 h. (I) FerroOrange staining increased with RSL3, especially under glucose starvation. (J) Quantification of FerroOrange staining. Scale bars: 20 μm. Values are presented as mean ± SD. One-way ANOVA and Tukey’s multiple comparison test were performed to assess 100 vs. 4,500 mg/L of glucose + RSL3. p < 0.05; ∗∗p < 0.01; ∗∗∗p < 0.001; ∗∗∗∗p < 0.0001.
Figure 6
Figure 6
mTOR increases under glucose starvation causing lysosomal dysfunction (A) Expression of mTOR: mTOR increases under glucose starvation for 72 h in U87 cells. (B) Quantification of mTOR. (C) Immunoprecipitation of mTOR only in TMEM192-transfected cells. (D) Lysosomal mTOR increased under glucose starvation for 72 h. (E) mTOR and LAMP2 co-localization. (F) Rapamycin increased the expression of mature cathepsin D. (G) Quantification of cathepsin D expression after 72 h. (H) PTGS2 decreased under glucose starvation. (I and J) Cell number increased with (J) rapamycin treatment and (K) its quantification. (K and L) LipiRADICAL Green staining decreased with (L) rapamycin treatment and (M) its quantification after 72 h. (M) Schematic of changes in mTOR under glucose starvation. Scale bars: 20 μm. Values are presented as mean ± SD. One-way ANOVA and Tukey’s multiple comparison test were performed to assess 100 vs. 1,000 vs. 4,500 mg/L of glucose or control vs. rapamycin treatment. p < 0.05; ∗∗p < 0.01.
Figure 7
Figure 7
ALDOA, PGK1, and NAMPT are present in lysosomes and are important for lysosomal function and FK866 induces ferroptosis (A) ALDOA, PGK1, and NAMPT are present in the lysosomal fraction of U87 cells. (B) Immunoprecipitation experiments showed that ALDOA and PGK1 are present in TMEM192-transfected cells. (C) LAMP2 and HSP70 expression in each fraction of purified lysosomes. (D) Fluorescence in each group with or without substrate and inhibitor. (E) NAMPT increased under glucose starvation for 72 h. (F) NAMPT quantification. (G) NAMPT was present in TMEM192-transfected cells. (H and I) Expression of (H) PTGS2 and (I) HO-1 after the addition of FK866 (48 h). (J) LipiRADICAL Green staining decreased with increasing FK866. (K) Quantification of LipiRADICAL Green fluorescence. (L) Schematic of NAMPT localization in lysosomes. Scale bars: 20 μm. Values are presented as mean ± SD. One-way ANOVA and Tukey’s multiple comparison test were performed to assess 100 vs. 1,000 vs. 4,500 mg/L of glucose or control vs. FK866 treatment. p < 0.05; ∗∗p < 0.01; ∗∗∗p < 0.001.

References

    1. Hirayama A., Kami K., Sugimoto M., Sugawara M., Toki N., Onozuka H., et al. Quantitative Metabolome Profiling of Colon and Stomach Cancer Microenvironment by Capillary Electrophoresis Time-Of-Flight Mass Spectrometry. Cancer Res. 2009;69:4918–4925. doi: 10.1158/0008-5472.CAN-08-4806. - DOI - PubMed
    1. Kumar V., Kim S.H., Bishayee K. Dysfunctional Glucose Metabolism in Alzheimer’s Disease Onset and Potential Pharmacological Interventions. Int. J. Mol. Sci. 2022;23:9540. doi: 10.3390/ijms23179540. - DOI - PMC - PubMed
    1. Rabinowitz J.D., White E. Autophagy and Metabolism. Science. 2010;330:1344–1348. doi: 10.1126/science.1193497. - DOI - PMC - PubMed
    1. Schröder B.A., Wrocklage C., Hasilik A., Saftig P. The Proteome of Lysosomes. Proteomics. 2010;10:4053–4076. doi: 10.1002/pmic.201000196. - DOI - PubMed
    1. Yim W.W.Y., Mizushima N. Lysosome Biology in Autophagy. Cell Discov. 2020;6:6. doi: 10.1038/s41421-020-0141-7. - DOI - PMC - PubMed