

Identification of SOCS3 and PTGS2 as new biomarkers for the diagnosis of gout by cross-species comprehensive analysis
- PMID: 38707281
- PMCID: PMC11066387
- DOI: 10.1016/j.heliyon.2024.e30020
Identification of SOCS3 and PTGS2 as new biomarkers for the diagnosis of gout by cross-species comprehensive analysis
Abstract
Background: Gout is the most common inflammatory arthritis in adults. Gout is an arthritic disease caused by the deposition of monosodium urate crystal (MSU) in the joints, which can lead to acute inflammation and damage adjacent tissue. Hyperuricemia is the main risk factor for MSU crystal deposition and gout. With the increasing burden of gout disease, the identification of potential biomarkers and novel targets for diagnosis is urgently needed.
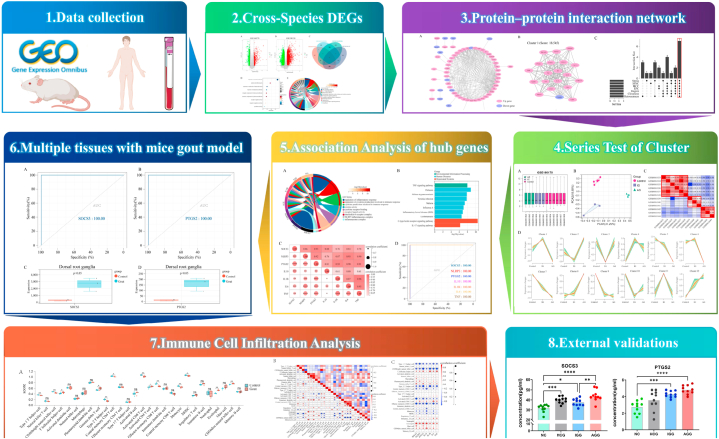
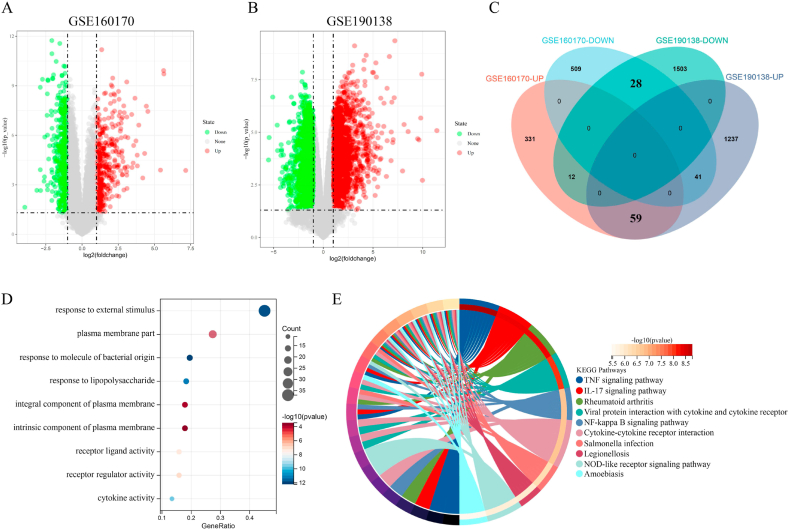
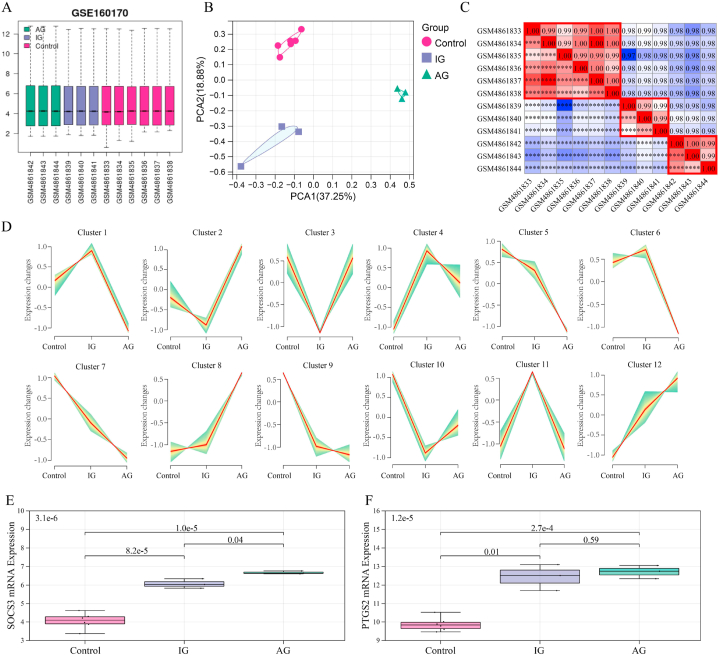
Methods: For the analysis of this subject paper, we downloaded the human gout data set GSE160170 and the gout mouse model data set GSE190138 from the GEO database. To obtain the differentially expressed genes (DEGs), we intersected the two data sets. Using the cytohubba algorithm, we identified the key genes and enriched them through GO and KEGG. The gene expression trends of three subgroups (normal control group, intermittent gout group and acute gout attack group) were analyzed by Series Test of Cluster (STC) analysis, and the key genes were screened out, and the diagnostic effect was verified by ROC curve. The expression of key genes in dorsal root nerve and spinal cord of gout mice was analyzed. Finally, the clinical samples of normal control group, hyperuricemia group, intermittent gout group and acute gout attack group were collected, and the expression of key genes at protein level was verified by ELISA.
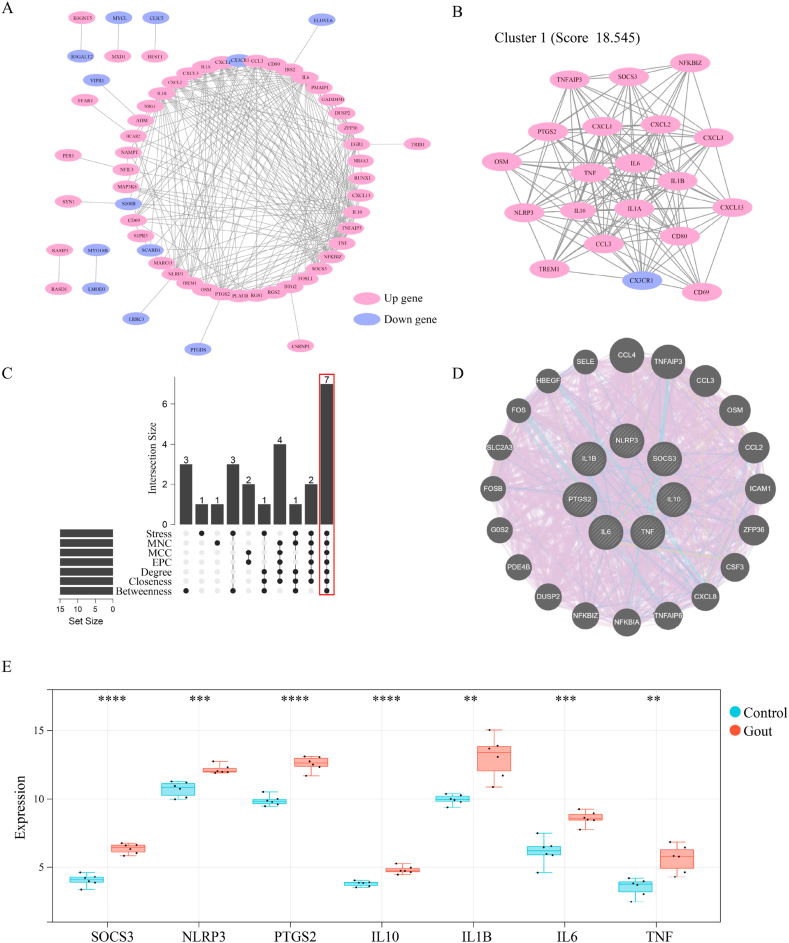
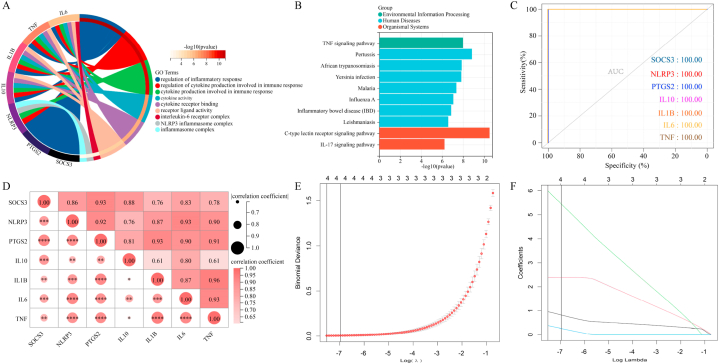
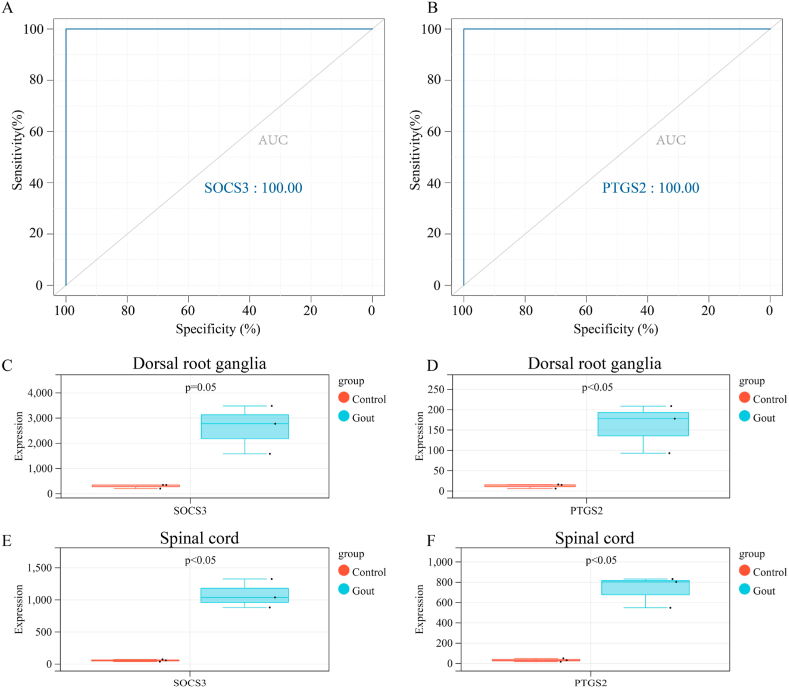
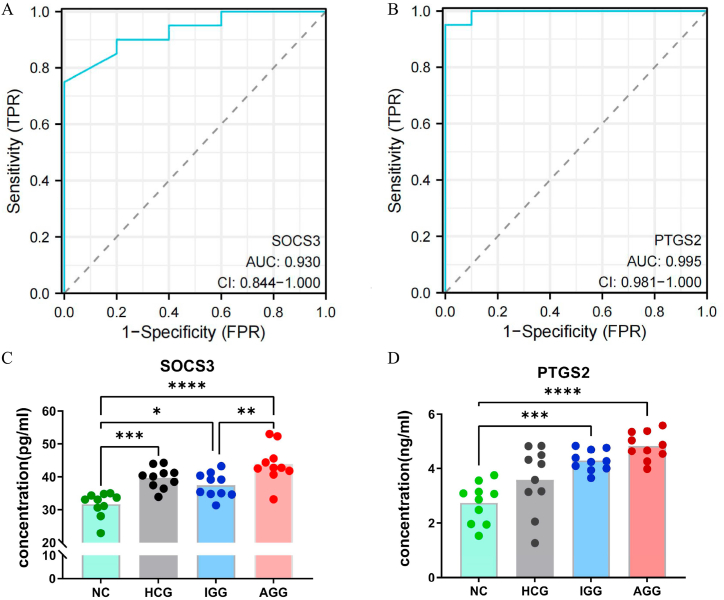
Result: We obtained 59 co-upregulated and 28 co-downregulated genes by comparing the DEGs between gout mouse model data set and human gout data set. 7 hub DEGs(IL1B, IL10, NLRP3, SOCS3, PTGS2) were screened out via Cytohubba algorithm. The results of both GO and KEGG enrichment analyses indicate that 7 hub genes play a significant role in regulating the inflammatory response, cytokine production in immune response, and the TNF signaling pathway. The most representative hub genes SOCS3 and PTGS2 were screened out by Series Test of Cluster, and ROC analysis results showed the AUC values were both up to 1.000. In addition, we found that PTGS2 expression was significantly elevated in the dorsal root ganglia and spinal cord in monosodium urate(MSU)-induced gout mouse model. The ELISA results revealed that the expression of SOCS3 and PTGS2 was notably higher in the acute gout attack and intermittent gout groups compared to the normal control group. This difference was statistically significant, indicating a clear distinction between the groups.
Conclusion: Through cross-species comprehensive analysis and experimental verification, SOCS3 and PTGS2 were proved to be new biomarkers for diagnosing gout and predicting disease progression.
Keywords: Biomarkers; Cross-species; Diagnostic; Gout; PTGS2; SOCS3.
© 2024 The Authors. Published by Elsevier Ltd.
Conflict of interest statement
The authors declare that they have no known competing financial interests or personal relationships that could have appeared to influence the work reported in this paper.
Figures
Similar articles
-
Identification of Inflammation-Related Biomarker Pro-ADM for Male Patients With Gout by Comprehensive Analysis.Front Immunol. 2022 Jan 18;12:798719. doi: 10.3389/fimmu.2021.798719. eCollection 2021. Front Immunol. 2022. PMID: 35116032 Free PMC article.
-
Key Genes Associated with Pyroptosis in Gout and Construction of a miRNA-mRNA Regulatory Network.Cells. 2022 Oct 17;11(20):3269. doi: 10.3390/cells11203269. Cells. 2022. PMID: 36291136 Free PMC article.
-
Transcriptomic Analysis of THP-1 Cells Exposed by Monosodium Urate Reveals Key Genes Involved in Gout.Comb Chem High Throughput Screen. 2024;27(18):2741-2752. doi: 10.2174/0113862073262471231011043339. Comb Chem High Throughput Screen. 2024. PMID: 37855355
-
Genetic and Epigenetic Regulation of the Innate Immune Response to Gout.Immunol Invest. 2023 Apr;52(3):364-397. doi: 10.1080/08820139.2023.2168554. Epub 2023 Feb 6. Immunol Invest. 2023. PMID: 36745138 Review.
-
Gout: epitome of painful arthritis.Metabolism. 2010 Oct;59 Suppl 1:S32-6. doi: 10.1016/j.metabol.2010.07.009. Metabolism. 2010. PMID: 20837191 Review.
Cited by
-
Exploring Therapeutic Potential of Bi-Qi Capsules in Treatment of Gout by Discovering Crucial Drug Targets.Pharmaceuticals (Basel). 2025 Apr 24;18(5):618. doi: 10.3390/ph18050618. Pharmaceuticals (Basel). 2025. PMID: 40430440 Free PMC article.
-
Decoding PANoptosis in Gout: Signature Gene Identification and Immune Infiltration Profiling.Int J Rheum Dis. 2025 Jul;28(7):e70344. doi: 10.1111/1756-185X.70344. Int J Rheum Dis. 2025. PMID: 40613560 Free PMC article.
References
-
- Dalbeth N., Gosling A.L., Gaffo A., Abhishek A. Gout. Lancet. 2021;397:1843–1855. - PubMed
-
- Rome K., Frecklington M., McNair P., Gow P., Dalbeth N. Foot pain, impairment, and disability in patients with acute gout flares: a prospective observational study. Arthritis Care Res. 2012;64:384–388. - PubMed
-
- Singh J.A., Herbey I., Bharat A., Dinnella J.E., Pullman-Mooar S., Eisen S., Ivankova N. Gout self-management in african American veterans: a qualitative exploration of challenges and solutions from patients' perspectives. Arthritis Care Res. 2017;69:1724–1732. - PubMed
-
- Neogi T., Jansen T.L., Dalbeth N., Fransen J., Schumacher H.R., Berendsen D., Brown M., Choi H., Edwards N.L., Janssens H.J., Liote F., Naden R.P., Nuki G., Ogdie A., Perez-Ruiz F., Saag K., Singh J.A., Sundy J.S., Tausche A.K., Vazquez-Mellado J., Yarows S.A., Taylor W.J. Gout classification criteria: an American college of rheumatology/European league against rheumatism collaborative initiative. Arthritis Rheumatol. 2015;67:2557–2568. - PMC - PubMed
-
- Dehlin M., Jacobsson L., Roddy E. Global epidemiology of gout: prevalence, incidence, treatment patterns and risk factors. Nat. Rev. Rheumatol. 2020;16:380–390. - PubMed
LinkOut - more resources
Full Text Sources
Research Materials
