

Unitig-centered pan-genome machine learning approach for predicting antibiotic resistance and discovering novel resistance genes in bacterial strains
- PMID: 38707536
- PMCID: PMC11067008
- DOI: 10.1016/j.csbj.2024.04.035
Unitig-centered pan-genome machine learning approach for predicting antibiotic resistance and discovering novel resistance genes in bacterial strains
Abstract
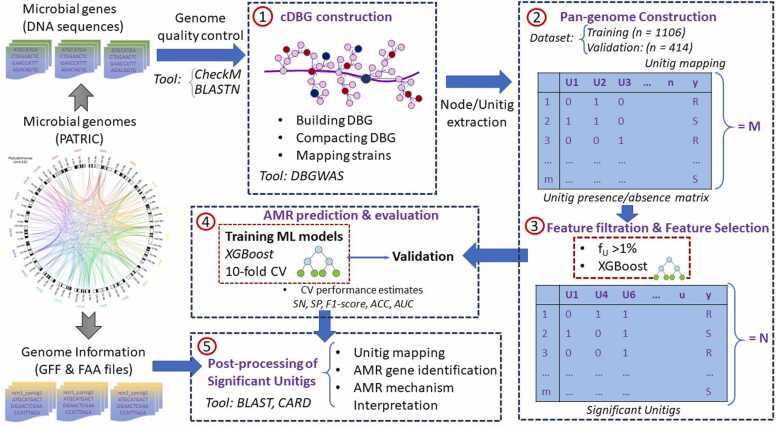
In current genomic research, the widely used methods for predicting antimicrobial resistance (AMR) often rely on prior knowledge of known AMR genes or reference genomes. However, these methods have limitations, potentially resulting in imprecise predictions owing to incomplete coverage of AMR mechanisms and genetic variations. To overcome these limitations, we propose a pan-genome-based machine learning approach to advance our understanding of AMR gene repertoires and uncover possible feature sets for precise AMR classification. By building compacted de Brujin graphs (cDBGs) from thousands of genomes and collecting the presence/absence patterns of unique sequences (unitigs) for Pseudomonas aeruginosa, we determined that using machine learning models on unitig-centered pan-genomes showed significant promise for accurately predicting the antibiotic resistance or susceptibility of microbial strains. Applying a feature-selection-based machine learning algorithm led to satisfactory predictive performance for the training dataset (with an area under the receiver operating characteristic curve (AUC) of > 0.929) and an independent validation dataset (AUC, approximately 0.77). Furthermore, the selected unitigs revealed previously unidentified resistance genes, allowing for the expansion of the resistance gene repertoire to those that have not previously been described in the literature on antibiotic resistance. These results demonstrate that our proposed unitig-based pan-genome feature set was effective in constructing machine learning predictors that could accurately identify AMR pathogens. Gene sets extracted using this approach may offer valuable insights into expanding known AMR genes and forming new hypotheses to uncover the underlying mechanisms of bacterial AMR.
Keywords: Antimicrobial resistance; De Bruijn graph, Feature selection; Pseudomonas aeruginosa; Unitig.
© 2024 The Authors.
Conflict of interest statement
The authors have no conflicts of interest to declare. All co-authors have seen and agree with the contents of the manuscript and there is no financial interest to report. We certify that the submission is original work and is not under review at any other publication.
Figures


Similar articles
-
Enhancing predictions of antimicrobial resistance of pathogens by expanding the potential resistance gene repertoire using a pan-genome-based feature selection approach.BMC Bioinformatics. 2022 Apr 15;23(Suppl 4):131. doi: 10.1186/s12859-022-04666-2. BMC Bioinformatics. 2022. PMID: 35428201 Free PMC article.
-
A Cross-Validated Feature Selection (CVFS) approach for extracting the most parsimonious feature sets and discovering potential antimicrobial resistance (AMR) biomarkers.Comput Struct Biotechnol J. 2022 Dec 28;21:769-779. doi: 10.1016/j.csbj.2022.12.046. eCollection 2023. Comput Struct Biotechnol J. 2022. PMID: 36698972 Free PMC article.
-
A pan-genome-based machine learning approach for predicting antimicrobial resistance activities of the Escherichia coli strains.Bioinformatics. 2018 Jul 1;34(13):i89-i95. doi: 10.1093/bioinformatics/bty276. Bioinformatics. 2018. PMID: 29949970 Free PMC article.
-
Machine Learning for Antimicrobial Resistance Prediction: Current Practice, Limitations, and Clinical Perspective.Clin Microbiol Rev. 2022 Sep 21;35(3):e0017921. doi: 10.1128/cmr.00179-21. Epub 2022 May 25. Clin Microbiol Rev. 2022. PMID: 35612324 Free PMC article. Review.
-
Machine learning: novel bioinformatics approaches for combating antimicrobial resistance.Curr Opin Infect Dis. 2017 Dec;30(6):511-517. doi: 10.1097/QCO.0000000000000406. Curr Opin Infect Dis. 2017. PMID: 28914640 Review.
References
-
- Wheeler N.E., et al. Contrasting approaches to genome-wide association studies impact the detection of resistance mechanisms in Staphylococcus aureus. bioRxiv. 2019
LinkOut - more resources
Full Text Sources