

Nanoparticle/Engineered Bacteria Based Triple-Strategy Delivery System for Enhanced Hepatocellular Carcinoma Cancer Therapy
- PMID: 38708180
- PMCID: PMC11068060
- DOI: 10.2147/IJN.S453709
Nanoparticle/Engineered Bacteria Based Triple-Strategy Delivery System for Enhanced Hepatocellular Carcinoma Cancer Therapy
Abstract
Background: New treatment modalities for hepatocellular carcinoma (HCC) are desperately critically needed, given the lack of specificity, severe side effects, and drug resistance with single chemotherapy. Engineered bacteria can target and accumulate in tumor tissues, induce an immune response, and act as drug delivery vehicles. However, conventional bacterial therapy has limitations, such as drug loading capacity and difficult cargo release, resulting in inadequate therapeutic outcomes. Synthetic biotechnology can enhance the precision and efficacy of bacteria-based delivery systems. This enables the selective release of therapeutic payloads in vivo.
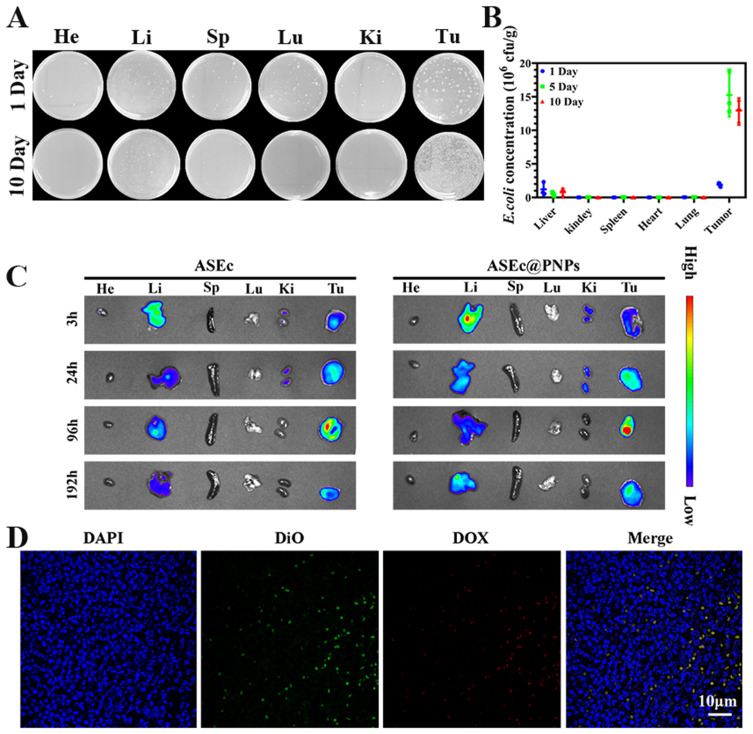
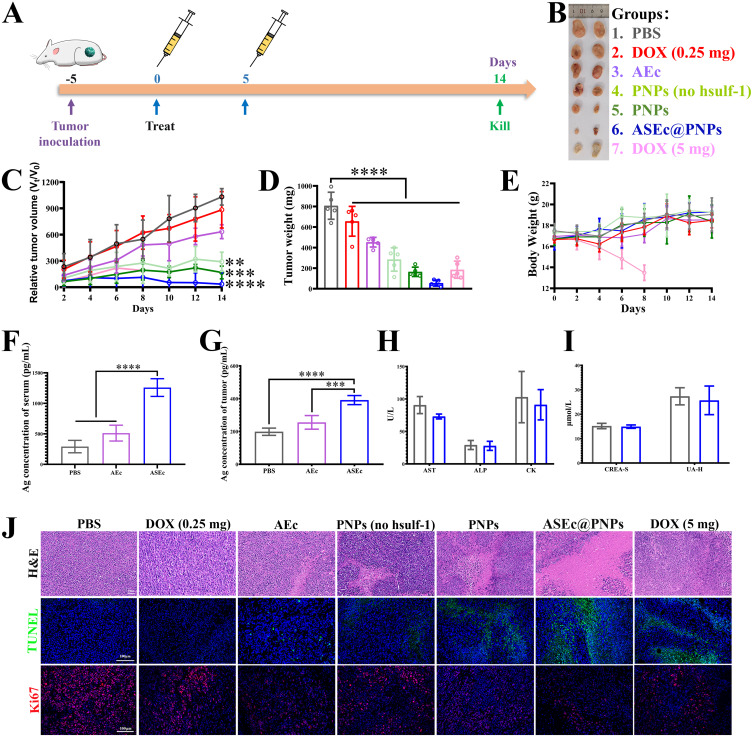
Methods: In this study, we constructed a non-pathogenic Escherichia coli (E. coli) with a synchronized lysis circuit as both a drug/gene delivery vehicle and an in-situ (hepatitis B surface antigen) Ag (ASEc) producer. Polyethylene glycol (CHO-PEG2000-CHO)-poly(ethyleneimine) (PEI25k)-citraconic anhydride (CA)-doxorubicin (DOX) nanoparticles loaded with plasmid encoded human sulfatase 1 (hsulf-1) enzyme (PNPs) were anchored on the surface of ASEc (ASEc@PNPs). The composites were synthesized and characterized. The in vitro and in vivo anti-tumor effect of ASEc@PNPs was tested in HepG2 cell lines and a mouse subcutaneous tumor model.
Results: The results demonstrated that upon intravenous injection into tumor-bearing mice, ASEc can actively target and colonise tumor sites. The lytic genes to achieve blast and concentrated release of Ag significantly increased cytokine secretion and the intratumoral infiltration of CD4/CD8+T cells, initiated a specific immune response. Simultaneously, the PNPs system releases hsulf-1 and DOX into the tumor cell resulting in rapid tumor regression and metastasis prevention.
Conclusion: The novel drug delivery system significantly suppressed HCC in vivo with reduced side effects, indicating a potential strategy for clinical HCC therapy.
Keywords: anti-angiogenesis; chemotherapy; engineered bacteria; hepatocellular carcinoma; immunotherapy.
© 2024 Yang et al.
Conflict of interest statement
The authors report no conflicts of interest in this work.
Figures


Similar articles
-
Intratumoral Administration of Thermosensitive Hydrogel Co-Loaded with Norcantharidin Nanoparticles and Doxorubicin for the Treatment of Hepatocellular Carcinoma.Int J Nanomedicine. 2021 Jun 15;16:4073-4085. doi: 10.2147/IJN.S308057. eCollection 2021. Int J Nanomedicine. 2021. PMID: 34163160 Free PMC article.
-
Functional Doxorubicin-Loaded Omega-3 Unsaturated Fatty Acids Nanoparticles in Reversing Hepatocellular Carcinoma Multidrug Resistance.Med Sci Monit. 2021 Feb 1;27:e927727. doi: 10.12659/MSM.927727. Med Sci Monit. 2021. PMID: 33524008 Free PMC article.
-
Dual-Drug Loaded Nanobubbles Combined with Sonodynamic and Chemotherapy for Hepatocellular Carcinoma Therapy.Int J Nanomedicine. 2024 Jul 19;19:7367-7381. doi: 10.2147/IJN.S460329. eCollection 2024. Int J Nanomedicine. 2024. PMID: 39050872 Free PMC article.
-
Nano-based drug delivery systems in hepatocellular carcinoma.J Drug Target. 2024 Nov;32(9):977-995. doi: 10.1080/1061186X.2024.2365937. Epub 2024 Jun 18. J Drug Target. 2024. PMID: 38847573 Review.
-
[Advances in Nanotechnology-Based Drug Delivery Systems in the Treatment of Hepatocellular Carcinoma].Zhongguo Yi Xue Ke Xue Yuan Xue Bao. 2024 Jun;46(3):384-392. doi: 10.3881/j.issn.1000-503X.15669. Zhongguo Yi Xue Ke Xue Yuan Xue Bao. 2024. PMID: 38953262 Review. Chinese.
Cited by
-
Gut microbiota-mediated gut-liver axis: a breakthrough point for understanding and treating liver cancer.Clin Mol Hepatol. 2025 Apr;31(2):350-381. doi: 10.3350/cmh.2024.0857. Epub 2024 Dec 11. Clin Mol Hepatol. 2025. PMID: 39659059 Free PMC article. Review.
-
Racial/Ethnic Disparities and Immunotherapeutic Advances in the Treatment of Hepatocellular Carcinoma.Cancers (Basel). 2024 Jul 3;16(13):2446. doi: 10.3390/cancers16132446. Cancers (Basel). 2024. PMID: 39001508 Free PMC article. Review.
-
Gut microbiome-specific nanoparticle-based therapeutics for liver diseases.World J Gastroenterol. 2025 Jul 21;31(27):109105. doi: 10.3748/wjg.v31.i27.109105. World J Gastroenterol. 2025. PMID: 40741099 Free PMC article. Review.
-
A Graphene-Based Lipid Modulation Nanoplatform for Synergetic Lipid Starvation/Chemo/Photothermal Therapy of Oral Squamous Cell Carcinoma.Int J Nanomedicine. 2024 Nov 4;19:11235-11255. doi: 10.2147/IJN.S478308. eCollection 2024. Int J Nanomedicine. 2024. PMID: 39524917 Free PMC article.
-
A smart all-in-one strategy based on hybrid bacteria with targeting drug delivery and spatiotemporal drug release to boost the synergistic therapeutic efficacy against TNBC.Mater Today Bio. 2025 May 8;32:101849. doi: 10.1016/j.mtbio.2025.101849. eCollection 2025 Jun. Mater Today Bio. 2025. PMID: 40475857 Free PMC article.
References
MeSH terms
Substances
LinkOut - more resources
Full Text Sources
Medical
Research Materials
