. 2024 Apr 15;9(17):19169-19181.
doi: 10.1021/acsomega.3c10316. eCollection 2024 Apr 30.

Correlation between Mitochondria-Associated Endoplasmic Reticulum Membrane-Related Genes and Cellular Senescence-Related Genes in Osteoarthritis

Affiliations

Correlation between Mitochondria-Associated Endoplasmic Reticulum Membrane-Related Genes and Cellular Senescence-Related Genes in Osteoarthritis

Hui-Min Li et al. ACS Omega. .

Abstract

Background: The role of mitochondria-associated endoplasmic reticulum membrane (MAM) formation in the development of osteoarthritis (OA) is yet unclear.

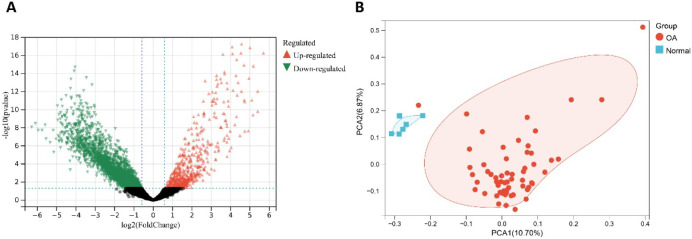
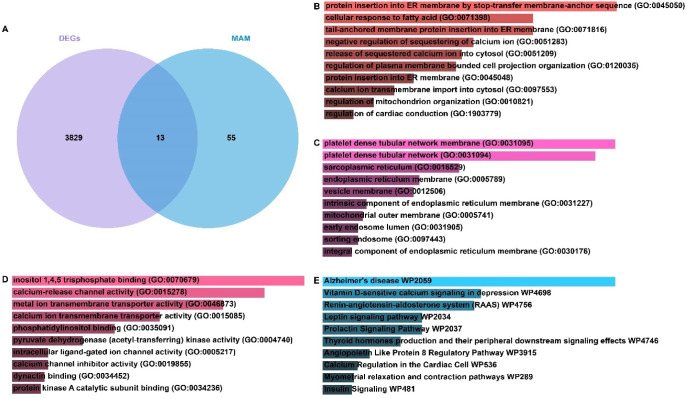
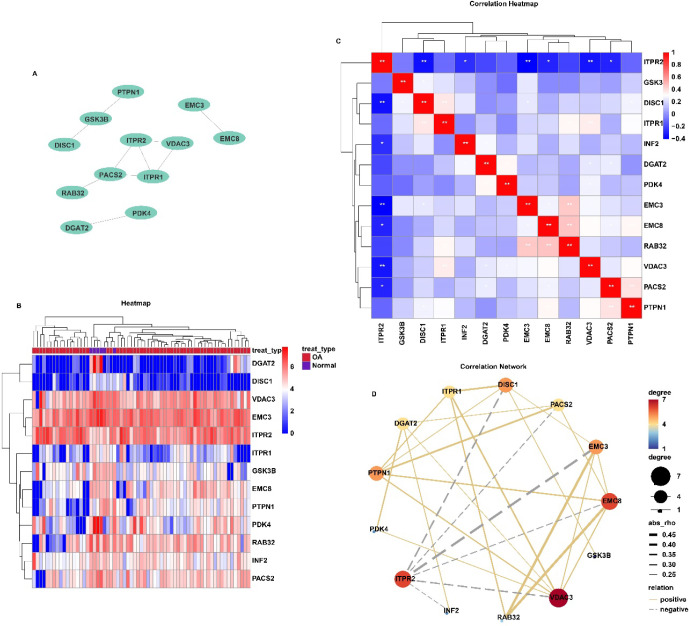
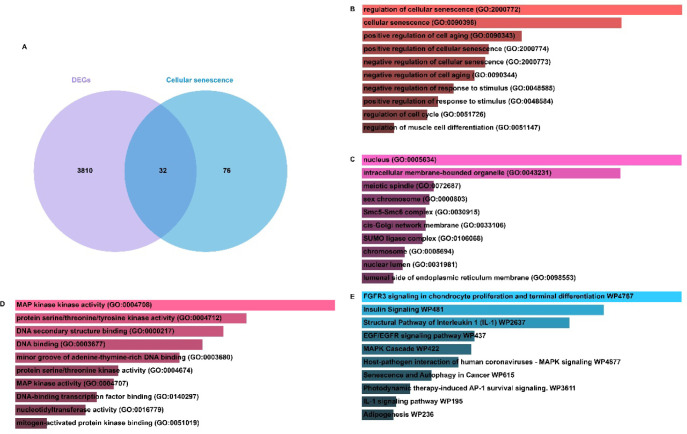
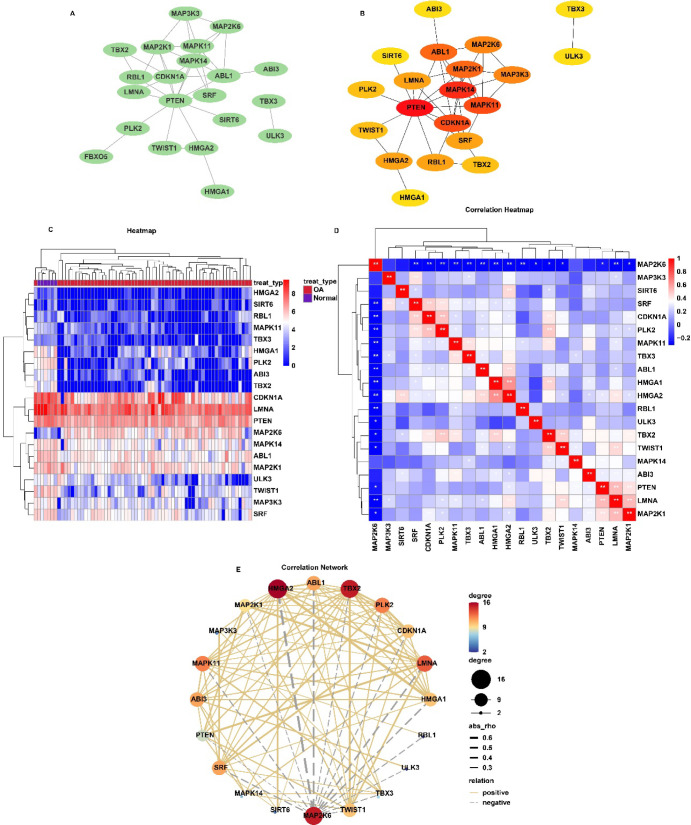
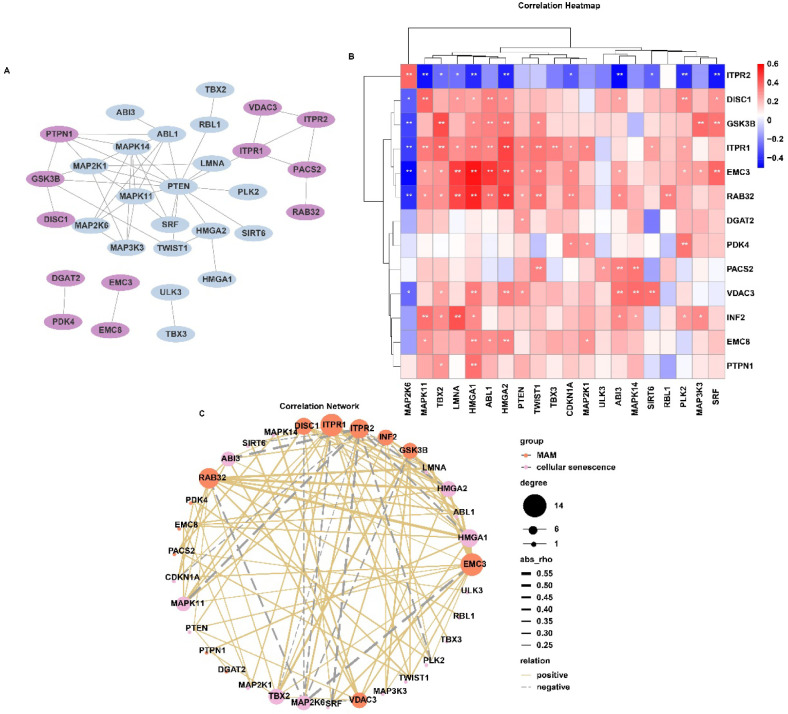
Methods: A mix of bioinformatics methods and in vitro experimental methodologies was used to study and corroborate the role of MAM-related genes and cellular senescence-related genes in the development of OA. The Gene Expression Omnibus database was used to obtain the microarray information that is relevant to the OA. Several bioinformatic methods were employed to carry out function enrichment analysis and protein-protein correlation analysis, build the correlation regulatory network, and investigate potential relationships between MAM-related genes and cellular senescence-related genes in OA. These methods also served to identify the MAM-related and OA-related genes (MAM-OARGs).

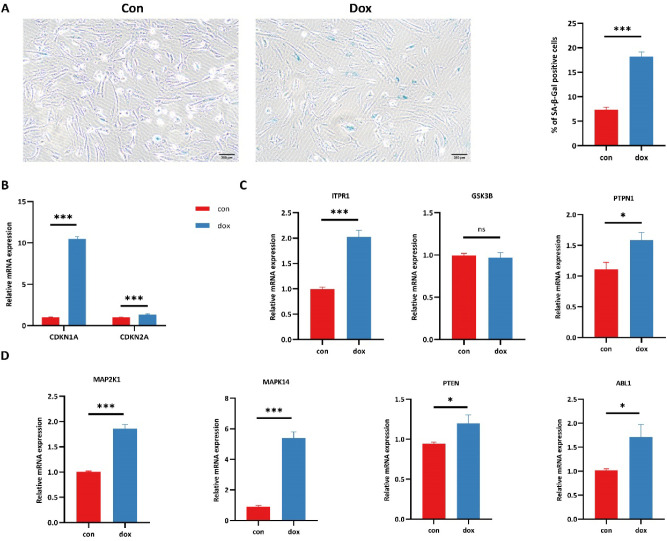
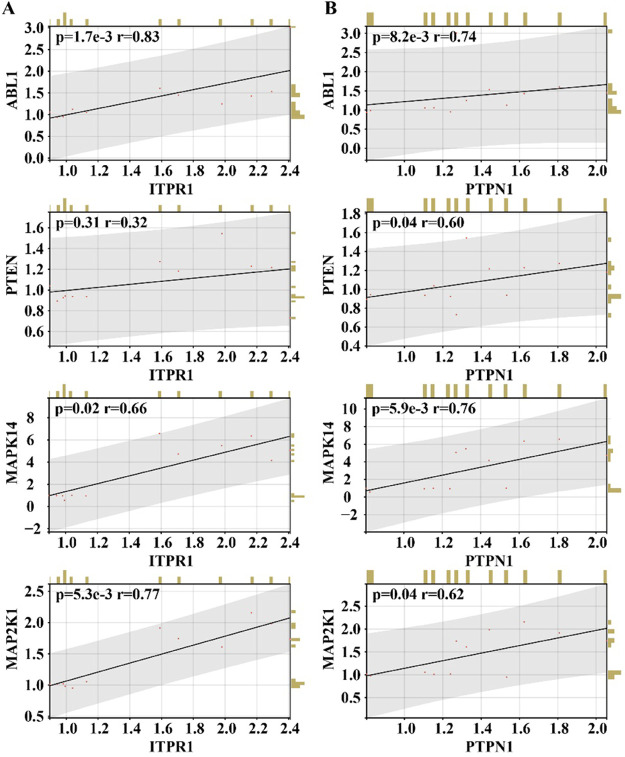
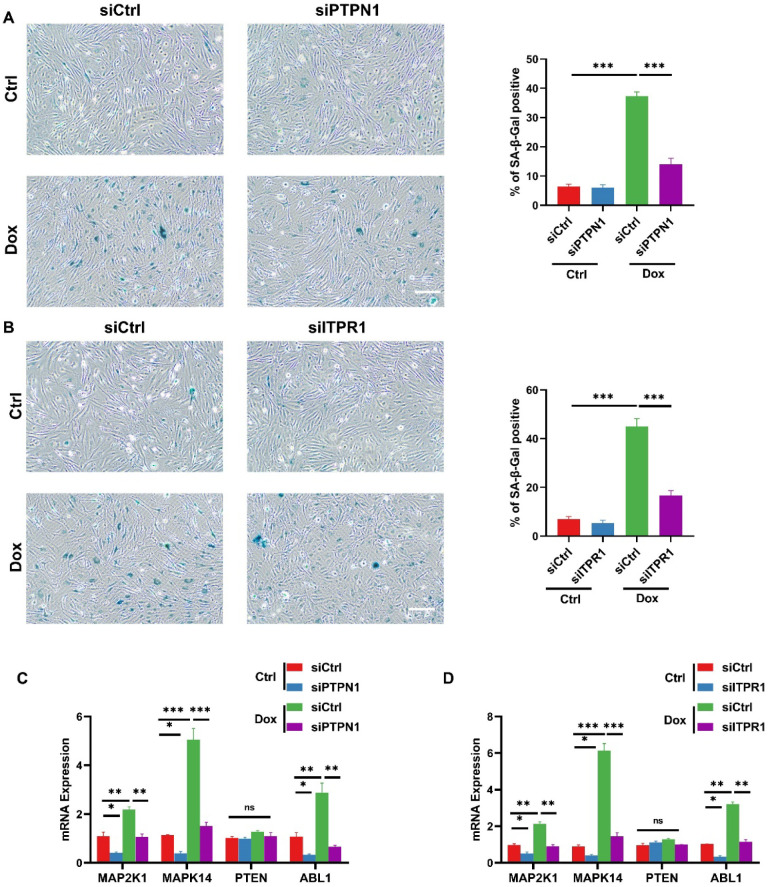
Results: For the additional functional enrichment analysis, a total of 13 MAM-OARGs were detected. The correlation regulatory network was also created. Hub MAM-OARGs were shown to have a strong correlation with genes relevant to cellular senescence in OA. Results of in vitro experiments further demonstrated a positive correlation between MAM-OARGs (PTPN1 and ITPR1) and cellular senescence-related and OA-related genes.

Conclusions: As a result, our findings can offer new insights into the investigations of MAM-related genes and cellular senescence-related genes, which could be linked to the OA as well as brand-new potential treatment targets.


Conflict of interest statement

The authors declare no competing financial interest.

Figures

Figure 1
Figure 1
(A) Volcano plot of the OA-related genes. (B) PCA of OA and normal samples. The black dots represent RNAs that are not differentially expressed, and the red and green dots represent the upregulated and downregulated RNAs, respectively.
Figure 2
Figure 2
(A) Intersection between MAMRGs and OA-related genes. GO (biological process, cell component, and molecular function) and KEGG annotation for the MAM-OARGs: (B) biological process; (C) cell component; (D) molecular function; (E) pathway. Ranking by-log10(p-value). MAM, mitochondria-associated endoplasmic reticulum membrane; MAMRGs, MAM-related genes; MAM-OARGs, MAM-related and OA-related genes.
Figure 3
Figure 3
(A) PPI network of MAM-OARGs; (B) heat map of expression of MAM-OARGs; (C) eat map of correlation of MAM-OARGs; (D) correlation network of MAM-OARGs. MAM, mitochondria-associated endoplasmic reticulum membrane; MAM-OARGs, MAM-related and OA-related genes.
Figure 4
Figure 4
(A) Intersection between CS-related genes and OA-related genes (CS-OARGs). GO (biological process, cell component, and molecular function) and KEGG annotation for the CS-OARGs: (B) biological process; (C) cell component; (D) molecular function; and (E) pathway. Ranking by-log10(p-value). CS-OARGs, cell-senescence-related and OA-related genes.
Figure 5
Figure 5
(A) PPI network of CS-OARGs; (B) PPI network of 20 hub CS-OARGs; (C) heat map of expression of CS-OARGs; (D) heat map of correlation of CS-OARGs; (E) correlation network of CS-OARGs. CS-OARGs, cellular senescence-related and OA-related genes.
Figure 6
Figure 6
(A) PPI network of MAM-OARGs and CS-OARGs; (B) heat map of correlation of MAM-OARGs and CS-OARGs; (C) correlation network of MAM-OARGs and CS-OARGs. MAM, mitochondria-associated endoplasmic reticulum membrane; CS-OARGs, cellular senescence-related and OA-related genes. MAM-OARGs, MAM-related and OA-related genes.
Figure 7
Figure 7
(A) Representative images of SA-β-Gal staining C28/I2 cells were derived from the control group and doxorubicin (dox) group and subsequent quantification of SA-β-Gal staining C28/I2 cells. n = 3, ***p < 0.001. (B) QPCR analysis of mRNA levels of CDKN1A and CDKN2A in C28/I2 cells derived from control group and doxorubicin (dox) group, n = 6, ***p < 0.001. (C) QPCR analysis of mRNA levels of MAM-OARGs, including PTPN1, GSK3B, and ITPR1, in C28/I2 cells derived from control group and doxorubicin (dox) group, n = 6, ns p > 0.05, *p < 0.05, ***p < 0.001. (D) QPCR analysis of mRNA levels of CS-OARGs, including MAP2K1, MAPK14, PTEN, and ABL1, in C28/I2 cells derived from control group and doxorubicin (dox) group, n = 6, *p < 0.05, ***p < 0.001. All data were presented as mean ± SEM. Student’s t test was used for statistical analysis.
Figure 8
Figure 8
(A) Correlation analysis of ITPR1 with CS-OARGs, including MAP2K1, MAPK14, PTEN, and ABL1. (B) Correlation analysis of PTPN1 with CS-OARGs, including MAP2K1, MAPK14, PTEN, and ABL1.
Figure 9
Figure 9
(A)Typical pictures of C28/I2 cells stained with SA-β-Gal from the control and dox groups treated with or without siRNA targeting PTPN1 (si PTPN1), followed by quantification of C28/I2 cells stained with SA-β-Gal. n = 3, scale bar, 200 μm. (B) Typical pictures of C28/I2 cells stained with SA-β-Gal from the control and dox groups treated with or without siRNA targeting ITPR1 (si ITPR1), followed by quantification of the C28/I2 cells stained with SA-β-Gal. n = 3, scale bar, 200 μm. (C) qPCR analysis of mRNA levels of CS-OARGs, including MAP2K1, MAPK14, PTEN, and ABL1 in C28/I2 cells derived from control and dox group treated with or without siPTPN1, n = 3. (D) qPCR analysis of mRNA levels of CS-OARGs, including MAP2K1, MAPK14, PTEN, and ABL1 in C28/I2 cells derived from control and dox group treated with or without siITPR1, n = 3, ns p > 0.05, *p < 0.05, **p < 0.01, ***p < 0.001. All data were presented as mean ± SEM. One-way analysis of variance with Dunnett’s multiple comparisons was used for statistical analysis.

Similar articles

Cited by

References

    1. Loeser R. F.; Goldring S. R.; Scanzello C. R.; Goldring M. B. Osteoarthritis: a disease of the joint as an organ. Arthritis Rheumatol. 2012, 64 (6), 1697–1707. 10.1002/art.34453. - DOI - PMC - PubMed
    1. Hootman J. M.; Helmick C. G. Projections of US prevalence of arthritis and associated activity limitations. Arthritis Rheumatol. 2006, 54 (1), 226–229. 10.1002/art.21562. - DOI - PubMed
    1. Hunter D. J.; Bierma-Zeinstra S. Osteoarthritis. Lancet 2019, 393 (10182), 1745–1759. 10.1016/S0140-6736(19)30417-9. - DOI - PubMed
    1. Zhao B.; Zhang Q.; He Y.; Cao W.; Song W.; Liang X. Targeted metabolomics reveals the aberrant energy status in diabetic peripheral neuropathy and the neuroprotective mechanism of traditional Chinese medicine JinMaiTong. J. Pharm. Anal. 2024, 14 (2), 225–243. 10.1016/j.jpha.2023.09.007. - DOI - PMC - PubMed
    1. Liang X.-L.; Ouyang L.; Yu N.-N.; Sun Z.-H.; Gui Z.-K.; Niu Y.-L.; He Q.-Y.; Zhang J.; Wang Y. Histone deacetylase inhibitor pracinostat suppresses colorectal cancer by inducing CDK5-Drp1 signaling-mediated peripheral mitofission. J. Pharm. Anal. 2023, 13 (10), 1168–1182. 10.1016/j.jpha.2023.06.005. - DOI - PMC - PubMed

LinkOut - more resources