

Spatially resolved metabolomic dataset of distinct human kidney anatomic regions
- PMID: 38708307
- PMCID: PMC11067325
- DOI: 10.1016/j.dib.2024.110431
Spatially resolved metabolomic dataset of distinct human kidney anatomic regions
Abstract
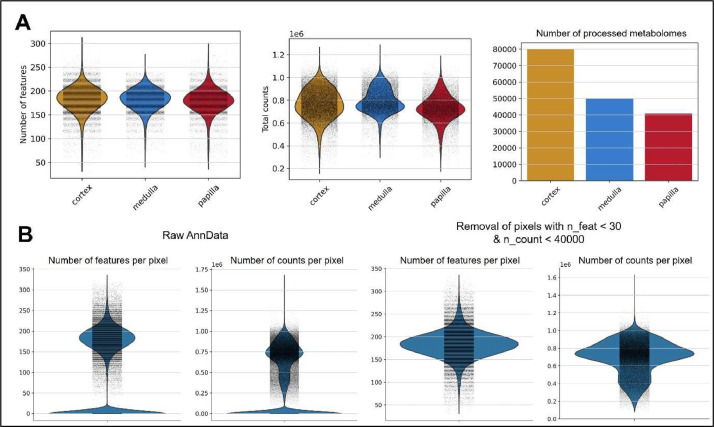
Cortex, medulla and papilla are three major human kidney anatomic structures and they harbour unique metabolic functions, but the underlying metabolomic profiles are largely unknown at spatial resolution. Here, we generated a spatially resolved metabolomics dataset on human kidney cortex, medulla and papilla tissues dissected from the same donor. Matrix-Assisted Laser Desorption/Ionization-Imaging Mass Spectrometry (MALDI-IMS) was used to detect metabolite species over mass-to-charge ratios of 50 -1500 for each section at a resolution of 10 × 10 µm2 pixel size. We present raw data matrix of each sample, feature annotations, raw AnnData merged from three samples and processed AnnData files after quality control, dimensional reduction and data integration, which contains a total of 170,459 spatially resolved metabolomes with 562 features detected. This dataset can be either visualized through an interactive browser or further analyzed to study metabolomic heterogeneity across regional human kidney anatomy.
Keywords: Imaging mass spectrometry; Kidney anatomy; MALDI; Metabolism; Nephrology; Omics.
© 2024 The Author(s).
Figures


References
-
- Li H., Li D., Ledru N., Xuanyuan Q., Wu H., Asthana A., Byers L.N., Tullius S.G., Orlando G., Waikar S.S., Humphreys B.D. Transcriptomic, epigenomic, and spatial metabolomic cell profiling redefines regional human kidney anatomy. Cell Metab. 2024 doi: 10.1016/J.CMET.2024.02.015. Online ahead of print. - DOI - PMC - PubMed
-
- Palmer A., Phapale P., Chernyavsky I., Lavigne R., Fay D., Tarasov A., Kovalev V., Fuchser J., Nikolenko S., Pineau C., Becker M., Alexandrov T. FDR-controlled metabolite annotation for high-resolution imaging mass spectrometry. Nat. Methods. 2016:57–60. doi: 10.1038/nmeth.4072. 2016 141 14. - DOI - PubMed
-
- Gallardo P.A., Vio C.P. Functional anatomy of the kidney. Ren. Physiol. Hydrosaline Metab. 2022 doi: 10.1007/978-3-031-10256-1_2. - DOI
LinkOut - more resources
Full Text Sources
